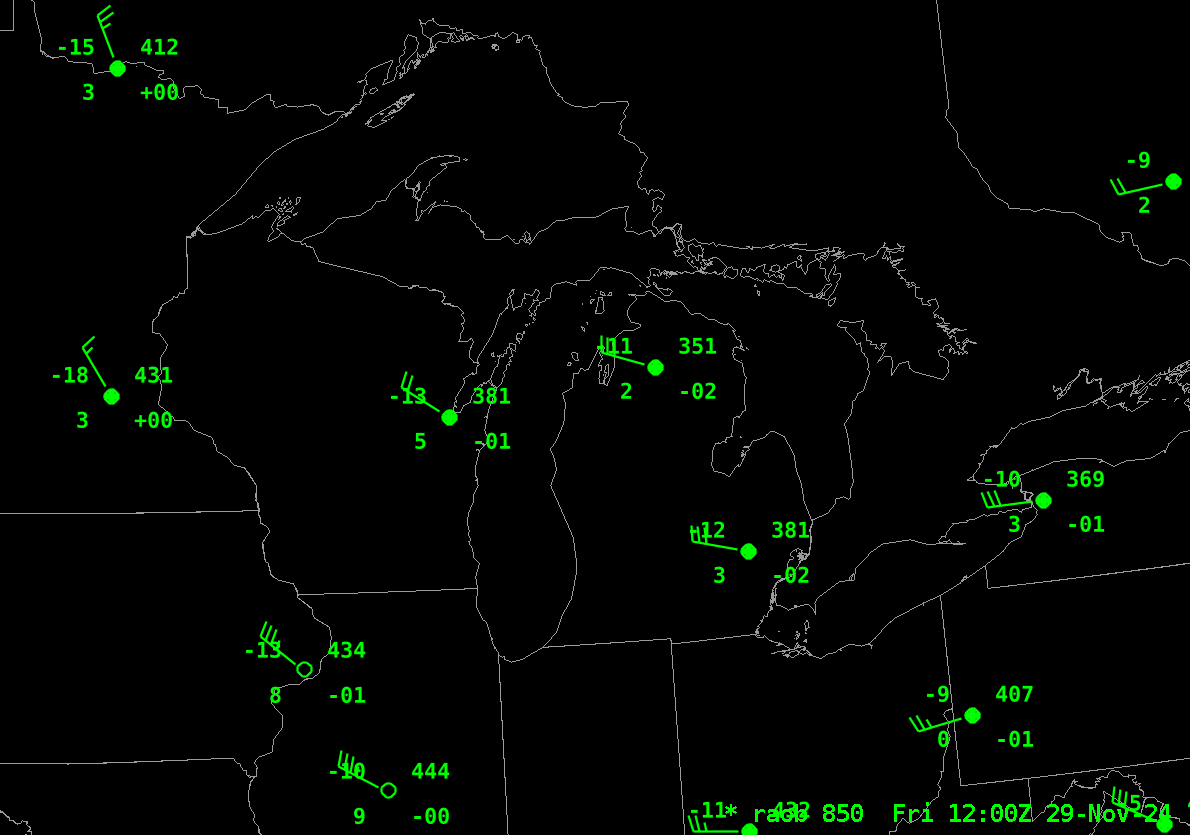
Cold air over the Great Lakes (see the plot of 850-mb temperature from RAOB stations at 1200 UTC below; note the similarity in temperatures and wind speeds over the Great Lakes states) means Lake Effect Snow. The animation above (source) shows snow bands over western lower Michigan and also downwind of Lake St. Clair, and in a single band over Lake Erie. An interesting aspect to this animation (to your blogger, at least), is the distance before the radar detection of snow occurs is pretty large over Lake Michigan, but the band development is almost immediate over Lake St. Clair and just a bit slower over Lake Erie. In addition, lake-effect band development over Lake Ontario is a bit slower than over Erie. Why?
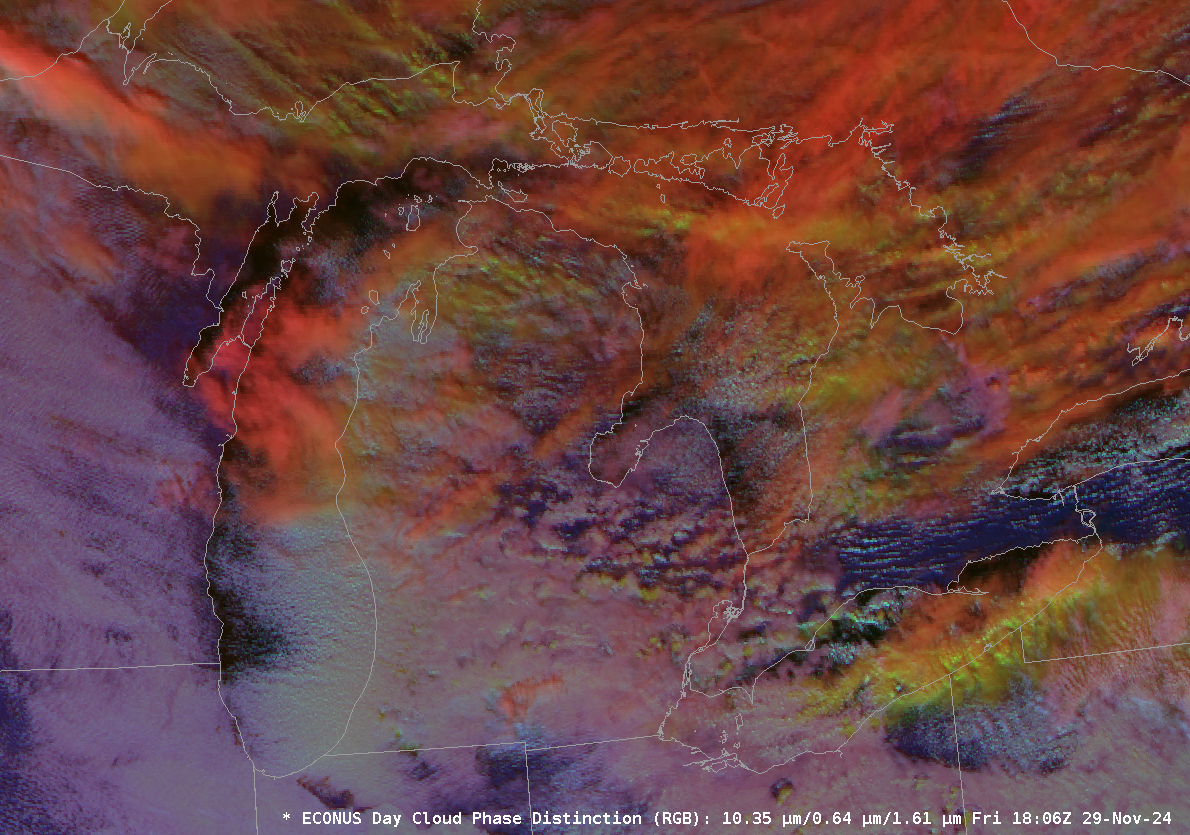
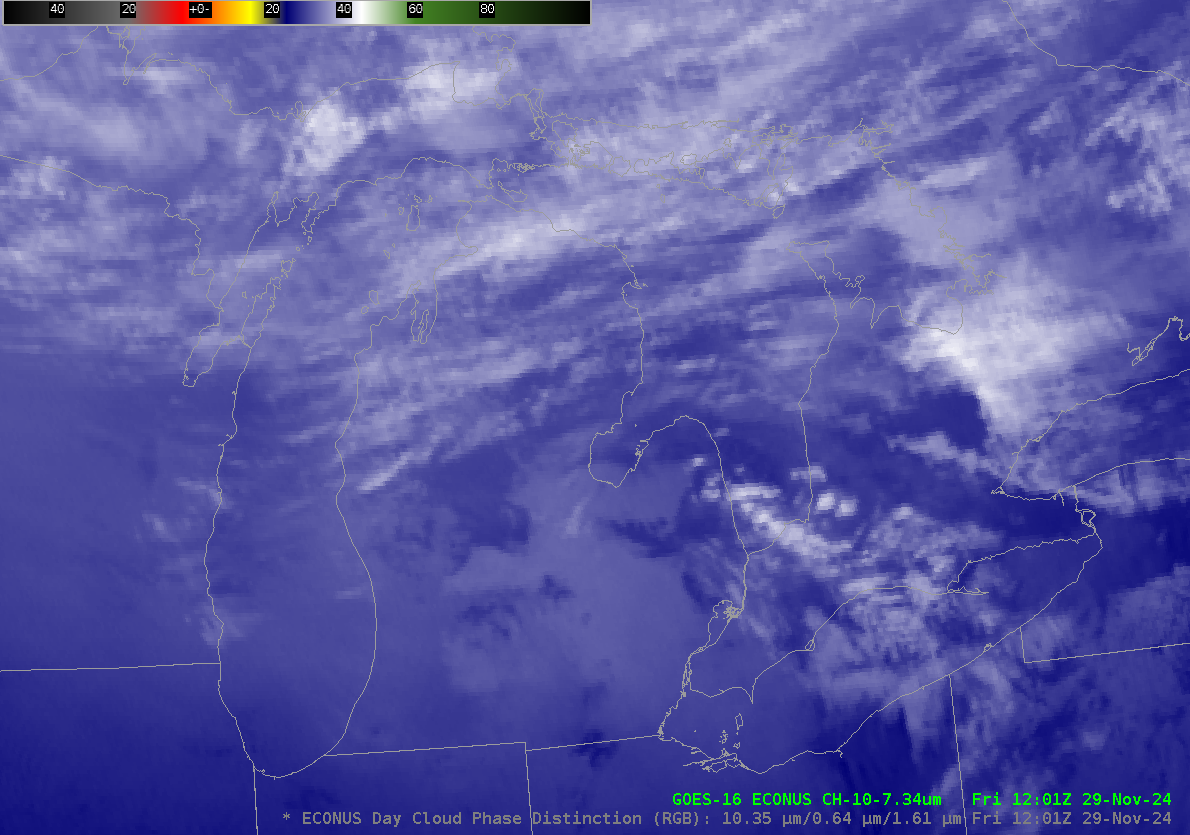
Day Cloud Phase Distinction RGB Imagery from near Noon, below, shows that the bands over Lakes Erie and St. Clair are likely glaciating almost immediately (this is based on the color — yellowish/green — of the RGB in those bands) compared to non-glaciated clouds (cyan or reddish in the RGB) over western Michigan with the lake-effect there. The atmospheric motions one might infer from the cloud and radar motions is from Lake Michigan (where moisture is added to the lower troposphere) across southern Michigan. Once the air re-emerges over Lake Erie, the moisture added over Lake Michigan means an atmosphere more pre-conditioned to the development of clouds.
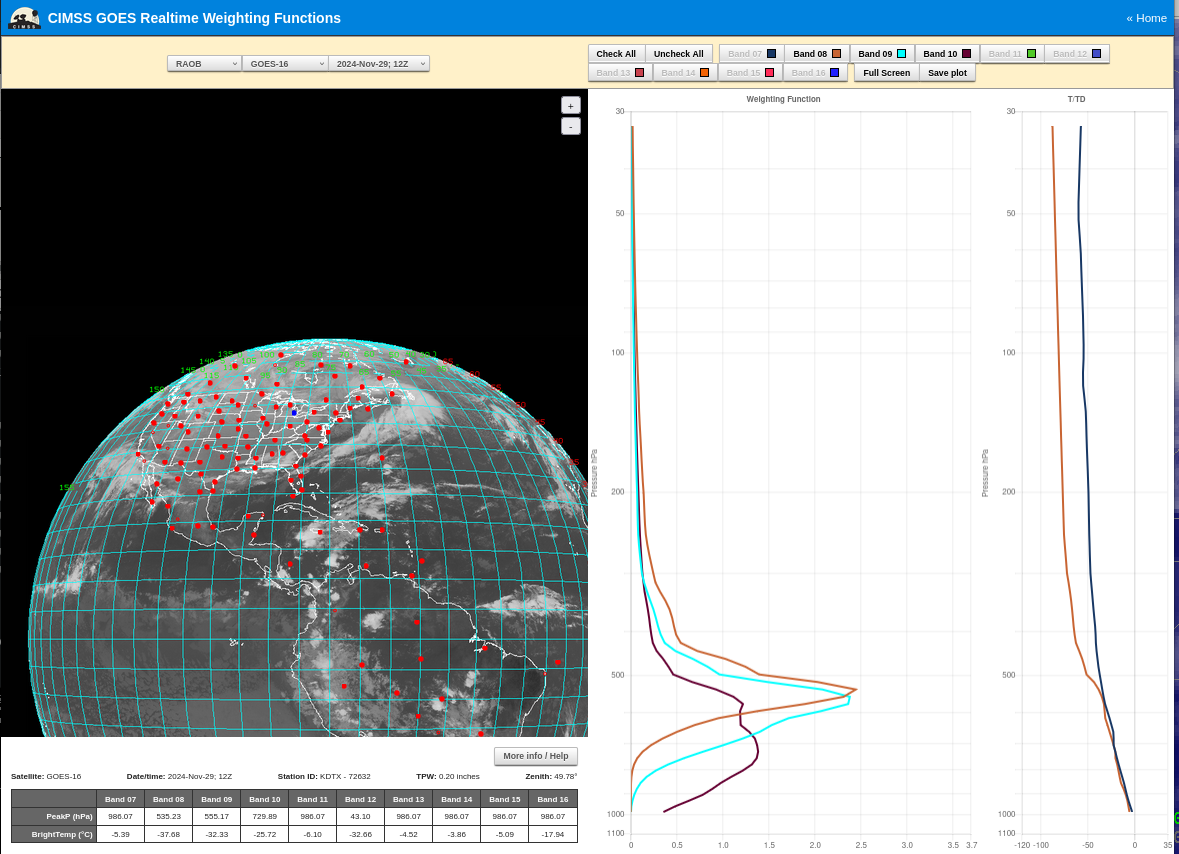
GOES-East Low-level water vapor infrared imagery, below, at 1200 UTC, shows little variability in that field. This suggests that moisture being added to the atmosphere is confined to the lowest part of the atmosphere, below what is detected by the 7.3 µm band. The weighting function for KDTX (that is, White Lake Michigan near Detroit), below, shows information at 7.3 µm is predominantly from the 600-700 mb (assuming clear skies, an admittedly dubious assumption). The GeoXO (the follow-on to the GOES-R series of satellites, scheduled to launch in the mid-2030s) satellite will detect radiation at 5.15 µm, a wavelength that allows moisture detection at even lower levels than bands on GOES-16/GOES-18; perhaps that channel will detect the moistening caused by Lake Michigan that allows Lake Effect Bands to develop more rapidly over downwind lakes, given a suitable trajectory.
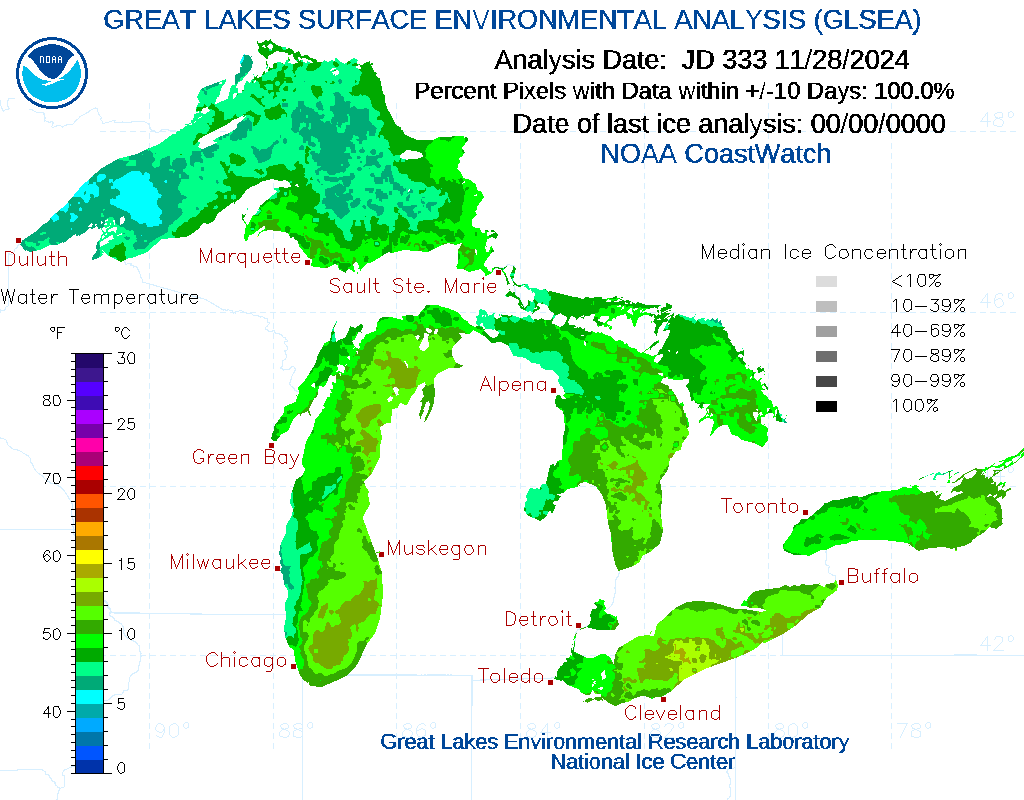
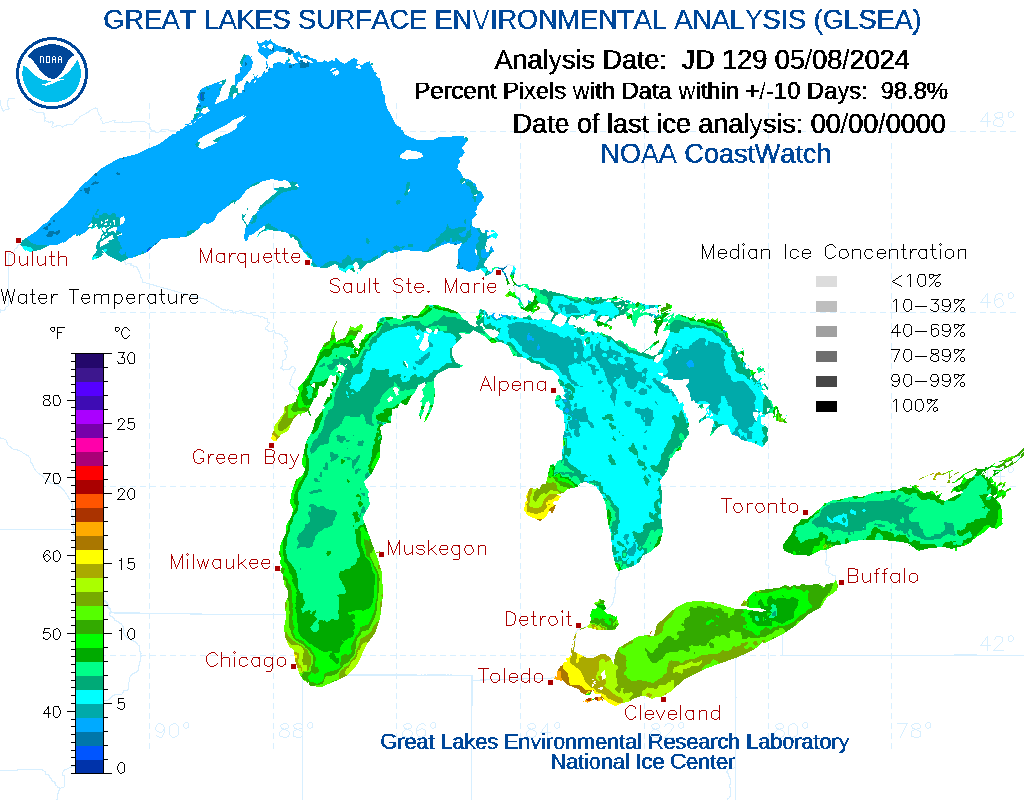
For those (correctly!) wondering if lake surface temperatures might drive the difference in band development, consider the temperature analysis below for 28 November 2024 (source). Michigan and Erie temperatures are very similar.
View only this post Read Less


