

GOES-18 airmass RGB imagery, above (created using geo2grid software), shows the development of a hurricane-force low to the west of Washington and Oregon on the 19th of November. The orange and purple colors in the RGB suggest a significant intrusion of stratospheric air. That air is rich in ozone, and there are satellite observations that can highlight the ozone signal. NUCAPS profiles include information on trace gases, and the image below (from the JSTAR Mapper) shows the ozone distribution on 19 November.

Suomi-NPP also includes the Ozone Mapping and Profiling Suite (OMPS) instrument — available here at NASA Worldview. The animation of OMPS Column Ozone, below (from this source), shows the motion of ozone-rich air from over Alaska on the 17th to the Gulf of Alaska/northeast Pacific Ocean on the 19th.

The evolution of the system is also apparent in the water vapor infrared imagery (GOES-18, Band 8, 6.19 µm) below. Cyclogenesis is rapid on the 19th as an impulse drops southward from Alaska.
GCOM-W1 overflew the strong system at 2112 UTC on 19 November, and the AMSR-2 winds (derived with GAASP software and available here) are shown below. Winds in excess of 64 knots (that is, hurricane-force) are shown west of Washington and Oregon.

SMAP winds (source, also available here), below, at 0101 UTC on 20 November, also show the strong winds with this potent system.

Metop-B and Metop-C both carry the Advanced Scatterometer (ASCAT), and winds from those two satellites above this system are shown below. As with the other microwave-derived windspeeds shown above, the strong winds separate from the center and also with wind features to the south and to the northeast of the center are prominent.
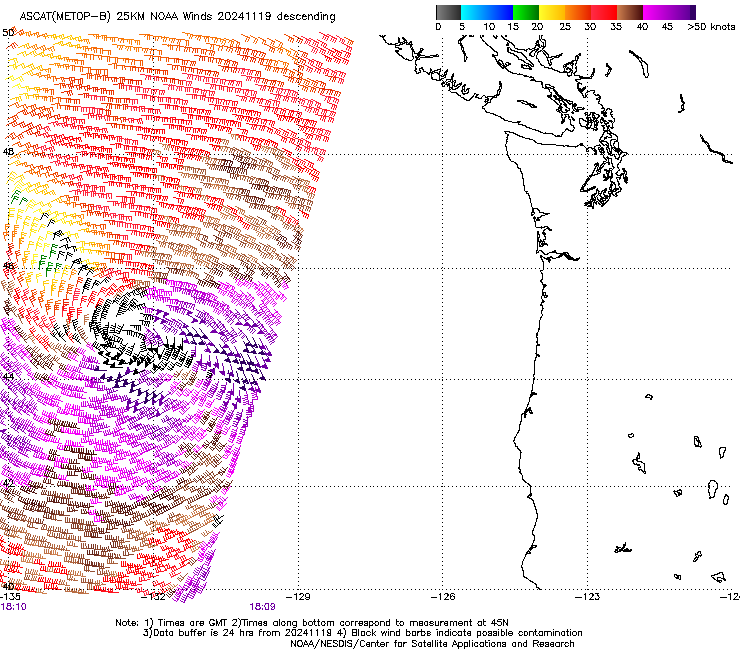
MetopC ASCAT winds are also in AWIPS, and the toggle below shows the fields overlain on top of Band 13 clean window infrared imagery. Two of the plots show all the ASCAT wind barbs; this allows a user to see at a glance the wind distributions. For more information on ASCAT winds, click here.

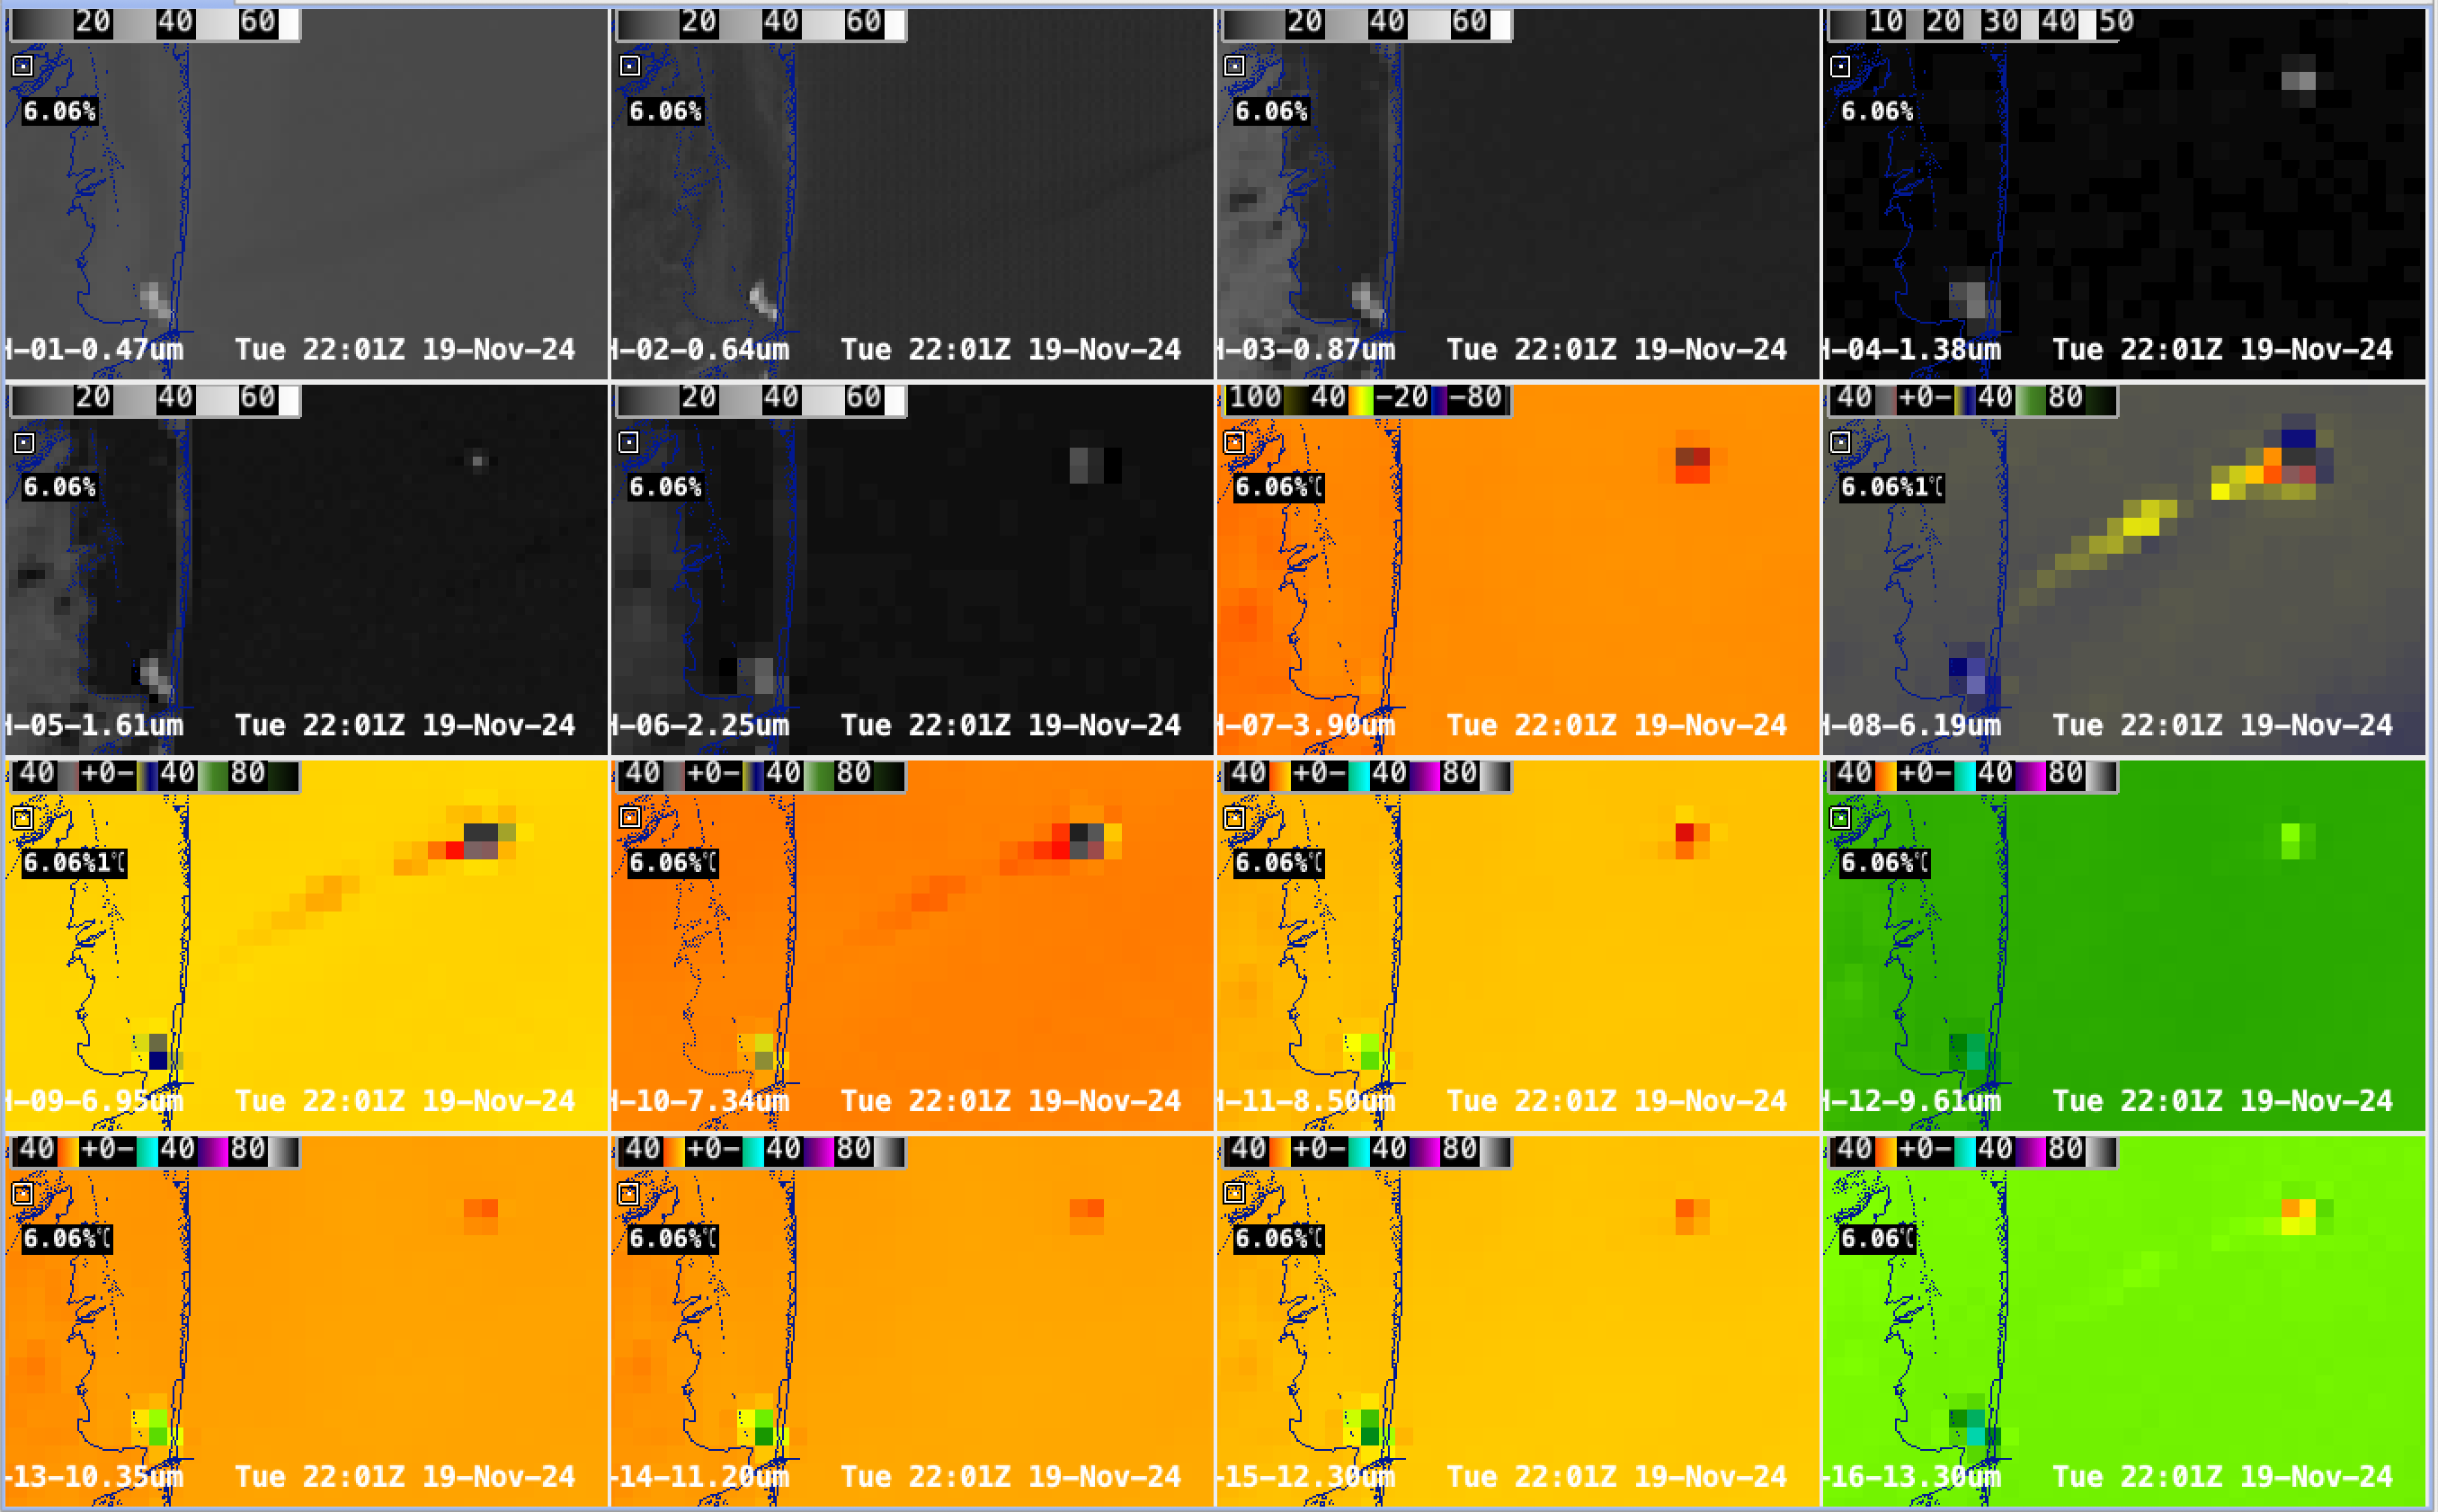
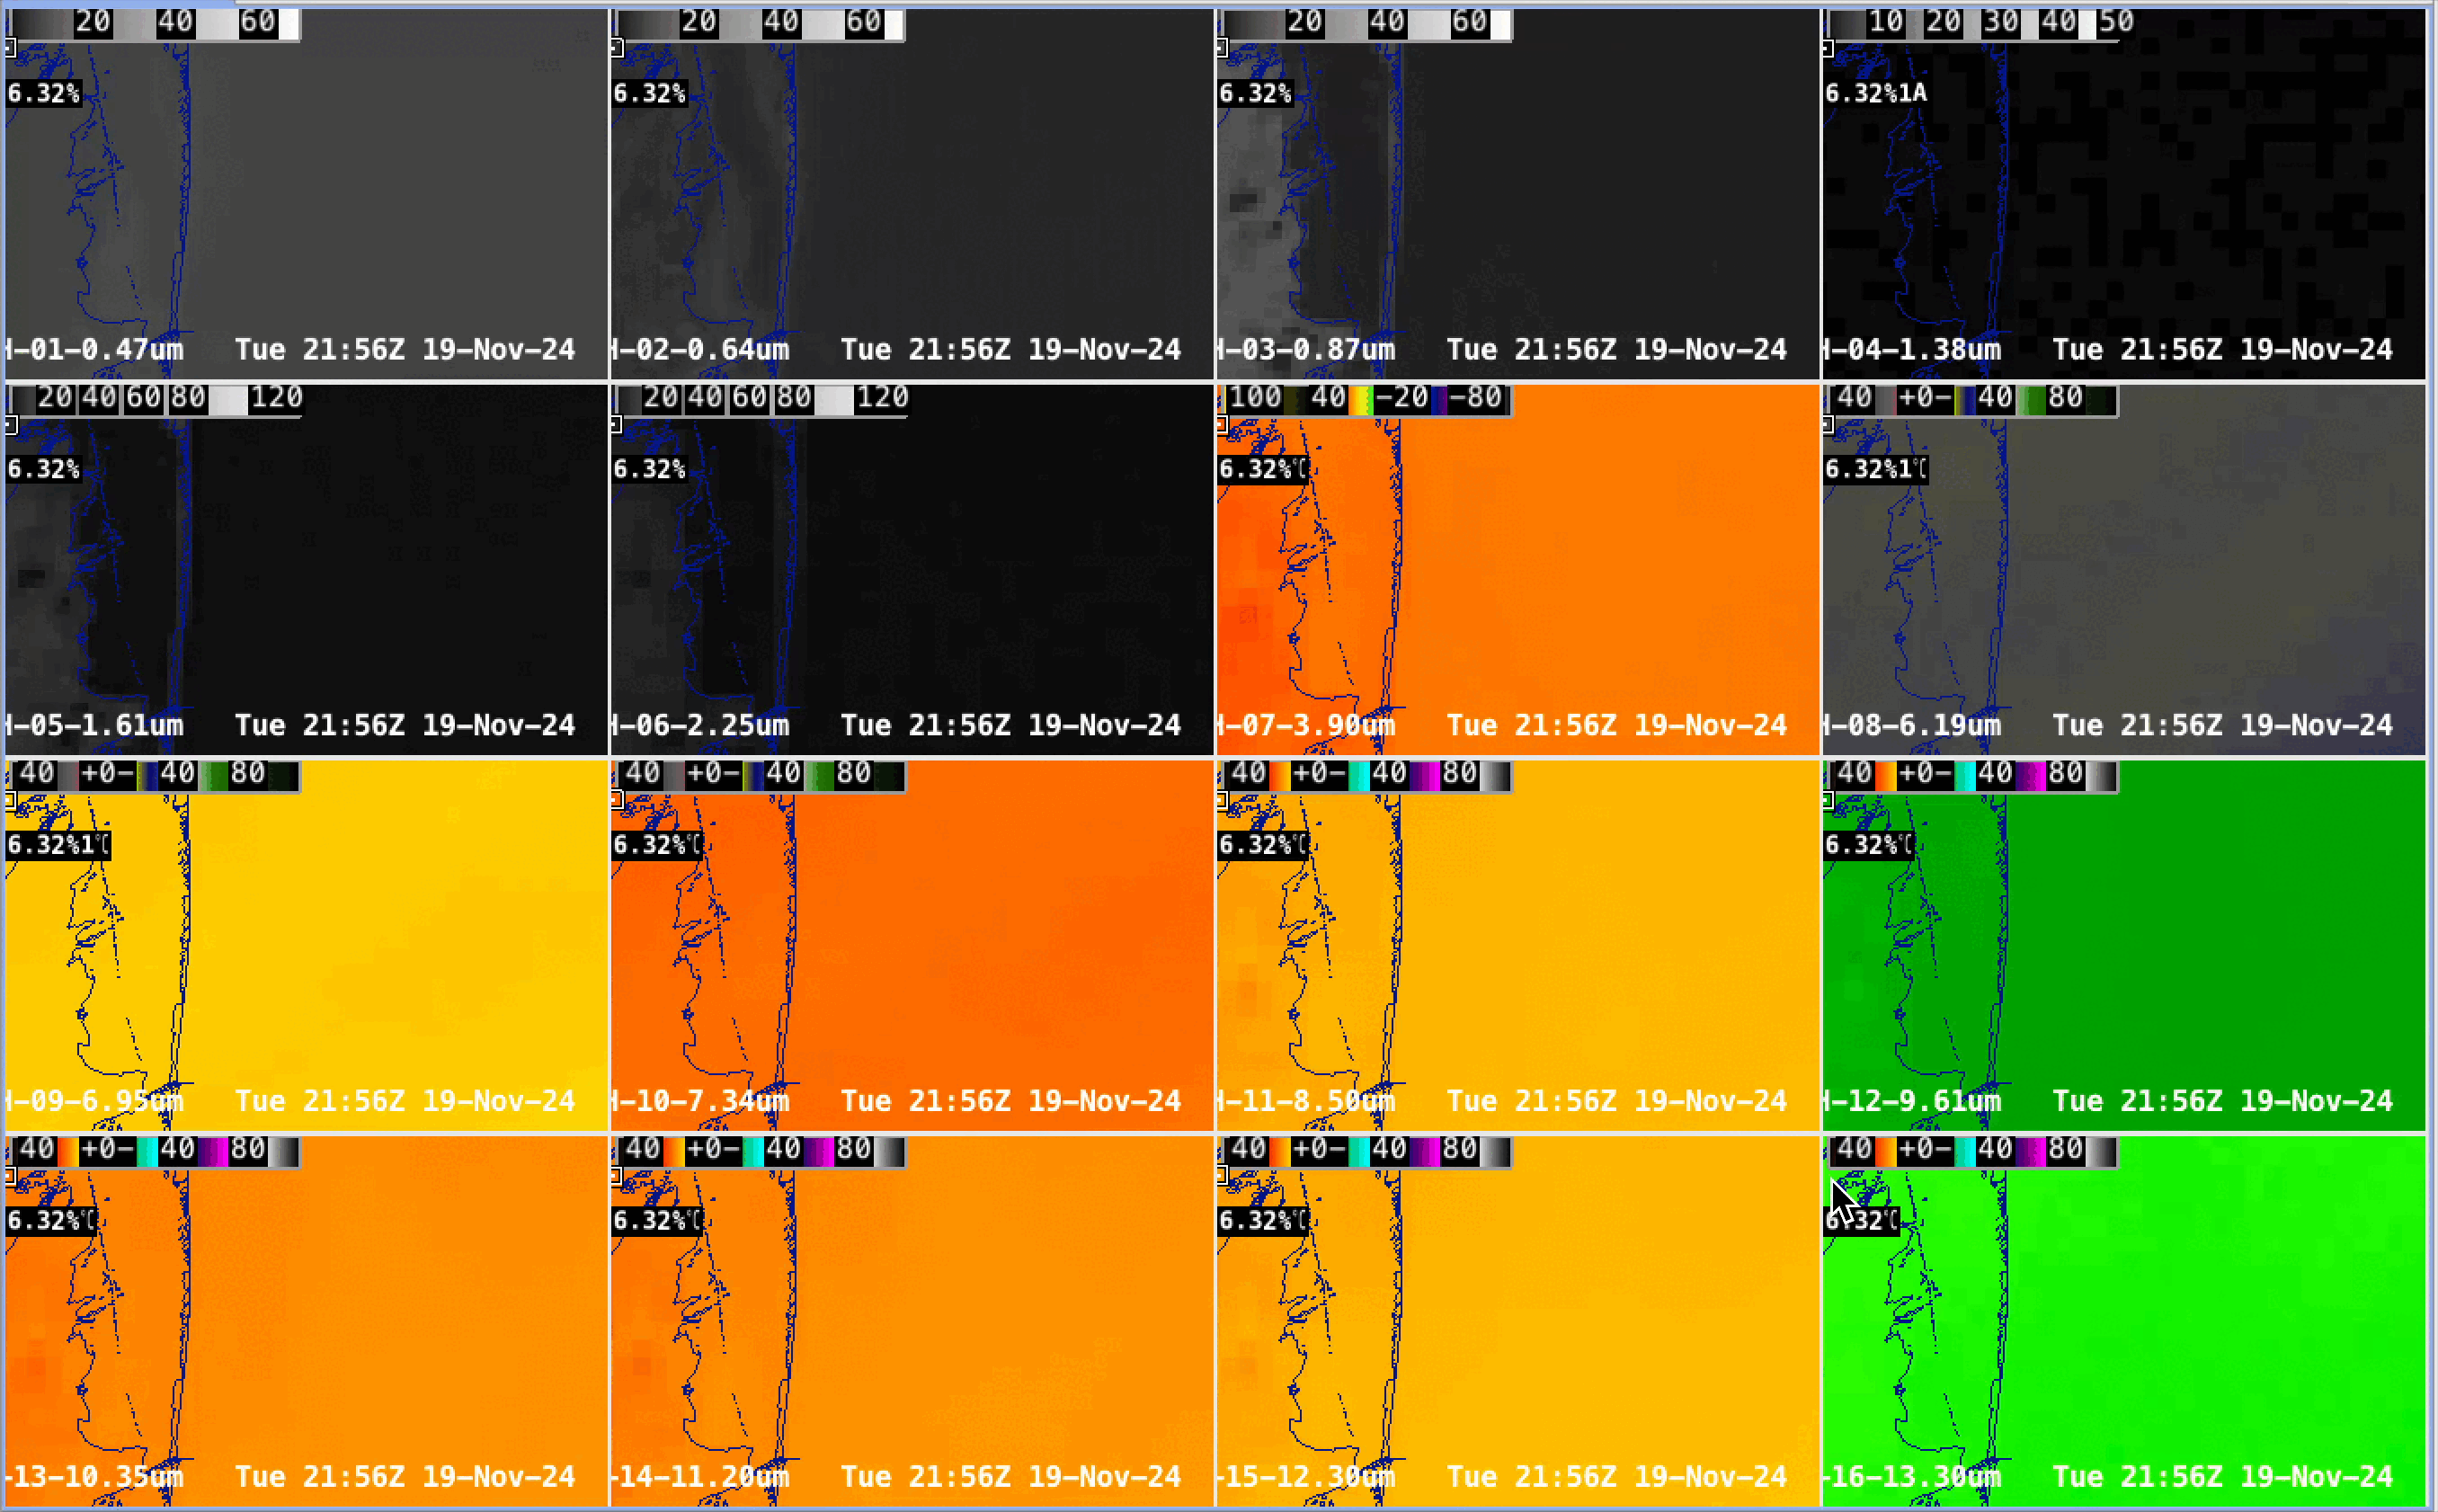
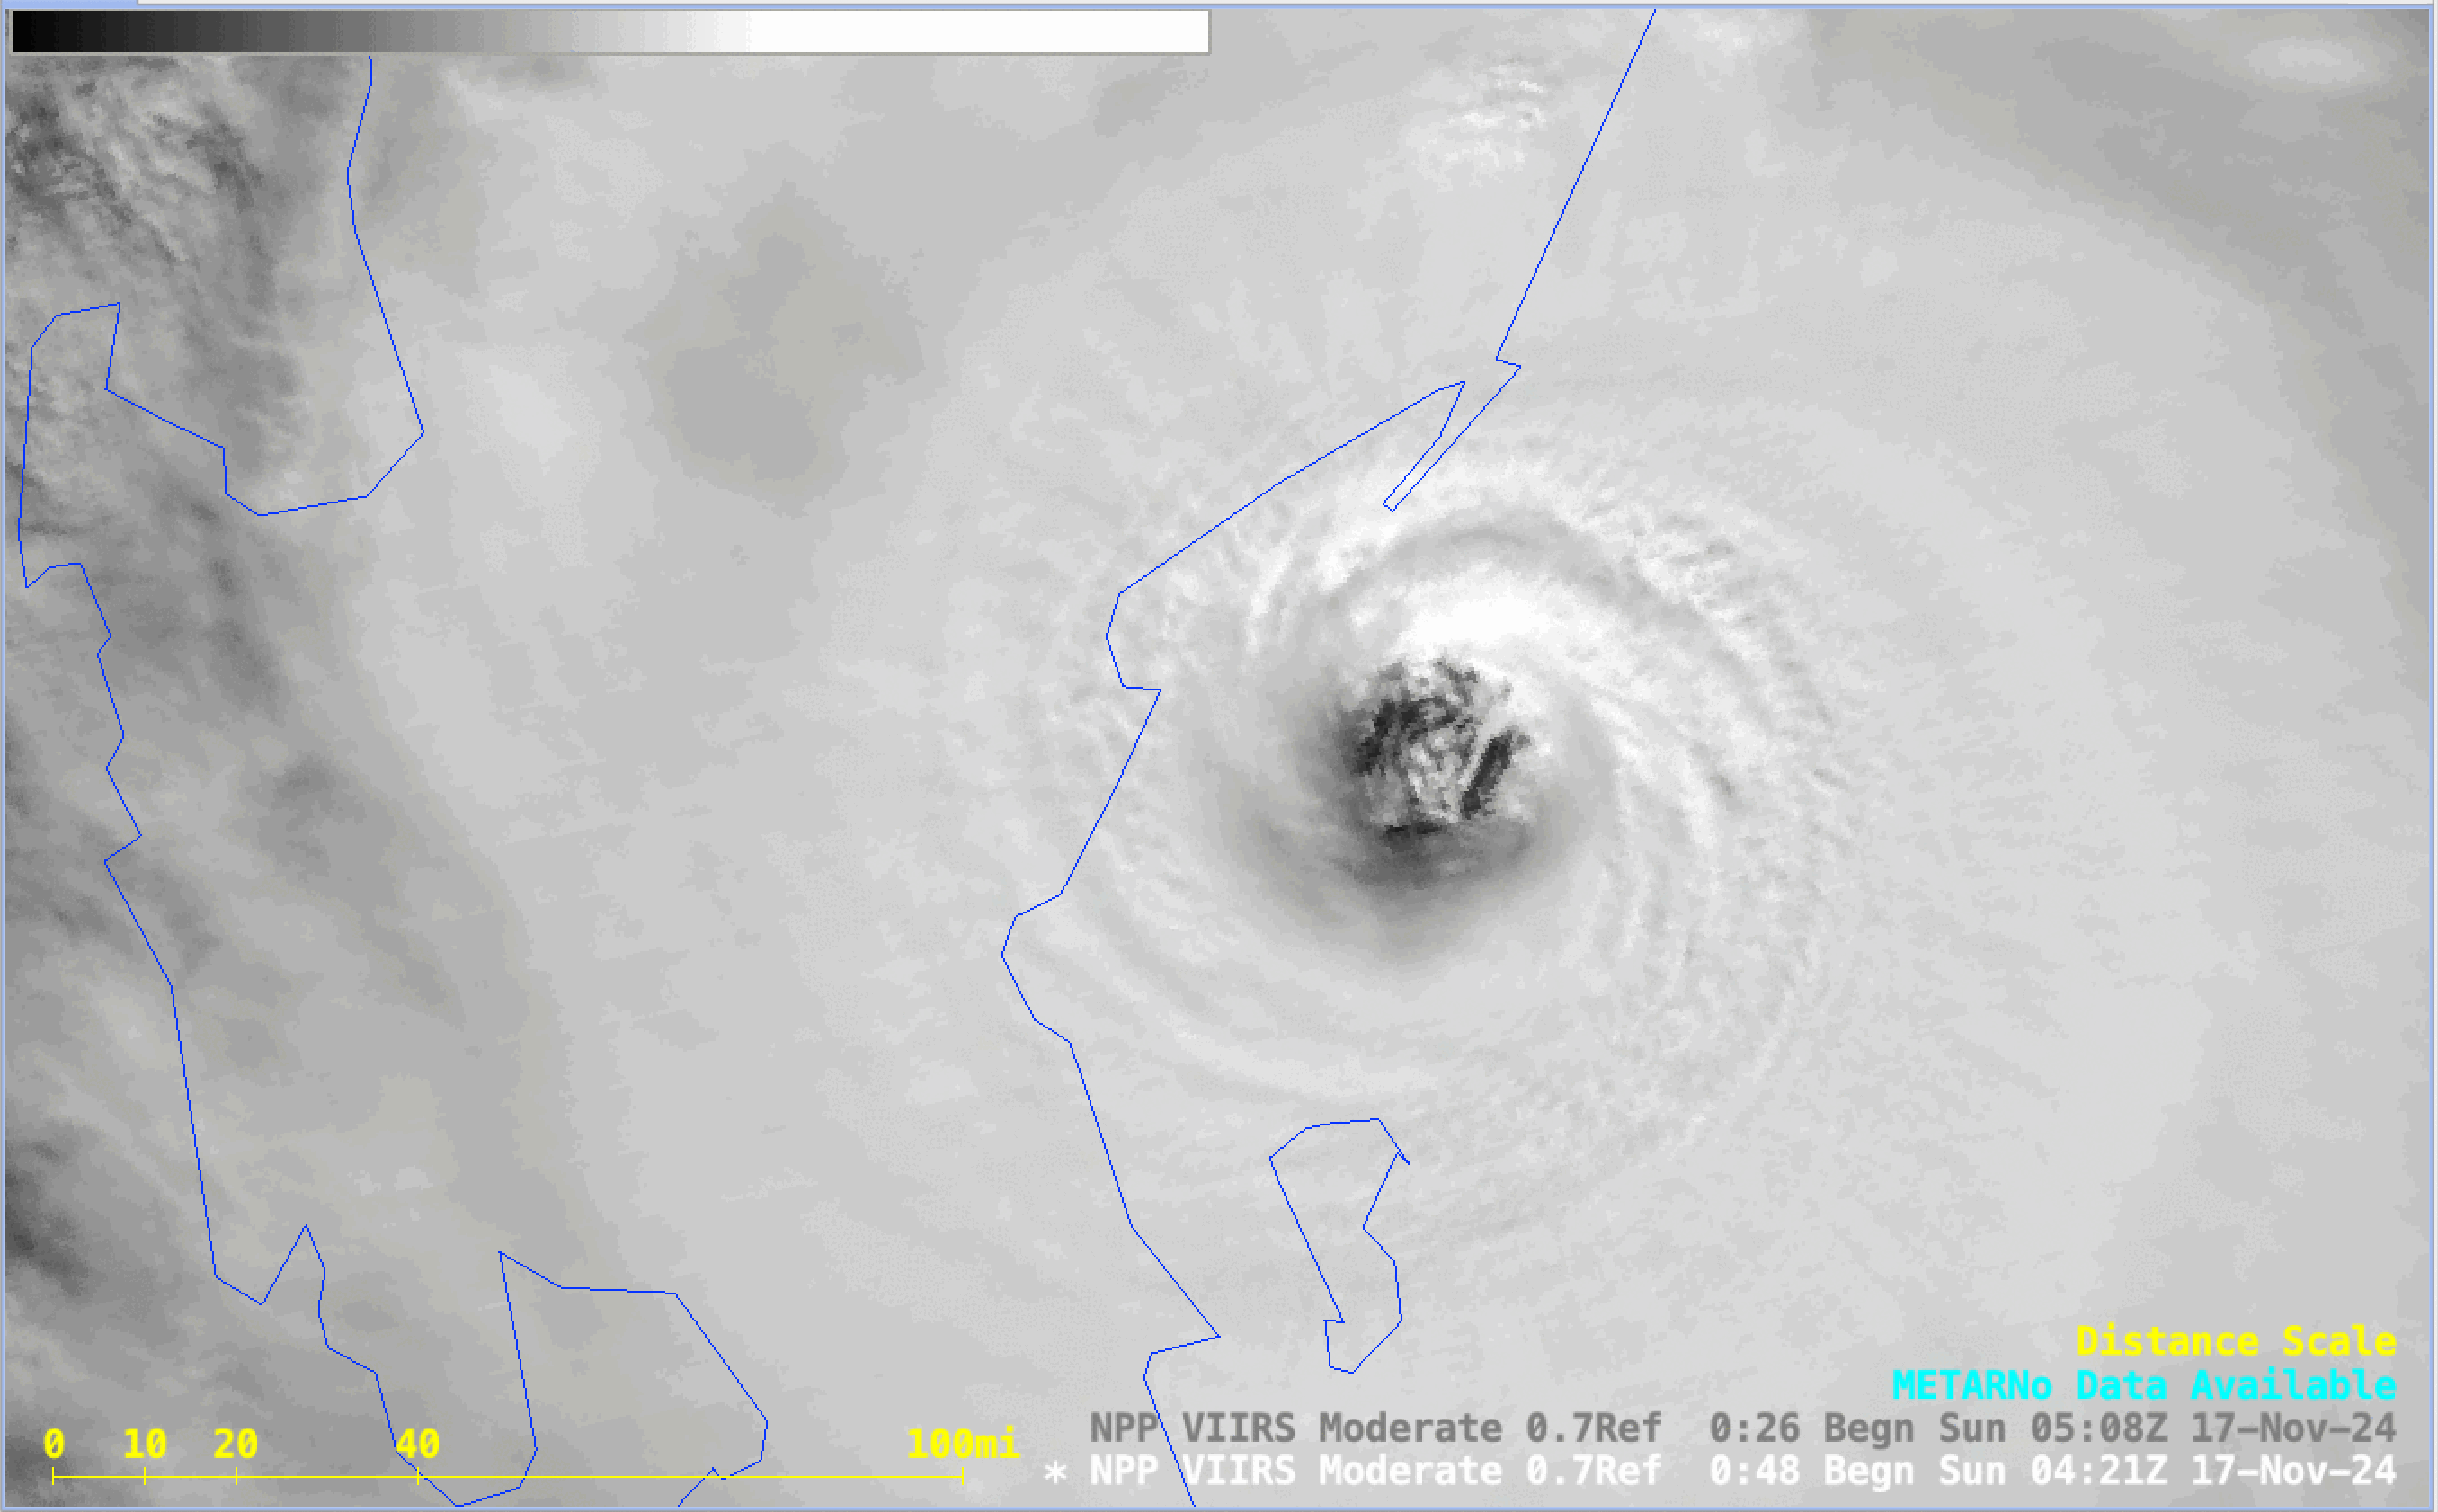
VIIRS Day Night Band visible (0.7 µm) imagery, below, at 0934 and 0958 UTC show the system illuminated with a waning gibbous 3/4 crescent moon. Winds observed at the buoys at this time were in the 30-40 knot range.

What were near-shore buoys showing? The toggle below (using plots from this website) shows observations at Buoy 46132 (South Brooks), 46206 (La Perouse Bank), 46087 (at the mouth of the Strait of Juan de Fuca), 46041 (Cape Elizabeth), 46029 (Columbia River Bar) (This figure shows the locations of most of the buoys, you can also see the locations here). The buoys showed wind gusts in excess of 50 knots, and sustained winds close to 35 knots.
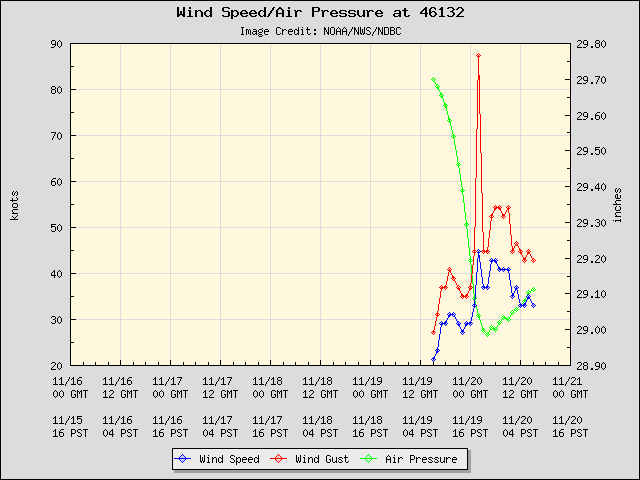
Buoy 46005, at 46oN, 131oW, showed a pressure near 28″ of mercury (near 945 mb) and gusts exceeding 60 knots before failing.


GOES-18 Mid-level Water Vapor (6.9 µm) images with hourly plots of Fixed Buoy reports, from 1606 UTC on 19th November to 0201 UTC on 20th November (courtesy Scott Bachmeier, CIMSS) [click to play MP4 animation]
A closer view of GOES-18 Water Vapor images (above) revealed the distinct circulation associated with this rapidly intensifying low — whose center passed near Buoy 46005 (which recorded a wind gust of 64 knots at 2120 UTC, after which it stopped reporting).
NOAA-21 and NOAA-20 VIIRS Day/Night Band images that included a plot of the final 2100 UTC Buoy 46005 observation (below) showed the center of the low passing just west of the buoy.

NOAA-21 and NOAA-20 (mislabeled as NPP) VIIRS Day/Night Band (0.7 µm) images, with plot of Buoy 46005 data (courtesy Scott Bachmeier, CIMSS) [click to enlarge]
View only this post Read Less


