Severe thunderstorms during the early morning hours of February 29th, 2012 produced several tornadoes over Missouri, including one near Branson, and one near Lebanon. (Annotated SPC storm report map here, originally from here) The GOES-13 enhanced infrared images from 0615 UTC and from 0632 UTC show a cold cloud top (brightness temperatures near 210 K or -63º C) passing just north of Lebanon (indicated by the blue square in the imagery). Similarly, GOES-13 enhanced infrared images from 0702 UTC and 0715 UTC show cold cloud tops (brightness temperatures around 212 K or -61º C) passing just north of Branson (whose position is also indicated by a blue square). (Click Here for a loop from 0545 UTC to 0845 UTC).

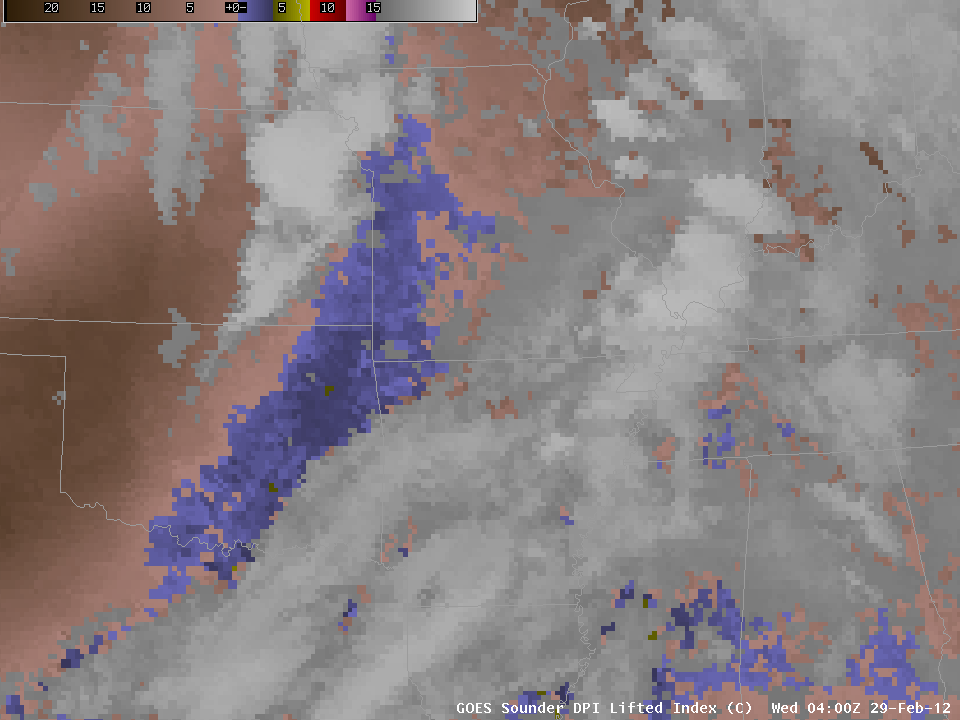
GOES-13 Sounder DPI LI
Satellite data gave numerous indications that severe weather was possible at these locations. For example, the Sounder-derived Derived Product Imagery (DPI) Lifted Index at 0400 UTC and at 0700 UTC (See above for the toggle between the images) shows a tongue of instability — LIs close to -4 at 0400 UTC and dropping by 0700 UTC — progressing eastward across Missouri.
")
UW CIMSS NearCast Product Valid at 0700 UTC 29 February 2012
In addition, the UW CIMSS NearCasting product, above, which product uses a Lagrangian Model to move three-dimensional sounder information into the future (thereby showing where convective instability will develop) suggested that strong instability would help sustain the development of any thunderstorms over Southwestern Missouri. Each of the forecasts in the linked-to loop above focus the instability over southwest Missouri near Branson. The NearCast product indicates where the greatest instability will be in the near future and therefore serves to enhance situational awareness in a region.
___________________________________________________________________________________
As the well-organized squall line ahead of the advancing cold front continued eastward, a tornado which produced the first documented EF4 damage of 2012 moved through the southern part of Harrisburg, Illinois around 10:56 UTC (4:56 am local time). This tornado was also responsible for 6 deaths (NWS Paducah KY Public Information Statement). See the WeatherMatrix Blog for a detailed radar-based discussion of this event.
An AWIPS image of 1-km resolution POES AVHRR 10.8 µm IR data at 11:03 UTC (shortly after the tornado moved through Harrisburg IL) with overlays of severe storm reports (below) shows that the Harrisburg supercell produced hail up to 2.50 inches in diameter and a number of damaging wind reports between 09:41 UTC and 10:56 UTC as it moved northeastward from far eastern Missouri across southern Illinois.

POES AVHRR 10.8 µm IR image + Hail, Severe Wind Gust, and Tornado reports
As seen in the 1-km resolution POES AVHRR image comparison below, along the pre-frontal squall line the 10.8 µm cloud top IR brightness temperatures were as cold as -73º C (darker black color enhancement in the IR image), cloud top heights were as high as 12 km (darker green on the Cloud Top Height product), and a large area of cloud tops was designated as “Overshooting” the tropopause (violet on the Cloud Type product).

POES AVHRR 10.8 µm IR image + Cloud Top Height, and Cloud Type products
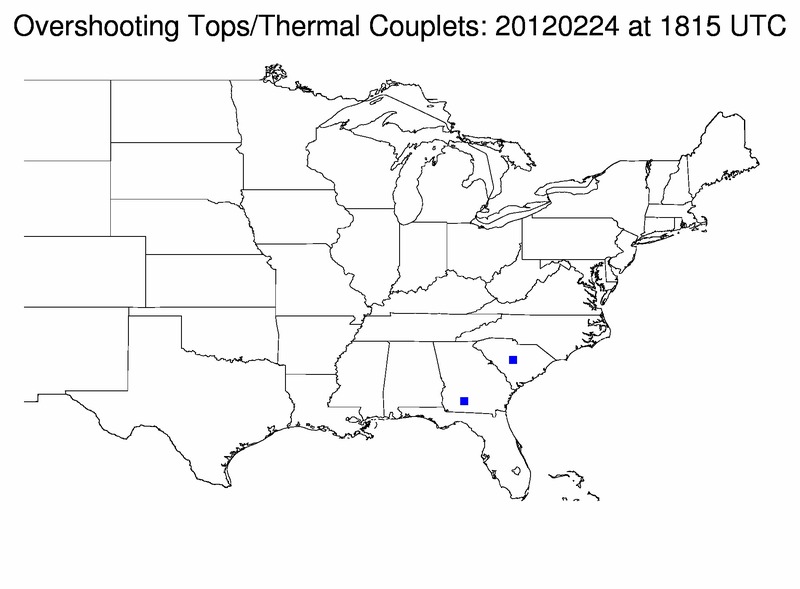
A sequence of 4-km resolution GOES-13 10.7 µm IR images with an overlay of Automated Overshooting Tops Detection (below) showed an overshooting top associated with the supercell at 10.15 UTC over southern Illinois — nearly 45 minutes before the tornado moved through Harrisburg (station identifier KHSB).

GOES-13 10.7 µm IR images + Overshooting Top Detection
View only this post Read Less

 and corrected version (right)")
 and GOES-13 (right) 0.63 µm visible channel images (click image to play animation)")
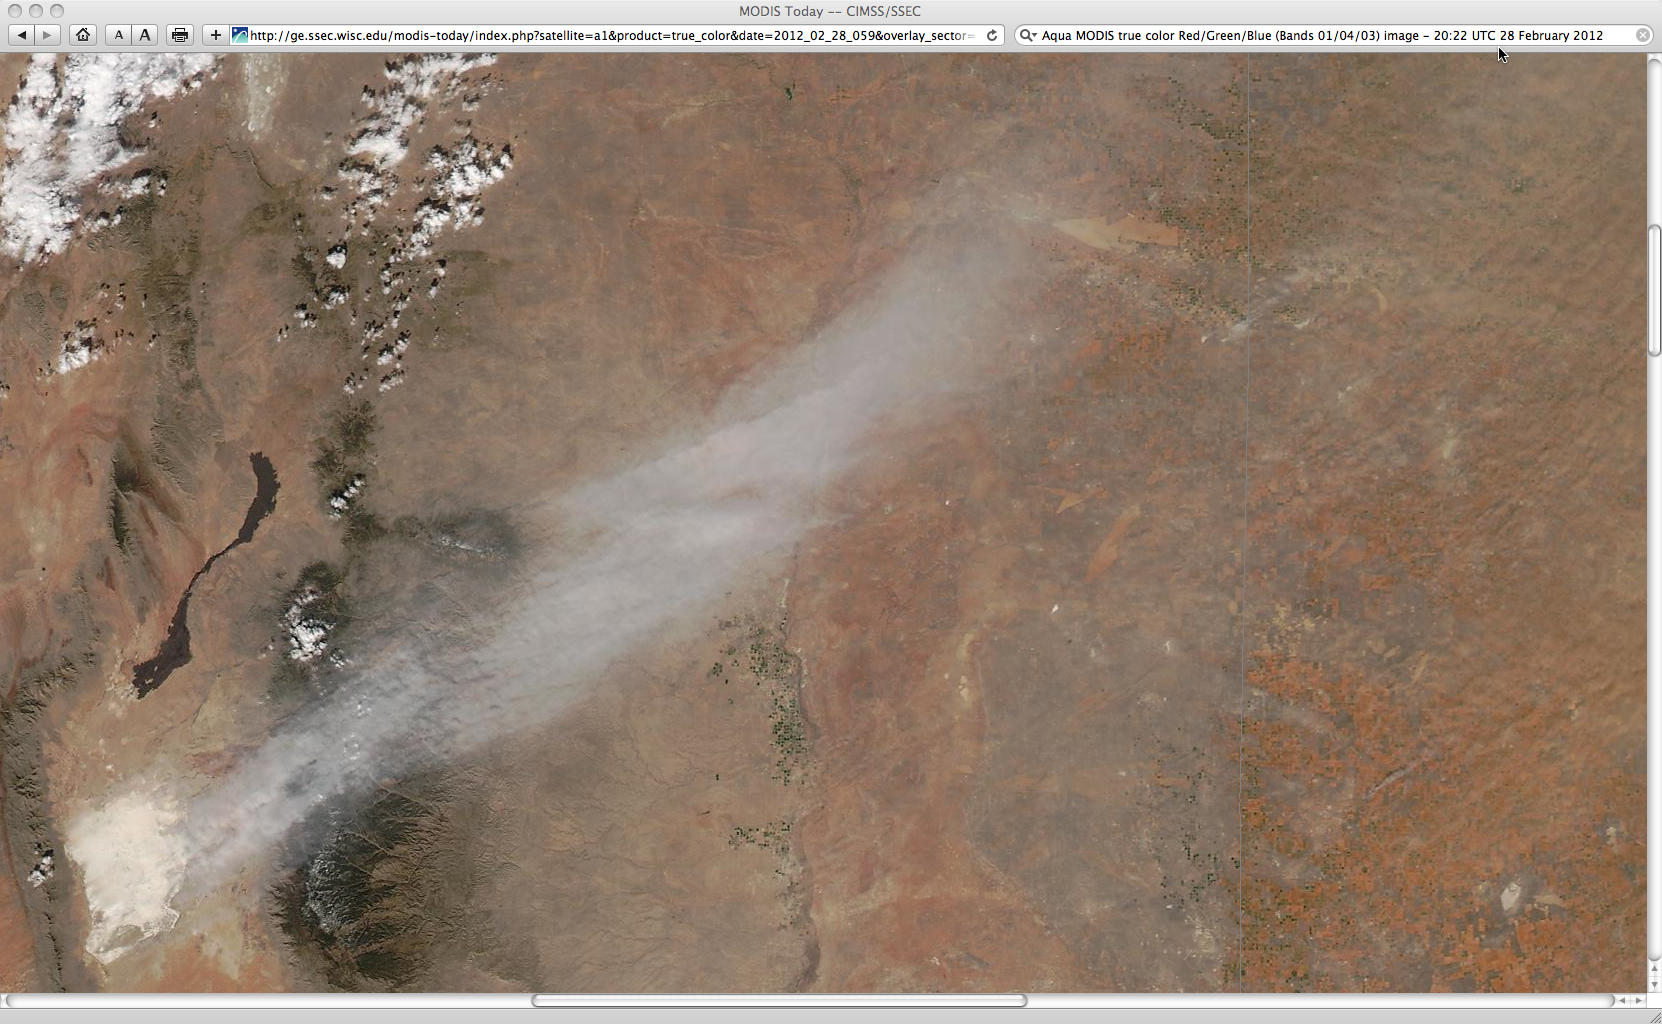
 image (viewed using Google Earth)")


 indicated by white arrow")
