Water clouds, such as those that develop when fog and low stratus form, have different emissivity properties at short IR wavelengths (around 3.9 µm) compared to longer IR wavelengths (around 11 µm). At shorter IR wavelengths, water cloud do not emit as blackbodies, meaning less radiation is emitted than is... Read More
 and Aqua MODIS Brightness Temperature difference (11 µm and 3.7 µm) (click image to play animation)")
Toggle between GOES-East Brightness Temperature difference (10.7µm and 3.9 µm) and Aqua MODIS Brightness Temperature difference (11 µm and 3.7 µm) (click image to play animation)
 and Suomi/NPP VIIRS Brightness Temperature difference (10.8 µm and 3.74 µm) (click image to play animation)")
Toggle between GOES-East Brightness Temperature difference (10.7 µm and 3.9 µm) and Suomi/NPP VIIRS Brightness Temperature difference (10.8 µm and 3.74 µm) (click image to play animation)
Water clouds, such as those that develop when fog and low stratus form, have different emissivity properties at short IR wavelengths (around 3.9 µm) compared to longer IR wavelengths (around 11 µm). At shorter IR wavelengths, water cloud do not emit as blackbodies, meaning less radiation is emitted than is theoretically possible. Emissions at longer IR wavelengths are far closer to the theoretical maximum. The perceived temperature, then (computed based on the assumption that emissions are as blackbodies), based on the detected radiation at shorter IR wavelengths are cooler than the perceived temperature based on radiation detected at longer IR wavelenghts. This brightness temperature difference (BTD) field can be used to highlight regions of low clouds, as shown in the imagery above. Calm conditions over the central Appalachians have allowed fog formation especially in river valleys. The 1-km resolution of MODIS imagery (from Aqua) and VIIRS imagery (from Suomi/NPP) shows far higher detail than is available from GOES imagery.
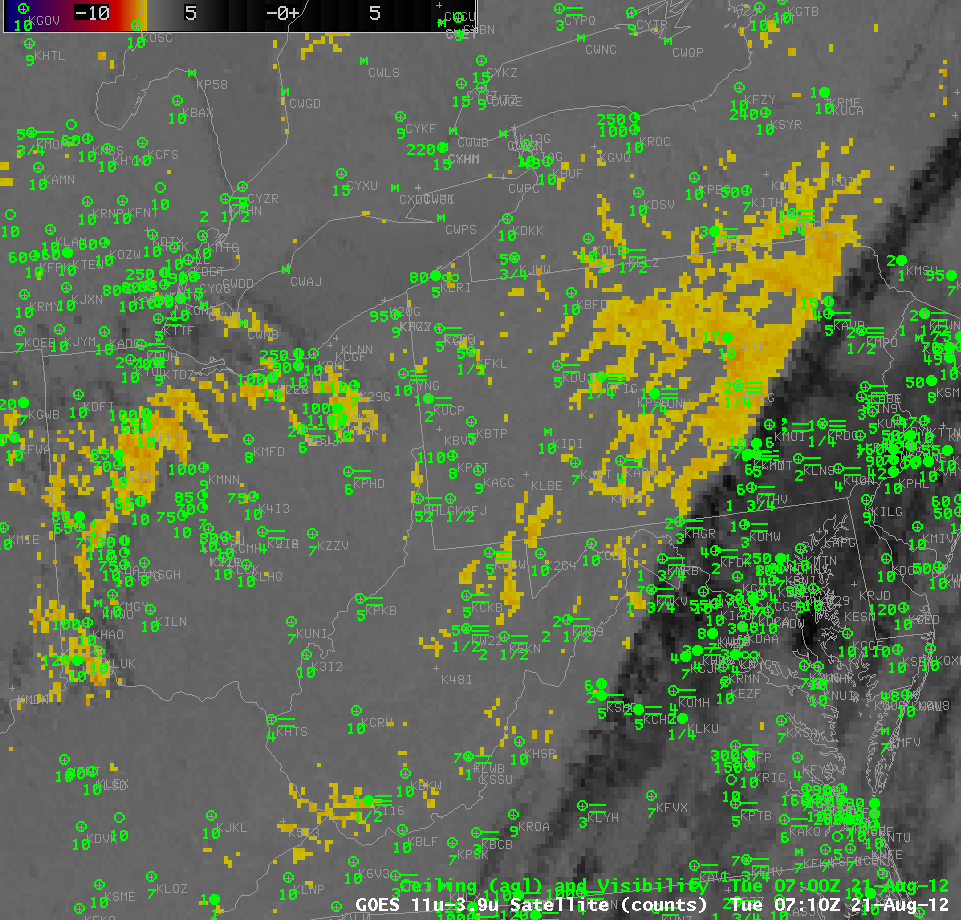
A fog and low stratus detection scheme based solely on BTD fields, however, has shortcomings. For example, in the imagery above, no signal is available underneath the cirrus canopy that stretches from Georgia and South Carolina northeastward into southern New England. In addition, VIIRS, MODIS and GOES show fog/low stratus over western Ohio, but this plot of visibilities shows no serious obstructions to visibility in western Ohio where the BTD signal is strong (and significant visibility obstructions underneath the cirrus canopy in eastern Pennsylvania and Maryland where the BTD is weak). How can this satellite-based signal be improved?

MODIS 3.7 µm vs GOES-15 3.9 µm shortwave IR images
Model data — in this case, from the Rapid Refresh — can be used in a fused product to add information in regions where satellite data cannot be used, and to refine the satellite data elsewhere. IFR Probabilities — an algorithm developed for use with GOES-R ABI data, but applicable to both MODIS and GOES-East data — using MODIS data, above, show very high probabilities over the river valleys of Appalachia where both satellite and model predictors agree that fog or low stratus is likely. Lower, but still significant, probabilities that are based solely on model data, are present underneath the cirrus canopy in southeastern Pennsylvania southwestward to Georgia (because the satellite data cannot be used here, a somewhat lower probability occurs). And, significantly, the stratus deck over western Ohio, which is not associated with IFR conditions, is de-emphasized in the IFR probability field, because the model data shows IFR conditions are unlikely even though the satellite signal — caused by elevated stratus — is strong. Model data adds to and refines the satellite-only BTD field. A plot similar to the MODIS IFR probability, but using GOES Imager data, is here.
Finally, note in the toggle between the VIIRS BTD product and the GOES BTD product, above, that a signal in the GOES Imagery along the eastern shore of Lake Huron is not replicated in the data from Suomi/NPP. The one-pixel co-registration offset between the 3.9 and 10.7 channels, first noted here, persists.
(This blog post is an expanded version of one first posted here.)
View only this post
Read Less
")
")
 and 0.63 µm visible (right) images (click image to play animation)")

 and Aqua MODIS Brightness Temperature difference (11 µm and 3.7 µm) (click image to play animation)")
 and Suomi/NPP VIIRS Brightness Temperature difference (10.8 µm and 3.74 µm) (click image to play animation)")
")
