The GOES-13 (GOES-East) satellite suffered anomalies that forced it to be placed into standby mode late in the day (at 21:22 UTC) on 23 September 2012 (NOAA NESDIS notification message). The GOES-15 (GOES-West) satellite was then placed into Full... Read More
")
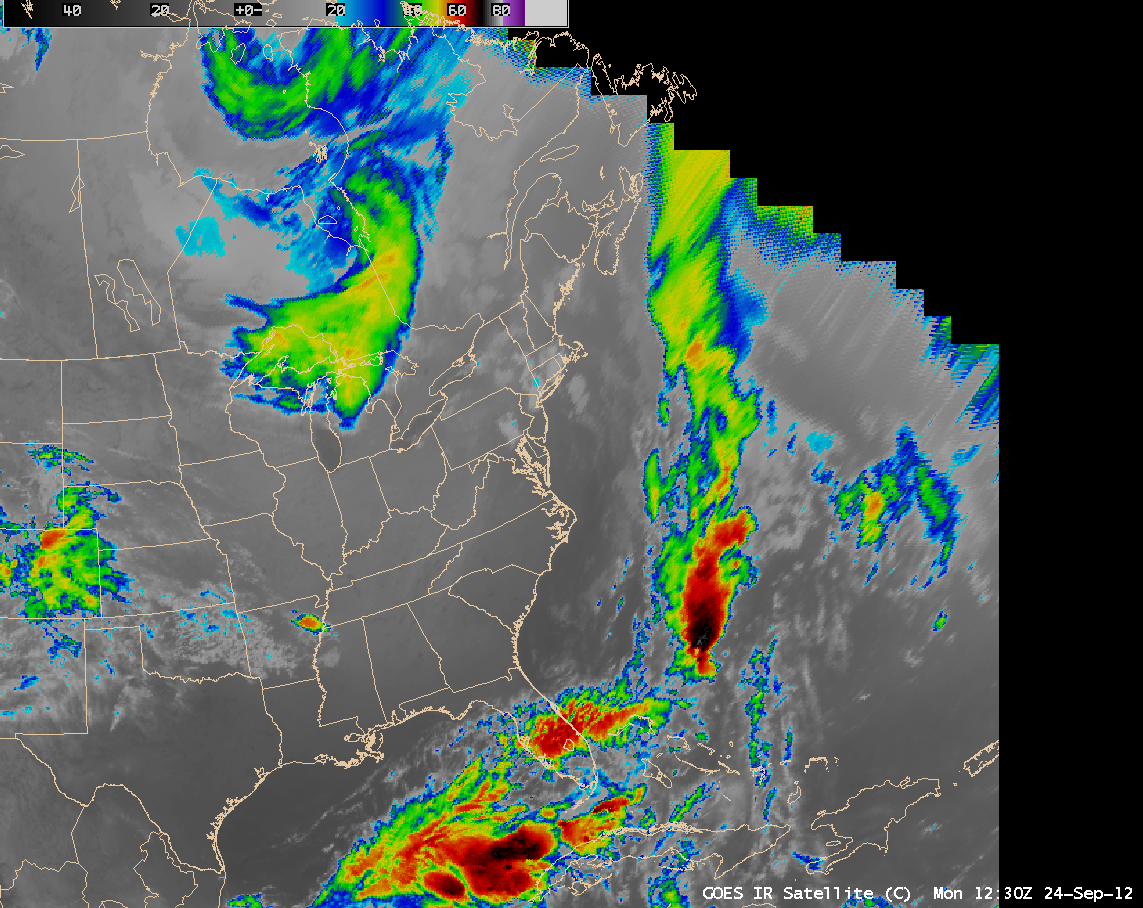
GOES, POES AVHRR, MODIS, and Suomi NPP VIIRS IR images (click to play animation)
The GOES-13 (GOES-East) satellite suffered anomalies that forced it to be placed into standby mode late in the day (at 21:22 UTC) on 23 September 2012 (NOAA NESDIS notification message). The GOES-15 (GOES-West) satellite was then placed into Full Disk scan mode, supplying images to cover as much of the eastern US and adjacent offshore waters as possible at 30-minute intervals.
During the GOES-13 outage, satellite imagery viewed in AWIPS on the “CONUS” scale did not display the complete full disk scan information from GOES-15, resulting in large areas with no data over the southeastern and eastern US (note: the full GOES-15 scan sector is available when viewed on the AWIPS “North America” scale, but the data resolution is degraded due to the very large satellite viewing angle). However, during this period there were a handful of overpasses from a number of polar-orbiting satellites, allowing imagery from the POES AVHRR, MODIS, and Suomi NPP VIIRS instruments to help fill in some of the gaps on the GOES imagery. Examples of these polar-orbiting IR images interjected among the available GOES-15 IR images are shown above. During the 21-hour GOES-East outage period, there were a total of 25 polar-orbiting passes (15 POES AVHRR, 7 MODIS, and 3 Suomi NPP VIIRS) available to offer high spatial resolution data over areas with poor quality GOES-15 data coverage.
CIMSS is able to provide POES AVHRR, MODIS, and Suomi NPP VIIRS imagery in AWIPS format to NWS forecast offices (via Unidata LDM subscription) to serve as an additional source of satellite imagery that could prove to be useful during such geostationary satellite outages.
While the GOES-13 outage persists, real-time GOES-14 imagery can be viewed using the SSEC Geostationary Image Browser.
UPDATE: As of 17:45 UTC on 24 September, GOES-14 replaced GOES-13 as the operational GOES-East satellite (NOAA/NESDIS notification message). After the 18:31 UTC image (below), there was complete coverage of the CONUS from GOES-14 (as viewed using all AWIPS scales).

GOES-14 10.7 µm IR image
In the early morning, before GOES-14 took over as the operational GOES-East satellite, it captured a beautiful sequence of 0.63 µm visible channel images (below; click image to play animation) showing river valley fog across parts of Kentucky, West Virginia, and adjacent states. Also evident early in the animation across the far southern portion of the images is the hazy signature of smoke aloft, transported from the large fires that have been burning in the Pacific Northwest states.
")
GOES-14 0.63 µm visible channel images (click image to play animation)
View only this post
Read Less


")
")


