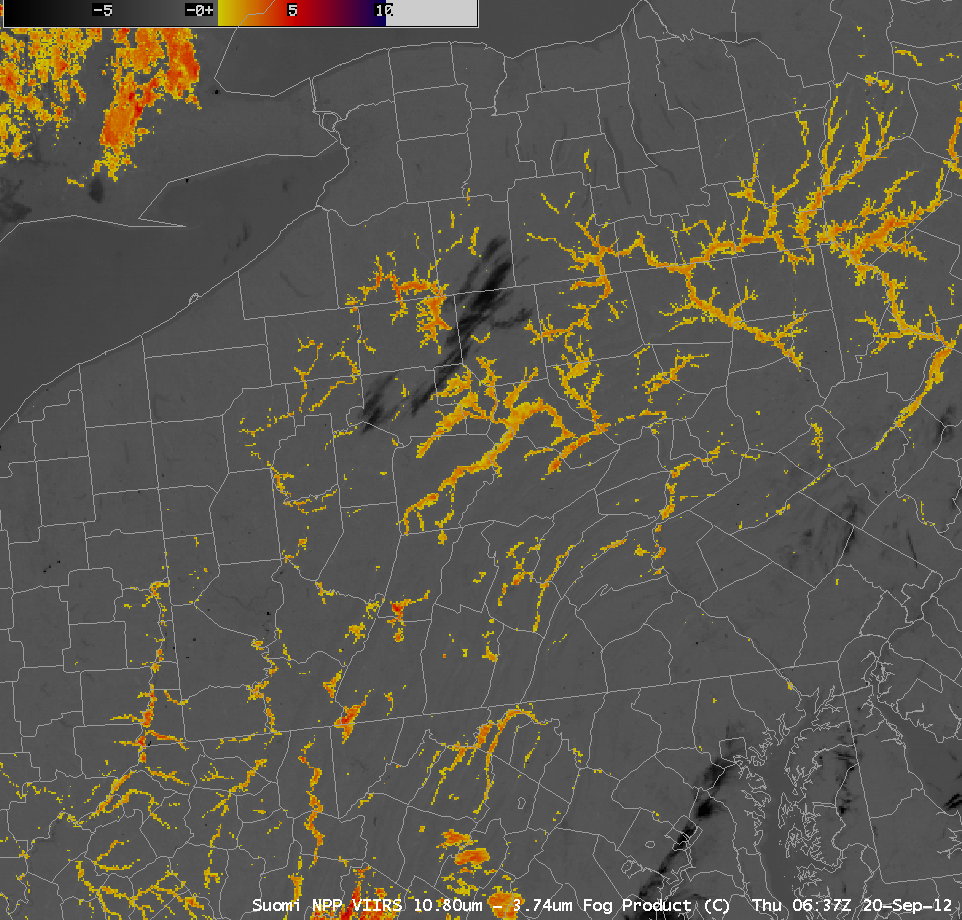
Clear skies and light winds allowed for the formation of fog in river valleys of Pennsylvania and New York in the early morning of 20 September 2012. The animation above shows the traditional method of detecting fog or low stratus from satellite (GOES-East, MODIS on Aqua and VIIRS on Suomi/NPP):... Read More
, MODIS (11 µm and 3.7 µm channels), and VIIRS (11.35 µm and 3.74 µm channels)")
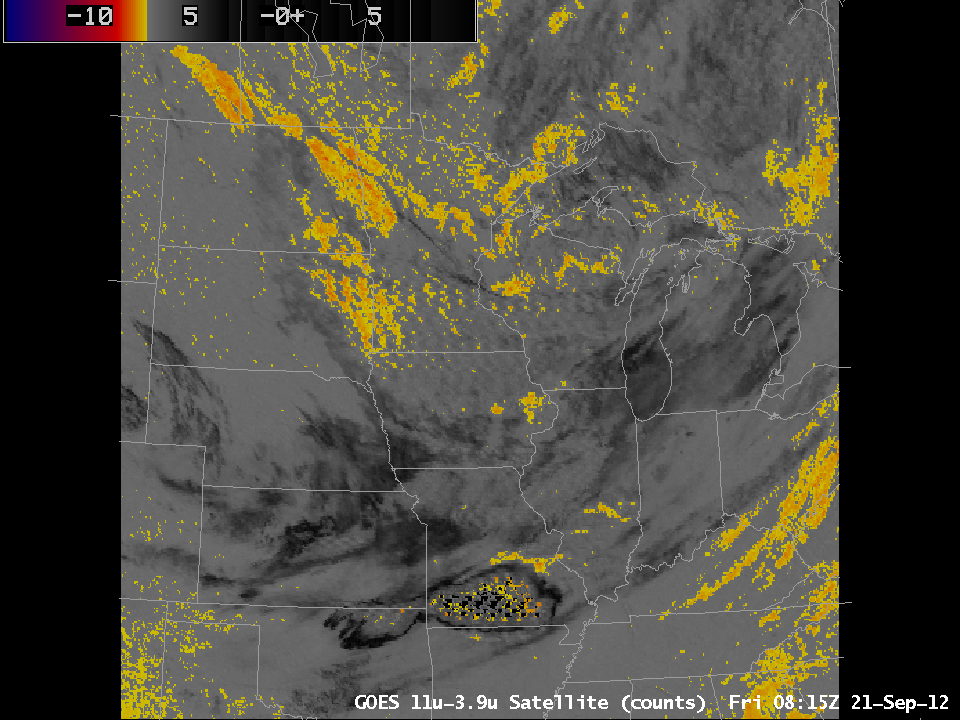
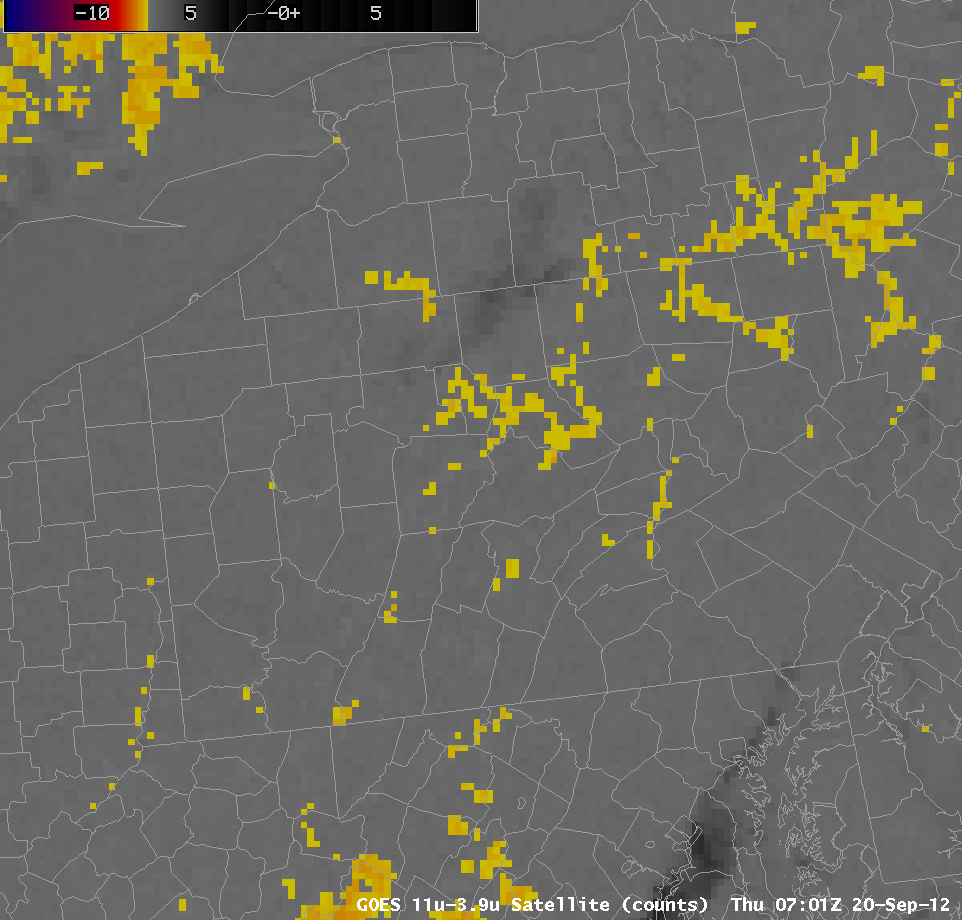
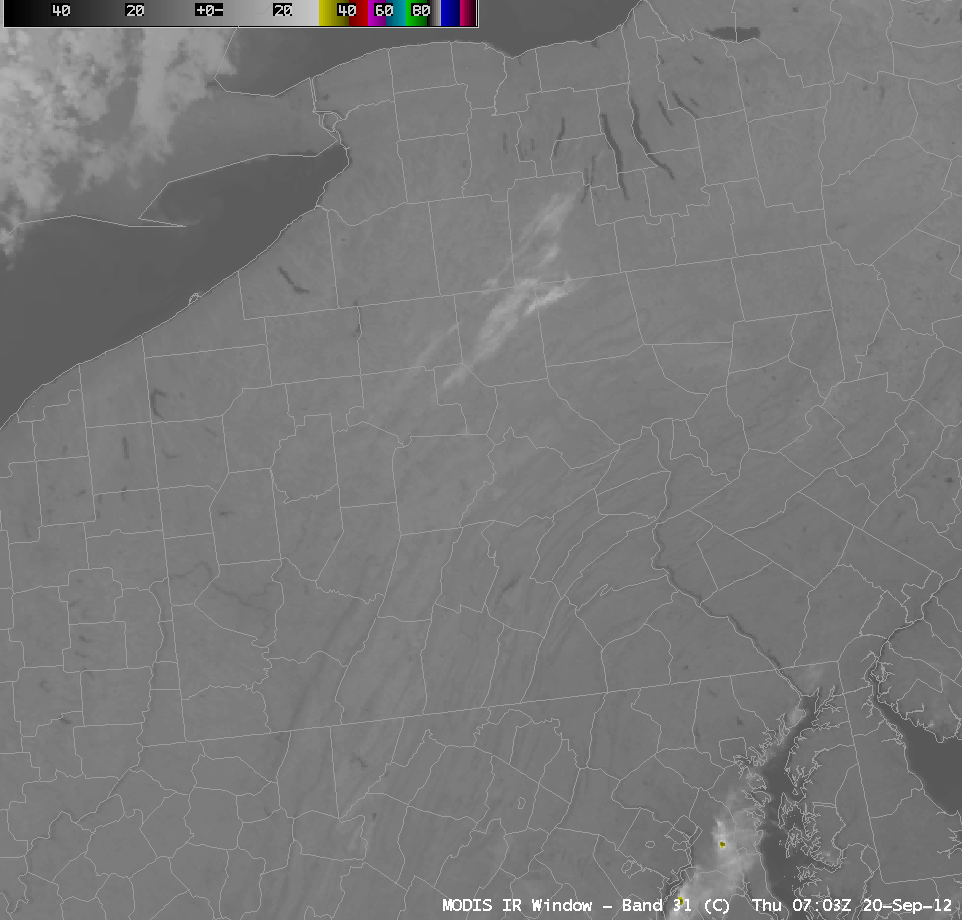
Brightness Temperature Difference between Shortwave and Longwave IR Channels on GOES (10.7 µm and 3.9 µm channels), MODIS (11 µm and 3.7 µm channels), and VIIRS (11.35 µm and 3.74 µm channels)
Clear skies and light winds allowed for the formation of fog in river valleys of Pennsylvania and New York in the early morning of 20 September 2012. The animation above shows the traditional method of detecting fog or low stratus from satellite (GOES-East, MODIS on Aqua and VIIRS on Suomi/NPP): the brightness temperature difference between the shortwave infrared (between 3.7 and 3.9 µm) and longwave infrared (near 11 µm) channels. Liquid clouds do not emit radiation as a blackbody at shortwave IR wavelengths but they do emit radiation more nearly as a blackbody at longwave IR wavelengths. Consequently, inferred blackbody temperatures based on the radiation detected by the satellite (the temperature conversion assumes blackbody emissions) are cooler for shortwave radiation than for longwave radiation, and a difference field will highlight regions of low clouds comprised of water droplets, such as fog or stratus.
The image loop above demonstrates the importance of resolution in correctly describing the dendritic features of fog in river valleys. MODIS and VIIRS infrared channels have resolutions near 1.0 km; GOES has a nominal sub-satellite point resolution of 4 kilometers. Consequently, the GOES brightness temperature difference field cannot accurately detect the sharp edges to the valley fog features.

Day/Night Band image from VIIRS on Suomi/NPP
Fog in valleys can also be detected using the Day/Night band that is on board Suomi/NPP, as shown above. The light source for this image is emitted light from the surface (that is, city lights) and reflected lunar illumination. Lunar illumination is a function of phase, and the moon on 20 September is nearly new. Despite the lack of lunar light, clouds are observed in valleys in New York and Pennsylvania.

MODIS-based GOES-R IFR Probabilities
Fog and low stratus in a river valley is not necessarily an obstruction to aviation. The GOES-R IFR probability product can help determine how likely IFR conditions are. This product is currently produced from MODIS data and from GOES-East and GOES-West data. The product uses both the brightness temperature difference field and Rapid Refresh moisture profiles to assign probabilities of IFR conditions. MODIS IFR Probabilities are highest along the Chemung and Susquehanna Rivers in southern Upstate NY; at 0700 UTC, Elmira NY was reporting visibility of 1/4 mile in Fog. No other stations in the Susquehanna River watershed had visibilities that low. Note that the character of the IFR Probability field is different over Steuben County compared to elsewhere. High clouds that are apparent in the brightness temperature difference field (and in the longwave infrared radiation field) mean that satellite data cannot be used to compute IFR probabilities, so only model fields are used, and the model fields have lower resolution than the MODIS data.
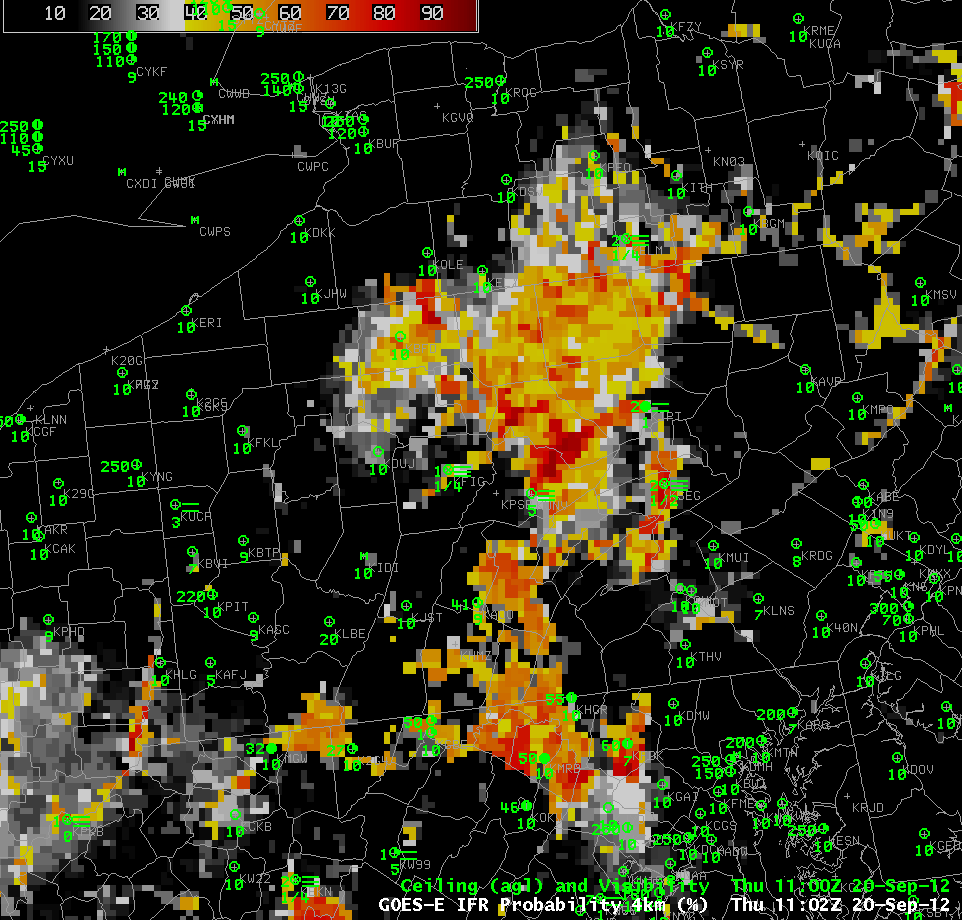
The 0700 UTC GOES-R IFR Probability field computed using GOES-East imager data is shown below. Because of the coarser resolution of the GOES Imager pixel, the small valleys cannot be resolved. Nevertheless, higher probabilities are present near the valleys because sub-pixel scale cloud features do have an impact on the emitted shortwave and longwave radiation. GOES-R IFR Probabilities increased over the course of the night, so that by 1100 UTC, there were signals over most of north-central Pennsylvania and in most river valleys of central Pennsylvania, and airports in those valleys — Williamsport (KIPT), Selinsgrove (KSEG), Clearfield (KFIG), for example — all reported IFR conditions.

GOES Imager-based GOES-R IFR Probabilities
Note that these products are available in WFOs. From the 0958 UTC AFD in State College, PA:
.NEAR TERM /UNTIL 6 PM THIS EVENING/…
EARLY AM MODIS 11-3.7UM IMAGERY SHOWING DENDRITIC PATTERN OF FOG IN THE VALLEYS…THE RESULT OF A COOL…CALM MORNING AND RELATIVELY WARM RIVER/STREAM WATERS. LATEST 3KM HRRR SFC RH FIELDS SUGGEST THE MOST PERSISTENT FOG WILL BE UNDER SFC RIDGE AXIS ACROSS THE SUSQ VALLEY…WHERE PATCHES COULD LINGER UNTIL 14Z-15Z.
View only this post
Read Less
")

")


")
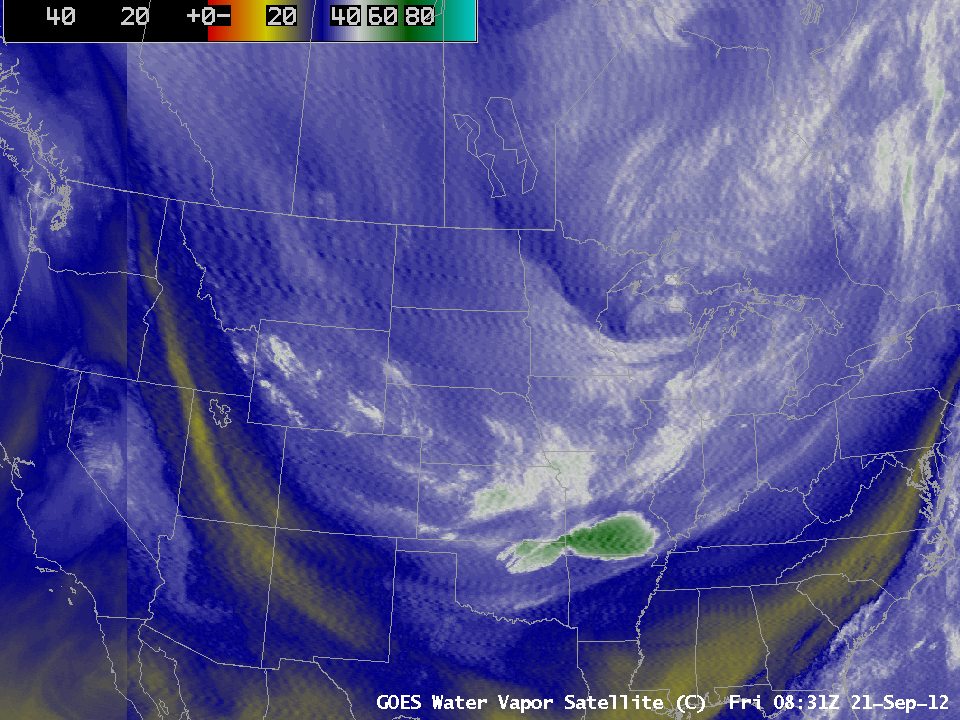
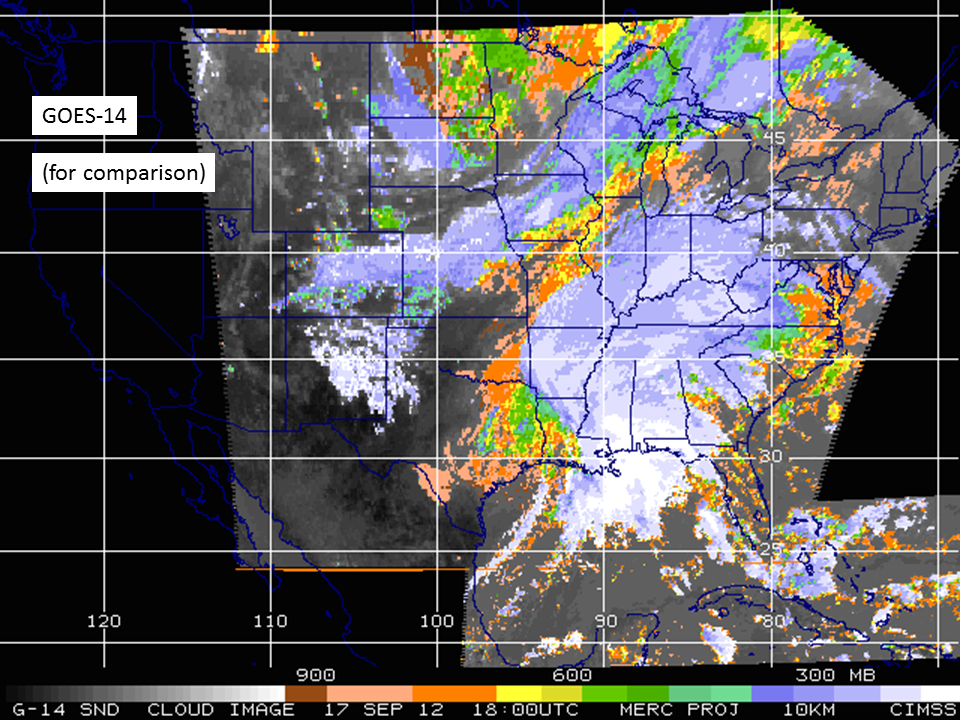
 and Sounder (bottom), 0845 UTC 21 September 2012")

")
