AWIPS images of Suomi NPP VIIRS 0.64 µm visible channel data (above) showed the hazy signature of a dense plume of blowing dust along the southwestern periphery of a large mid-latitude cyclone that was centered over Minnesota and Wisconsin on 18 October 2012.... Read More

Suomi NPP VIIRS 0.64 µm visible channel images
AWIPS images of Suomi NPP VIIRS 0.64 µm visible channel data (above) showed the hazy signature of a dense plume of blowing dust along the southwestern periphery of a large mid-latitude cyclone that was centered over Minnesota and Wisconsin on 18 October 2012. Surface winds gusted as high as 73 mph in Nebraska and 56 mph in Kansas, reducing visibility to near zero in areas of dense blowing dust.
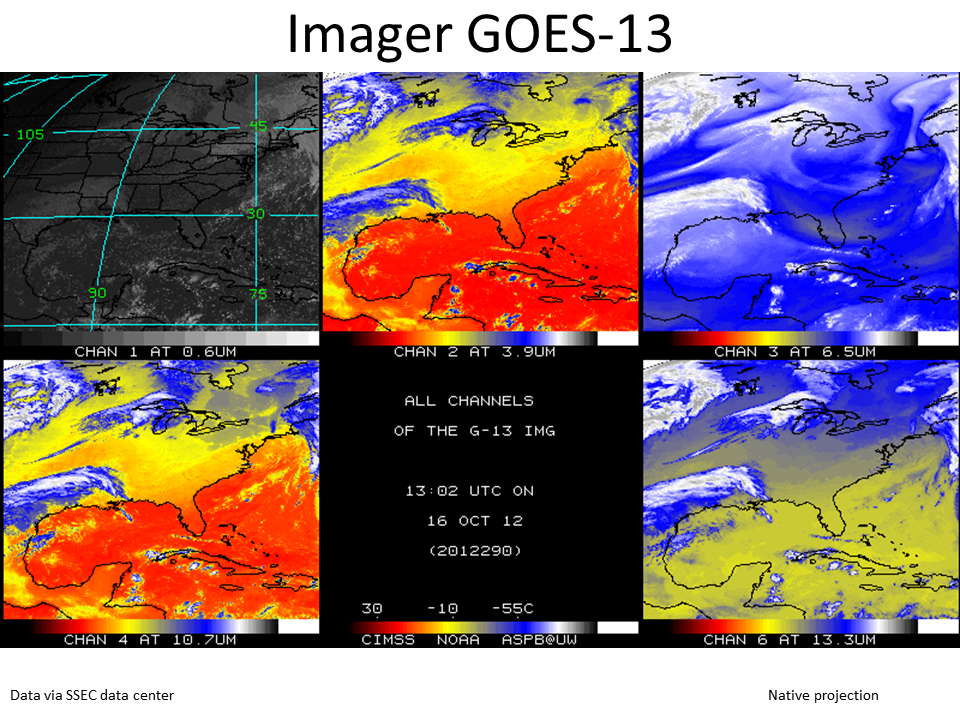
An animation of AWIPS 4-panel images of GOES-13 0.63 µm visible channel, 6.5 µm water vapor channel, 10.7 µm IR channel, and 3.9 µm shortwave IR data (below; click image to play animation) showed (1) the evolution of the dense plume of blowing dust on visible imagery as it developed and moved southeastward across Nebraska, Kansas, and Oklahoma; (2) a well-defined dry region (yellow color enhancement) on water vapor imagery that highlighted strong middle-tropospheric subsidence that initiated the downward transfer of momentum leading to the subsequent strong winds at the surface; and (3) the appearance of wildfire “hot spots” (black to yellow to red color enhancement) on the shortwave IR imagery in northeastern Colorado and southwestern Nebraska.
")
GOES-13 0.63 µm visible, 6.5 µm water vapor, 10.7 µm IR, and 3.9 µm shortwave IR images (click image to play animation)
An Aqua MODIS true-color Red/Green/Blue (RGB) image from the SSEC MODIS Today site (below) showed the tan/light brown signature of the most dense portion of the blowing dust plume. The blowing dust reduced surface visibility to near zero in a number of areas, forcing road closures across parts of Nebraska and Kansas — including a multiple-vehicle accident that closed Interstate 35 near Blackwell, Oklahoma.
")
MODIS true color image (displayed using Google Earth)
 product")
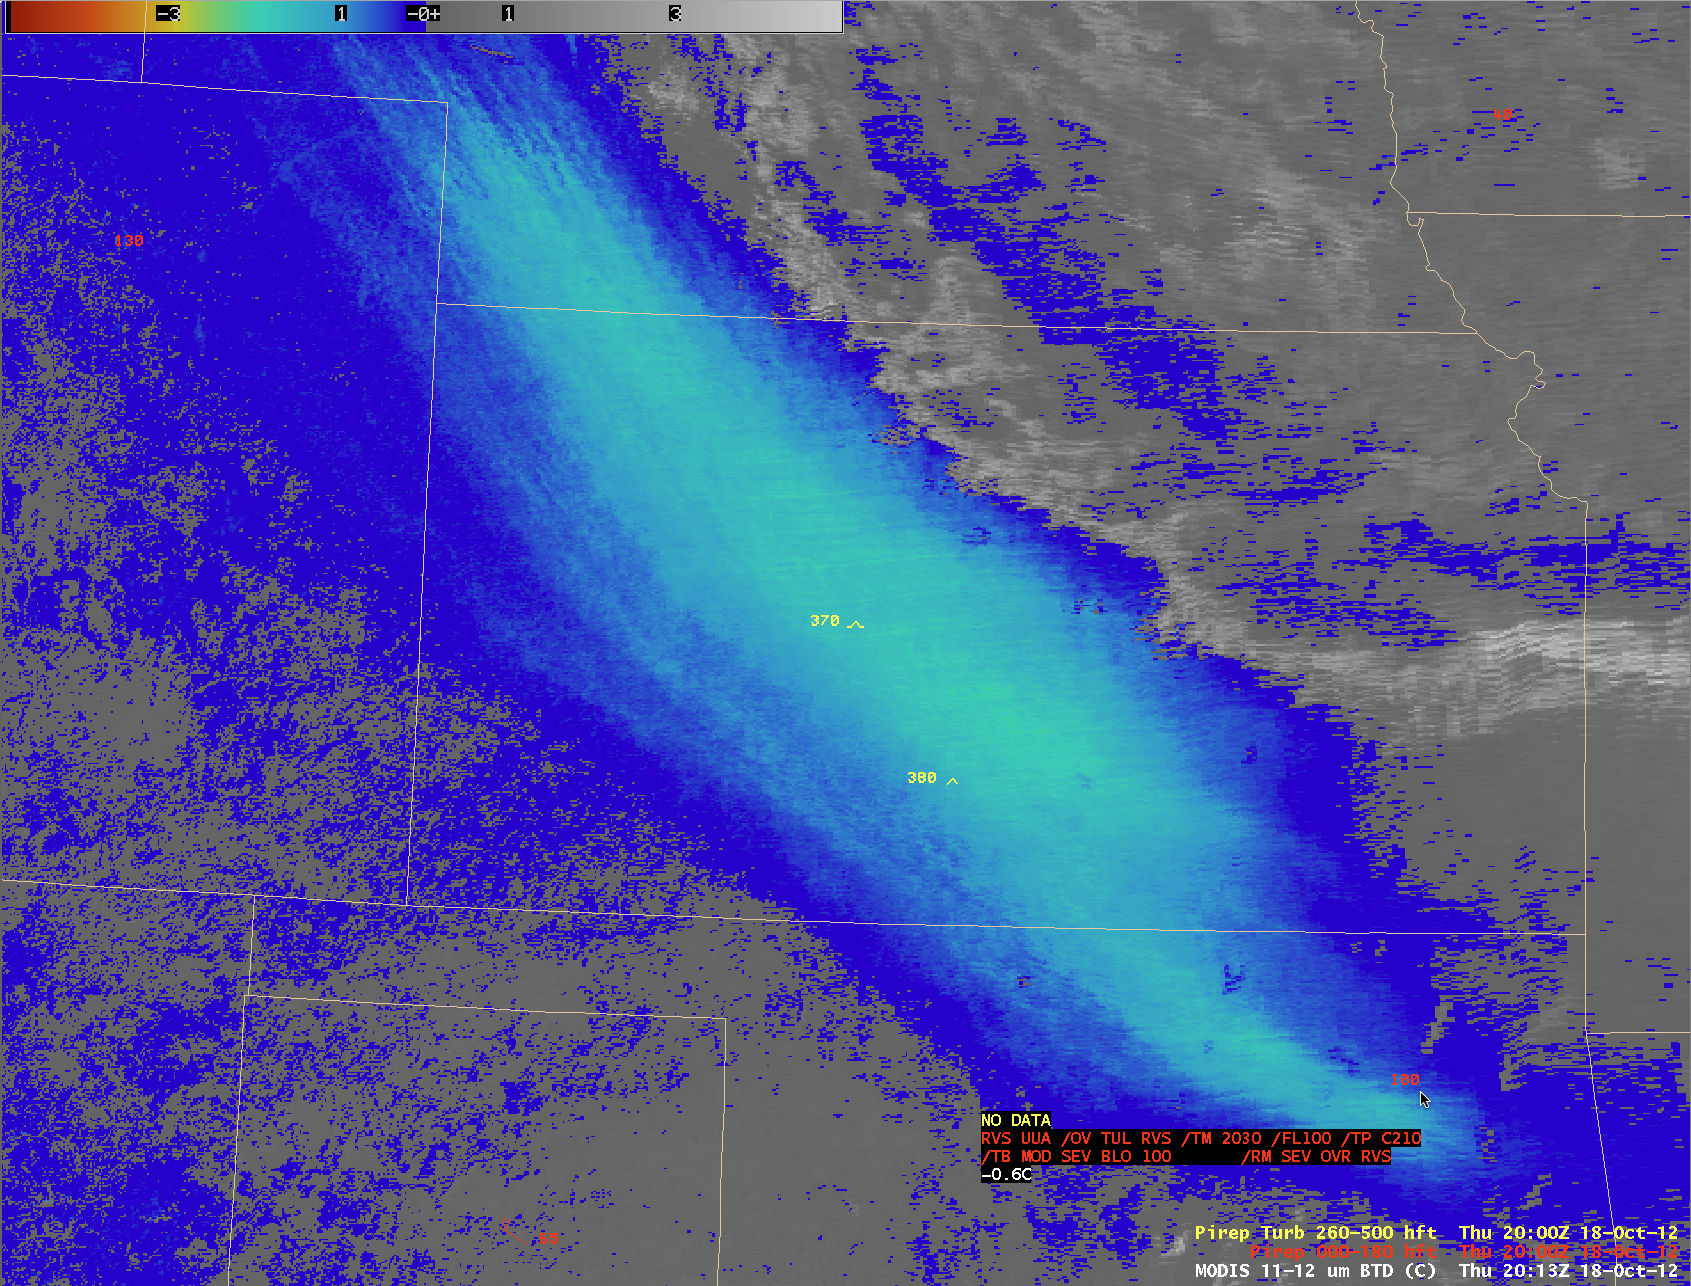
MODIS 0.64 µm visible channel and 11-12 µm IR brightness temperature difference (BTD) product
A comparison of the MODIS 0.64 µm visible channel data with the corresponding 11-12 µm IR brightness temperature difference (BTD) product (above) demonstrated that the BTD product did a better job at depicting the broad areal extent of the airborne dust (lighter blue to cyan color enhancement) at 20:13 UTC (3:13 PM local time). There was one pilot report of moderate to severe turbulence over northeastern Oklahoma near the leading edge of the dust plume.
===== 19 October Update =====
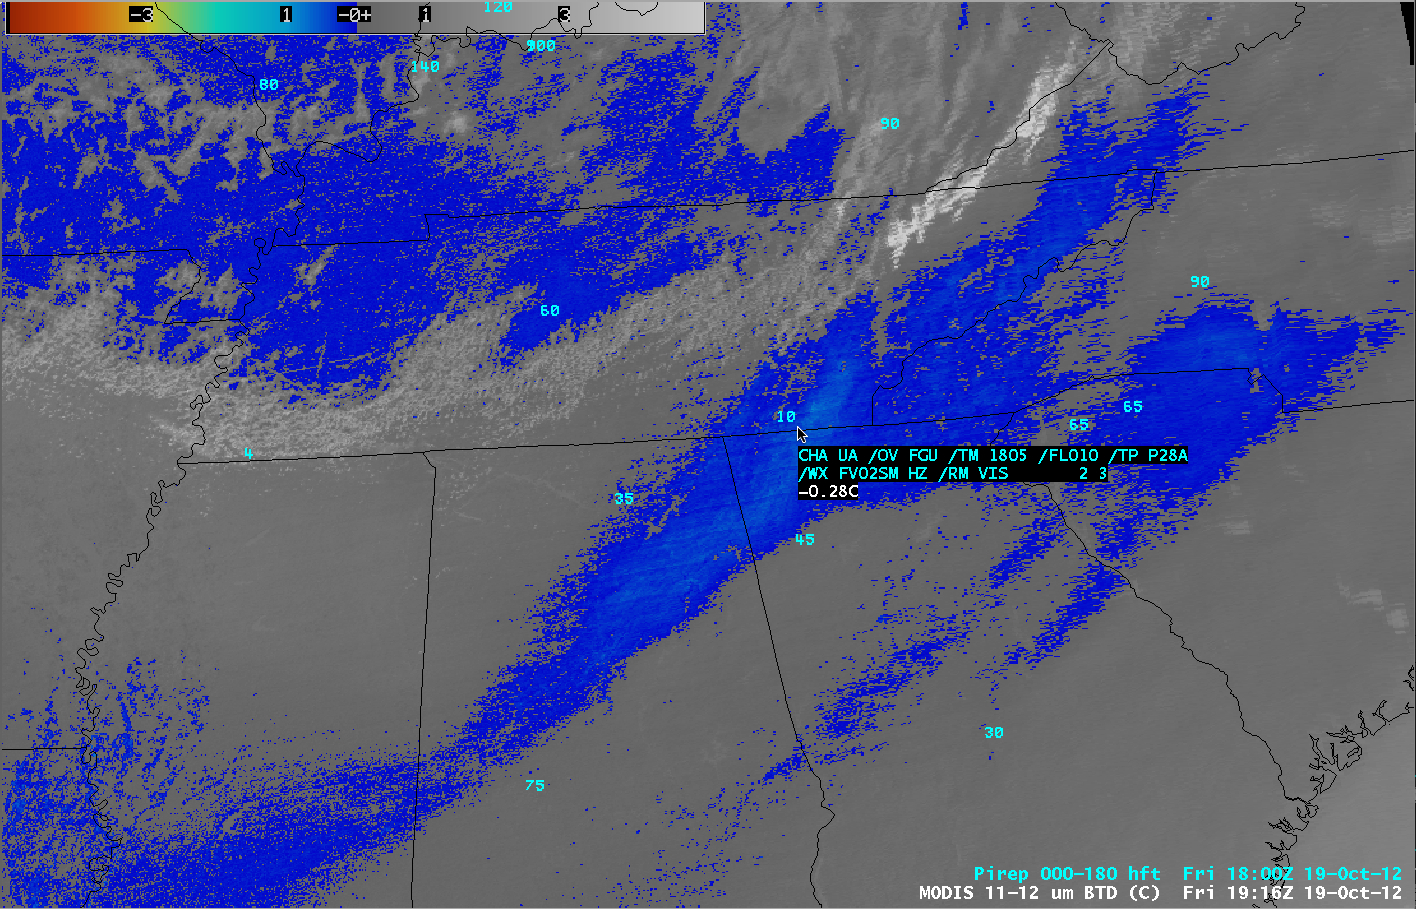
The MODIS BTD product was then able to follow the movement of the dust plume during the subsequent overnight hours, when visible channel imagery was no longer available — the plume became more narrow and less dense as it continued to move southeastward across Arkansas and then over northern Mississippi and Alabama by 08:10 UTC (4:10 AM local time) on 19 October (below).
 product")
MODIS 11-12 µm IR brightness temperature difference (BTD) product
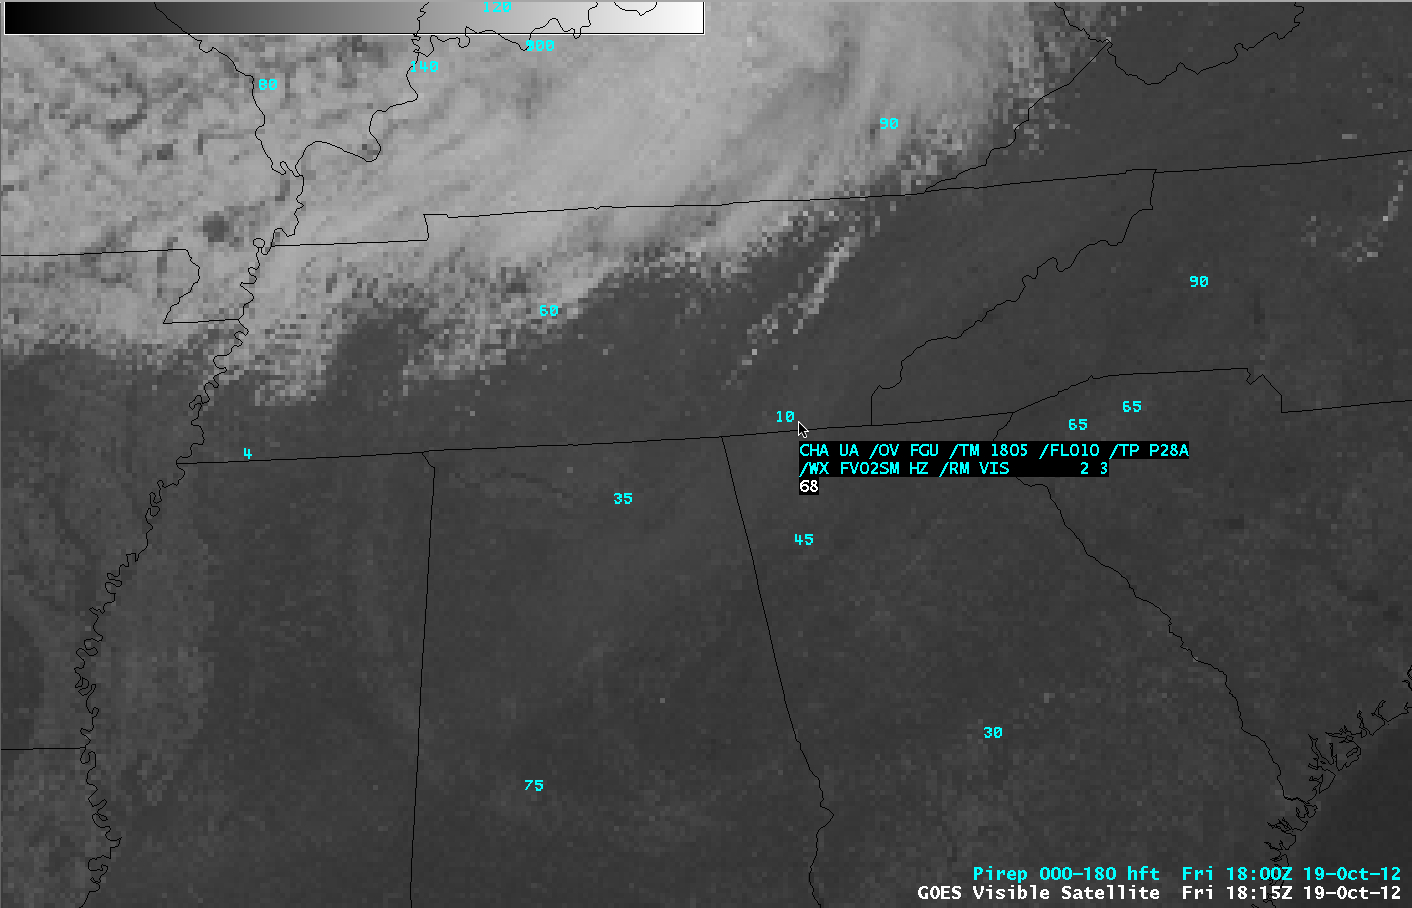
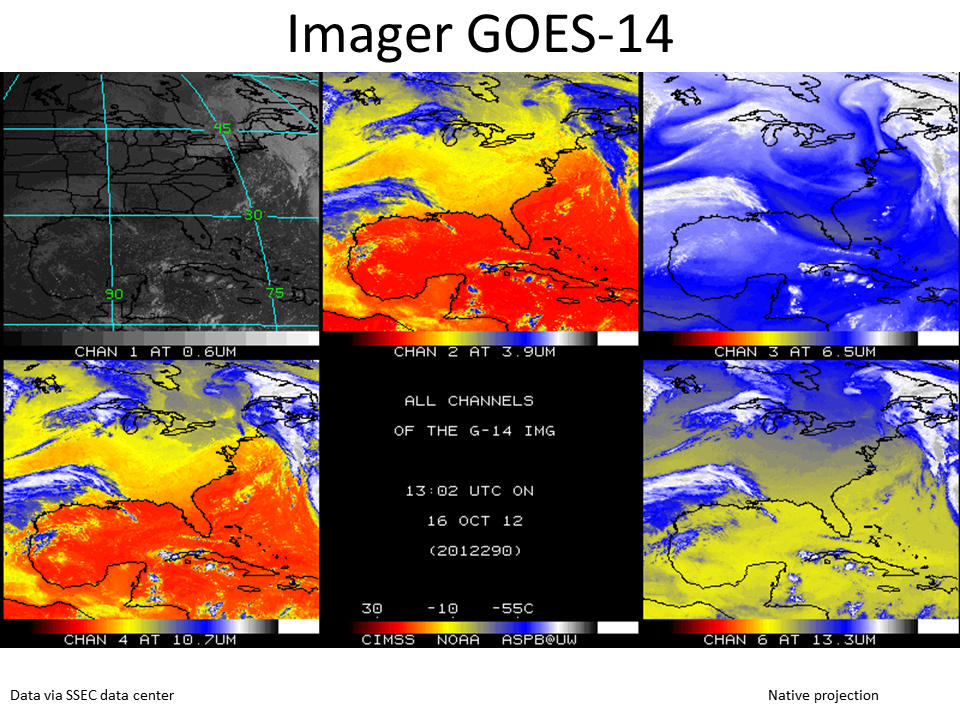
After sunrise on the morning of 19 October, the hazy signature of the airborne dust could be seen on GOES-14 0.63 µm visible channel images over the southeastern US (below). There were pilot reports of flight visibility being restricted to 2 miles at an altitude of 1000 feet over southeastern Tennessee (GOES-13 visible image | MODIS BTD image), and 3 miles at an altitude of 3500 feet over northern Alabama (GOES-13 visible image | MODIS BTD image).

GOES-14 0.63 µm visible channel images
View only this post
Read Less
")
 85 GHz brightness temperature image")

")


")

")

