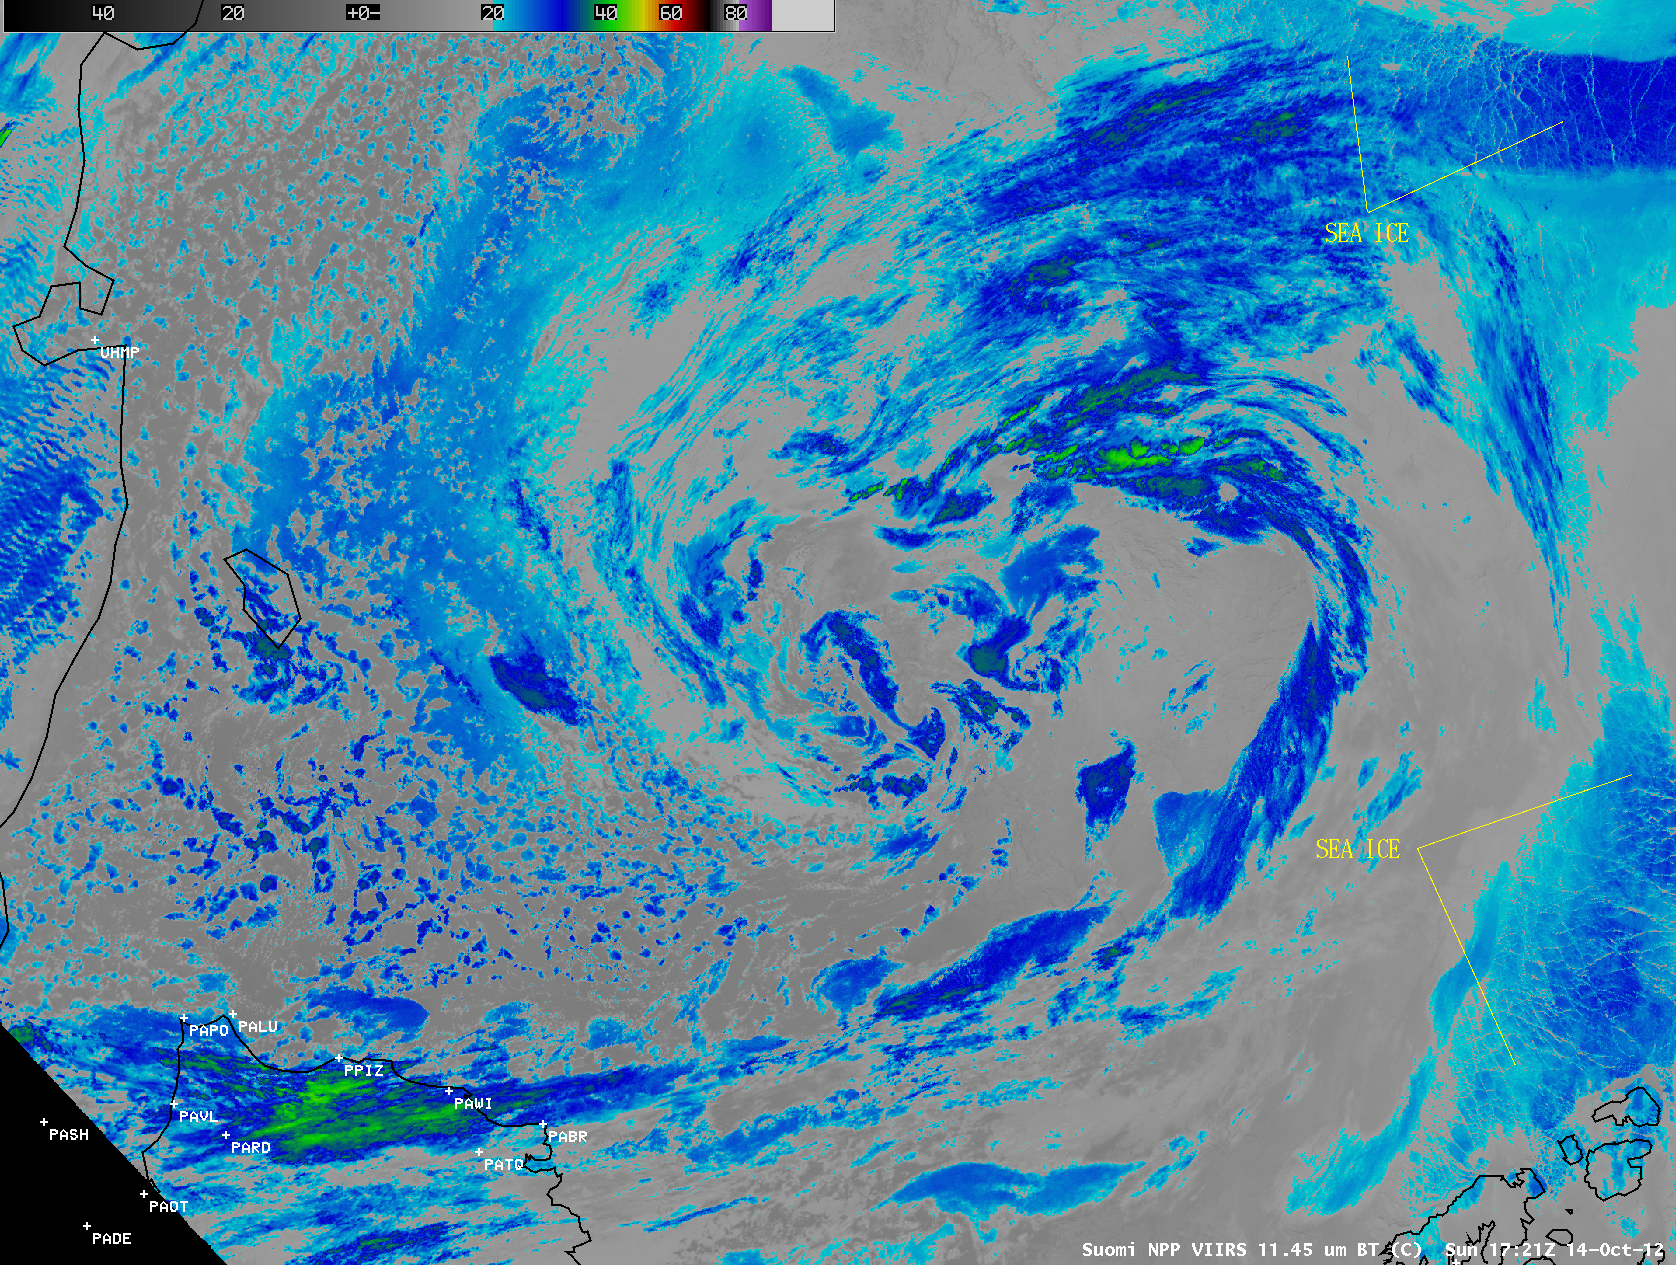
This website works best with a newer web browser such as Chrome, Firefox, Safari or Microsoft Edge. Internet Explorer is not supported by this website.

Upper Midwest Derecho, and a Seiche in southern Lake Michigan

AWIPS images of GOES-13 10.7 µm IR data (above; click image to play animation) showed the progression of two long-lived Mesoscale Convective Systems (or “derechos”) on 11 July 2011 — one moving southeastward from the Dakotas and Minnesota, and another moving northeastward from... Read More

GOES-13 10.7 µm IR images (click image to play animation)

GOES-13 10.7 µm IR images (click image to play animation)

AWIPS images of GOES-13 10.7 µm IR data (above; click image to play animation) showed the progression of two long-lived Mesoscale Convective Systems (or “derechos”) on 11 July 2011 — one moving southeastward from the Dakotas and Minnesota, and another moving northeastward from Nebraska. These two MCS features were responsible for a large number of severe weather reports (SPC: 10 July reports | 11 July reports).

Note the elongated band of cirrus that developed  behind the departing MCS feature, curving across parts of Iowa, Nebraska, Kansas, and Colorado toward the end of the IR image animation above — this striated cloud band marked the location of a well-defined deformation zone. Areas of light to moderate turbulence aloft are often present in association with such deformation zones, as was seen by the number of pilot reports overlaid on a GOES-13 6.5 µm water vapor channel image at 17:45 UTC (below).

GOES-13 6.5 µm water vapor channel image + pilot reports of turbulence

GOES-13 6.5 µm water vapor channel image + pilot reports of turbulence

The GOES-13 sounder Total Precipitable Water (TPW) derived product (below; click image to play animation) showed that abundant moisture (TPW values of 50-60 mm or 2.0 to 2.4 inches, violet color enhancement) was in place ahead of the storms as they moved rapidly eastward.


GOES-13 sounder Total Precipitable Water product (click to play animation)

GOES-13 sounder Total Precipitable Water product (click to play animation)

A closer view of GOES-13 10.7 µm IR images with overlays of the Automated Overshooting Top Detection product (below; click image to play animation) revealed a number of overshooting tops, with the minimum cloud top IR brightness temperature of -81ºC occurring over eastern Iowa at 09:45 UTC. The overshooting tops were very evident after sunrise on GOES 0.63 µm visible channel imagery, as they cast shadows upon the thunderstorm anvil tops below (11:45 UTC visible image + overshooting top detection product comparison).

GOES-13 10.7 µm IR images + Overshooting Top Detection (click to play animation)

GOES-13 10.7 µm IR images + Overshooting Top Detection (click to play animation)

A set of three comparisons of 1-km resolution POES AVHRR 10.8 µm IR images with their corresponding 4-km resolution GOES-13 10.7 µm IR images (below) demonstrated the value of improved spatial resolution for more accurate detection of the location and magnitude of the coldest cloud tops on severe thunderstorms. On the 08:22 UTC, 08:47 UTC, and 11:37 UTC POES AVHRR images, the coldest cloud top IR brightness temperatures were -84ºC, -90ºC, and -85ºC, respectively (the coldest GOES-13 IR brightness temperatures were -78ºC for all three of those times). Note that the apparent northwestward displacement of cloud features on the GOES-13 images is a result of parallax error due to the large viewing angle from the geostationary satellite.

1-km resolution POES AVHRR 10.8 µm IR and 4-km resolution GOES-13 10.7 µm IR images

1-km resolution POES AVHRR 10.8 µm IR and 4-km resolution GOES-13 10.7 µm IR images

1-km resolution POES AVHRR 10.8 µm IR and 4-km resolution GOES-13 10.7 µm IR images

1-km resolution POES AVHRR 10.8 µm IR and 4-km resolution GOES-13 10.7 µm IR images

1-km resolution POES AVHRR 10.8 µm IR and 4-km resolution GOES-13 10.7 µm IR images

1-km resolution POES AVHRR 10.8 µm IR and 4-km resolution GOES-13 10.7 µm IR images

Very strong surface winds were observed along and in the wake of the well-defined bow echo seen on radar — peak wind gusts included 74 mph at Dubuque, Iowa, 75 mph at Chicago Midway Airport, and 85 mph at Michigan City, Indiana. These strong winds created a seiche across southern Lake Michigan (Seiche Warning | NWS Chicago event summary), with oscillations in water levels seen at Calumet Harbor, Illinois, Milwaukee, Wisconsin, and Holland, Michigan.

View only this post Read Less

5 years of MODIS images and products in AWIPS

07 July 2011 marks the 5 year anniversary of CIMSS providing MODIS images and products for National Weather Service (NWS) forecast offices to add to their local AWIPS workstations (via LDM subscription). This important “Research to Operations” effort has been a cornerstone of the GOES-R Proving Ground project. As of July 2011, CIMSS has provided experimental MODIS... Read More

07 July 2011 marks the 5 year anniversary of CIMSS providing MODIS images and products for National Weather Service (NWS) forecast offices to add to their local AWIPS workstations (via LDM subscription). This important “Research to Operations” effort has been a cornerstone of the GOES-R Proving Ground project. As of July 2011, CIMSS has provided experimental MODIS imagery in real-time to 70 NWS sites across the US. Shown below are a few examples of the types of MODIS images and products that are being distributed.

MODIS 0.65 µm isible channel and 2.1 µm near-IR "snow/ice" channel images

MODIS 0.65 µm isible channel and 2.1 µm near-IR "snow/ice" channel images

A comparison of MODIS 0.65 µm visible channel and 2.1 µm near-IR “snow/ice channel” images (above) shows the values of the snow/ice channel imagery for locating areas of flooding across the upper Missouri River basin (water is a strong absorber at the 2.1 µm wavelength, so it shows up very dark on the images).

MODIS 3.7 µm and GOES-13 3.9 µm shortwave IR images

MODIS 3.7 µm and GOES-13 3.9 µm shortwave IR images

A comparison of 1-km resolution MODIS 3.7 µm and 4-km resolution GOES-13 shortwave IR images (above) demonstrates the value of improved spatial resolution for the detection of “hot spots (red to yellow color enhancement) associated with active fires that were still burning along the periphery of the Honey Prairie Fire in southeastern Georgia.

MODIS and GOES  fog/stratus product images

MODIS and GOES fog/stratus product images

A comparison of 1-km resolution MODIS and 4-km resolution GOES-11 fog/stratus product images (above) again shows the value of higher spatial resolution for identifying the edges of fog features along the California coast. Also note the appearance of ship tracks in the offshore stratus deck on the MODIS image.

MODIS 11.0 µm and GOES-13 10.7 µm IR images

MODIS 11.0 µm and GOES-13 10.7 µm IR images

A comparison of 1-km resolution MODIS 11.0 µm IR and 4-km resolution GOES-13 10.7 µm IR images (above) shows the improved depiction of transverse banding cirrus features (which are a signature of potential turbulence). There were a few pilot reports of light to moderate turbulence across that particular region of transverse banding.

MODIS 6.7 µm and GOES-13 6.5 µm water vapor channel images

MODIS 6.7 µm and GOES-13 6.5 µm water vapor channel images

A comparison of the 1-km resolution MODIS 6.7 µm and the 4-km resolution GOES-13 6.5 µm “water vapor channel” images (above) shows a much better depiction of the compact middle-tropospheric vorticity feature over Quebec, Canada.

MODIS 0.65 µm visible channel image + MODIS Sea Surface Temperature product

MODIS 0.65 µm visible channel image + MODIS Sea Surface Temperature product

On the previous day (06 July 2011), generally cloud-free conditions over the western Great Lakes allowed a nice view of the Sea Surface Temperature (SST) across that region — note that SST values were still as cold as 40.3º F over parts of Lake Superior (above). The corresponding MODIS 0.65 µm visible image showed a few well-defined lake breeze boundaries, as well as a thin northwest-to-southeast oriented plume of smoke from wildfires burning in Canada.

MODIS Total Precipitable Water, Lifted Index, K Index, and Total Totals products

MODIS Total Precipitable Water, Lifted Index, K Index, and Total Totals products

4-km resolution MODIS products that might be useful for assessing the pre-convective environment include the Total Precipitable Water, Lifted Index, K Index, and Total Totals products (above).

MODIS Cloud Phase and Cloud Top Temperature products

MODIS Cloud Phase and Cloud Top Temperature products

Other 4-km resolution products include the Cloud Phase and Cloud Top Temperature products (above).

View only this post Read Less

Phoenix dust storm, and a resulting Mesoscale Convective Vortex over southern California

 Strong thunderstorm outflow winds (gusting as high as 69 mph) created a severe dust storm (or “haboob“) in the Phoenix, Arizona area around 02:00 to 03:00 UTC on 06 July 2011 (or 7pm to 8pm local time on 05 July 2011), restricting the... Read More

GOES-11 0.65 µm visible and 10.7 µm IR images (click image to play animation)

GOES-11 0.65 µm visible and 10.7 µm IR images (click image to play animation)


Strong thunderstorm outflow winds (gusting as high as 69 mph) created a severe dust storm (or “haboob“) in the Phoenix, Arizona area around 02:00 to 03:00 UTC on 06 July 2011 (or 7pm to 8pm local time on 05 July 2011), restricting the surface visibility to near zero with blowing dust and forcing a 45-minute Ground Stop at Phoenix Sky Harbor Airport (an interesting YouTube video of the approaching dust storm is available here). The Phoenix National Weather Service forecast office published a summary of the event, and additional information and 3D radar animations are available on the AccuWeather WeatherMatrix blog. A high-resolution GOES image can be found at the NOAA Environmental Visualization Laboratory.

McIDAS images of GOES-11 0.65 µm visible channel data during the day and GOES-11 10.7 µm IR channel data at night (above; click image to play animation) show how the Mesoscale Convective System over Arizona on 05 July evolved into a Mesoscale Convective Vortex (MCV) on the following morning over the deserts of southern California, as the cirrus canopy of the convective system eroded to reveal the mid-level circulation. The MCV then appeared to play a role in helping to initiate new convective activity over California later in the afternoon on 06 July.

AWIPS image comparison from 18:00 UTC on 06 July

AWIPS image comparison from 18:00 UTC on 06 July

MCVs maintain their structure through the release of latent heat associated with condensation when clouds form and especially when precipitation forms. This release of heat alters the stability of the atmosphere, inducing the formation of a cyclonic potential vorticity anomaly. MCVs erode when they encounter high wind shear.

An AWIPS image comparison (above) shows GOES visible channel data (the seam in the middle of the images demarcates data from GOES-11 or GOES-West and GOES-13 or GOES-East; note that the older GOES-11 data is darker because of the age and degradation of that satellite’s visible sensors), GOES 10.7 µm IR channel data, the Blended Total Precipitable Water (TPW) Percent of Normal product, and 850-300 hPa layer wind shear from the GFS and RUC models. In the present example, the MCV exists in an axis of low values of 850-300 hPa wind shear, as noted by model forecasts from the RUC and from the GFS. Abnormally high values of precipitable water are also present, exceeding 200% of normal according to the ‘Blended Product’ that combines observations from the GOES Sounder and ground-based GPS stations. Rawinsonde reports from Phoenix (00 UTC and 12 UTC on 06 July) and from Yuma (12 UTC and 14 UTC on the 06 July) show abundant moisture and relatively low shear. All of these data show environmental conditions that support MCVs.

GOES-11 Sounder TPW and LI derived product images

GOES-11 Sounder TPW and LI derived product images

In the pre-convective environment across southern Arizona on 05 July, GOES-11 Sounder derived product images (above) showed Total Precipitable Water (TPW) values in the 40-50 mm (1.6 to 2.0 inch) range, and Lifted Index (LI) values as low as -5º to -8º C.

MODIS 11.0 µm IR image + negative and positive cloud-to-ground lightning strikes

MODIS 11.0 µm IR image + negative and positive cloud-to-ground lightning strikes

As the MCS continued to move westward across Arizona, an AWIPS image of 1-km resolution MODIS 11.0 µm IR data at 05:33 UTC (above) showed cloud top IR brightness temperatures as cold as -72º C (black color enhancement), along with numerous negative and positive cloud-to-ground lightning strikes. At that time, the thunderstorm outflow winds were moving through Blythe, California (station identifier KBLH) producing wind gusts of 46 knots (52 mph) with a reduction in visibility to 1.5 miles, and also through Yuma, Arizona (station identifier KNYL) producing wind gusts of 40 knots (46 mph) with a reduction in visibility to 1.25 miles.

View only this post Read Less

Large hail and damaging wind event across the Upper Midwest region

Severe thunderstorms produced a long swath of large hail and damaging winds (SPC storm reports) across much of the Upper Midwest region from eastern South Dakota to northwestern Wisconsin on 01 July 2011. In addition, there were tornadoes that produced EF-1 and EF-2 damage in southwestern Minnesota (NWS Sioux... Read More

POES AVHRR 10.8 µm IR image + resulting hail and damaging winds reports

POES AVHRR 10.8 µm IR image + resulting hail and damaging winds reports

Severe thunderstorms produced a long swath of large hail and damaging winds (SPC storm reports) across much of the Upper Midwest region from eastern South Dakota to northwestern Wisconsin on 01 July 2011. In addition, there were tornadoes that produced EF-1 and EF-2 damage in southwestern Minnesota (NWS Sioux Falls summary), EF-1 rated tornadoes in central Minnesota (NWS Minneapolis summary), and a tornado that produced EF-2 damage in northwestern Wisconsin (NWS Duluth tornado event summary). At a campground in northwestern Wisconsin there was one fatality and 39 injuries as a result of falling trees from severe straight-line winds.

An AWIPS image of POES AVHRR 10.8 µm IR data at 20:21 UTC or 3:21 PM local time (above) showed the initial thunderstorm as it was intensifying near the South Dakota / Minnesota border, along with the resulting widespread reports of hail and wind damage as the thunderstorm complex grew and moved northeastward (NWS Duluth event summary). The coldest cloud top IR brightness temperature on the AVHRR image was -81ºC (violet color enhancement).

McIDAS images of GOES-13 0.63 µm visible channel data (below; click image to play animation; also available as a QuickTime movie) showed numerous overshooting tops associated with the severe thunderstorms as they moved from eastern South Dakota across Minnesota and into northwestern Wisconsin. Early in the animation, it is also interesting to note the persistent low-level fog/stratus cloud bank that covered the western portion of Lake Superior as the warm, humid air moved across the still-cold waters of the lake.

GOES-13 0.63 µm visible channel images (click image to play animation)

GOES-13 0.63 µm visible channel images (click image to play animation)

The corresponding GOES-13 10.7 µm IR images (below; click image to play animation; also available as a QuickTime movie) showed the cold cloud top IR brightness temperatures with these storms, which reached a minimum value of -72ºC at 21:15 over Minnesota.Several storm top IR cold/warm thermal couplets were seen, along with subtle “enhanced-V” storm top signatures over the Minnesota/Wisconsin border region.

GOES-13 10.7 µm IR images (click image to play animation)

GOES-13 10.7 µm IR images (click image to play animation)

View only this post Read Less