5-minute CONUS Sector GOES-19 (Preliminary/Non-operational) True Color RGB images — created using Geo2Grid (below) displayed ice in southwestern/southern Lake Michigan that was being driven away from the coastlines of Wisconsin, Illinois and Indiana by gusty NW winds on 14th January 2025.GOES-16 (GOES-East) Visible images (below) included plots of surface and buoy reports... Read More

GOES-19 (Preliminary/Non-operational) True Color RGB images, from 1511-2156 UTC on 14 January [click to play MP4 animation]
5-minute CONUS Sector GOES-19 (Preliminary/Non-operational) True Color RGB images — created using
Geo2Grid (below) displayed ice in southwestern/southern Lake Michigan that was being driven away from the coastlines of Wisconsin, Illinois and Indiana by gusty NW winds on
14th January 2025.
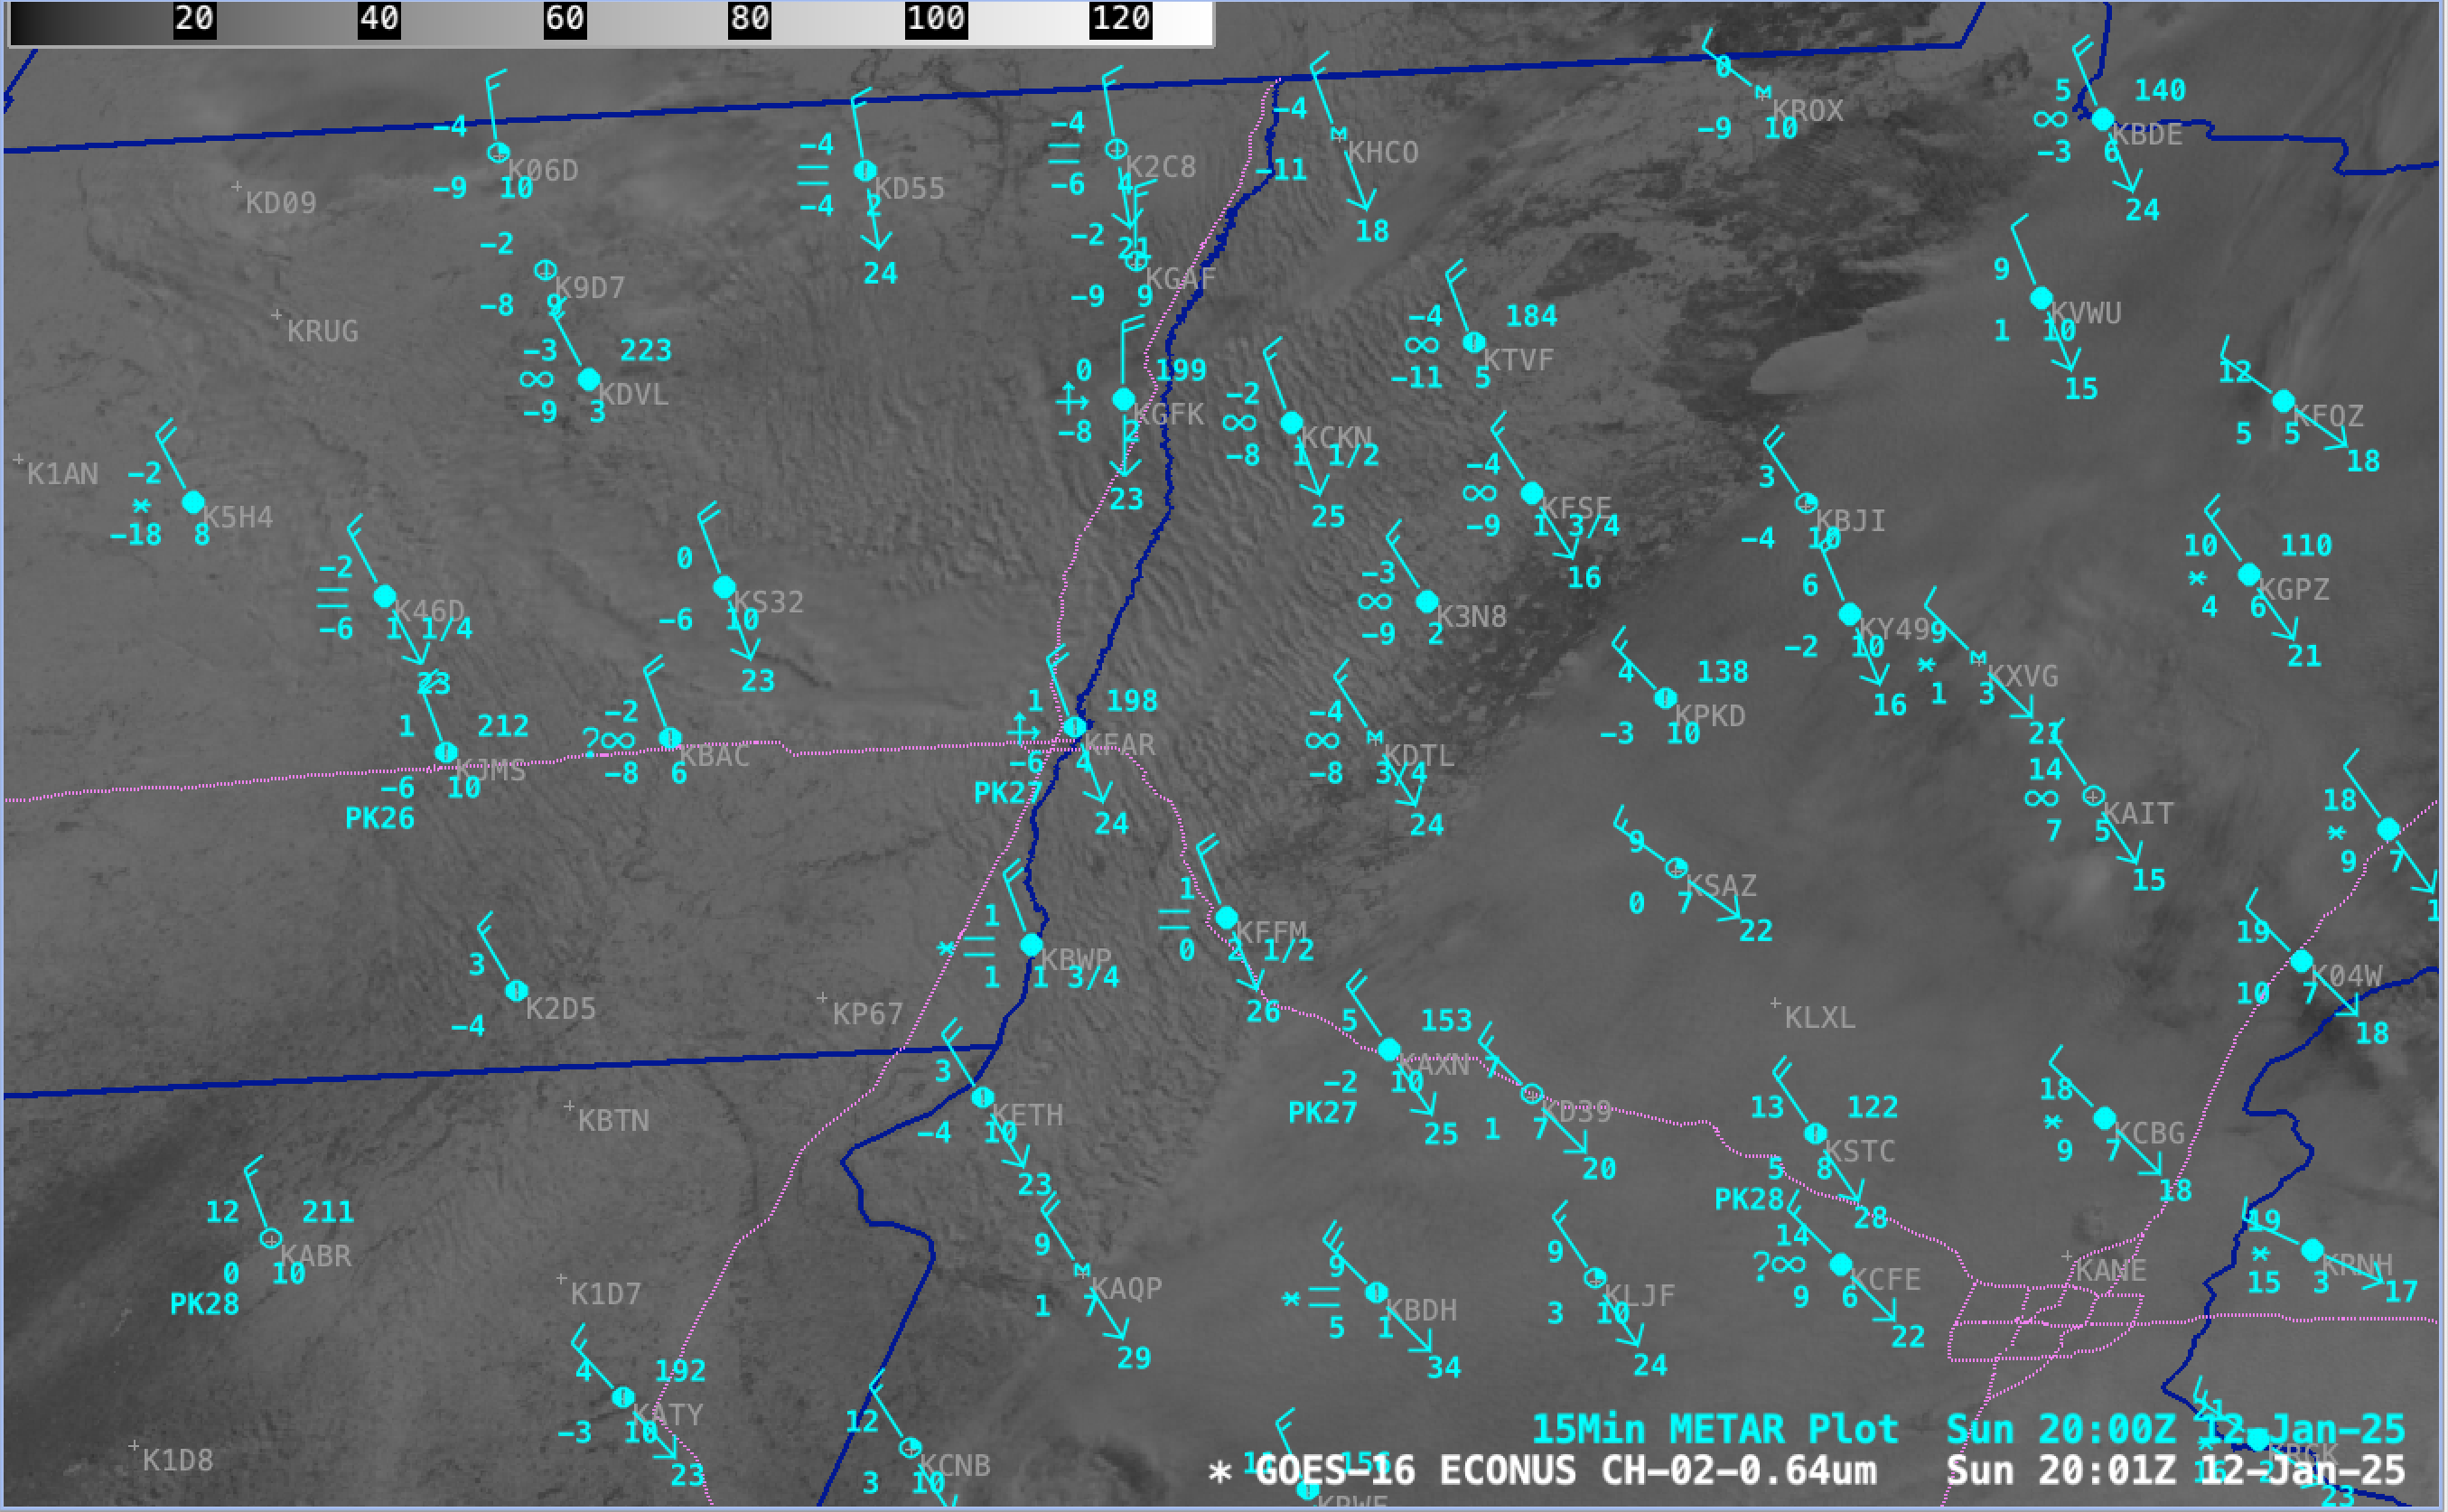
GOES-16 (GOES-East) Visible images (below) included plots of surface and buoy reports — which showed wind gusts in the 25-30 knot range at several sites near the Lake Michigan coast.
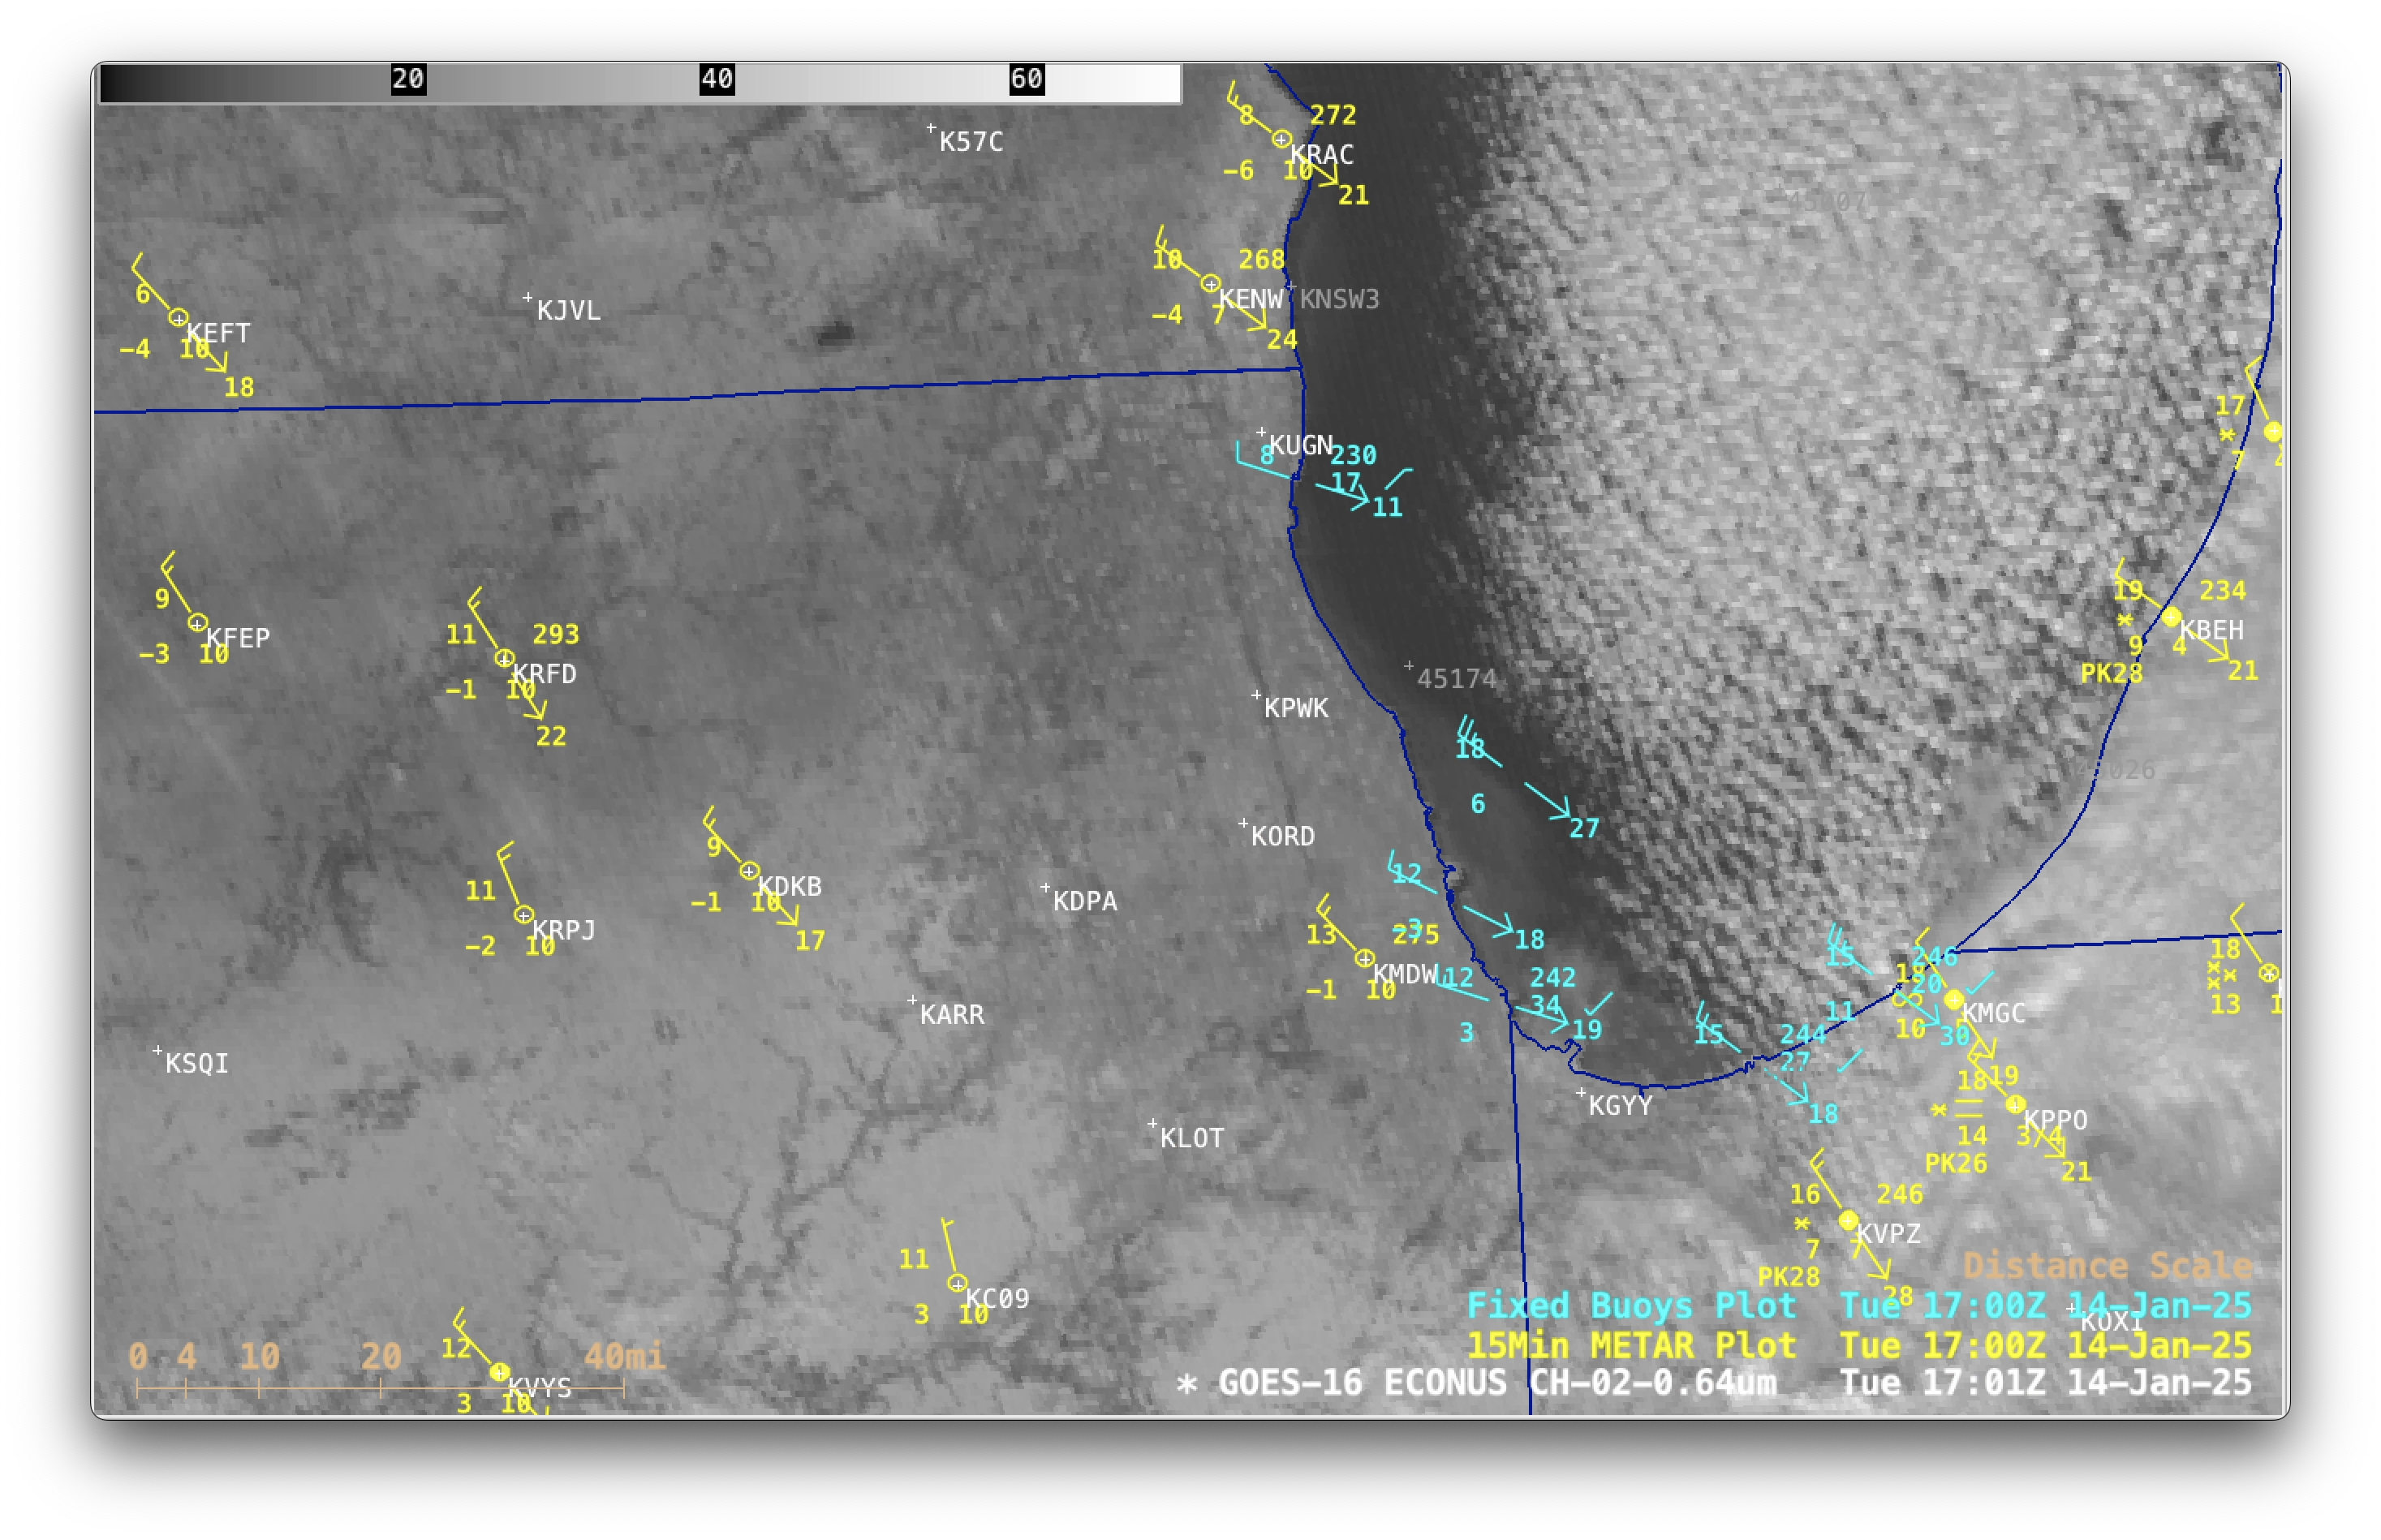
GOES-16 Visible images with plots of 15-minute METAR surface reports (yellow) and hourly Buoy reports (cyan) [click to play MP4 animation]
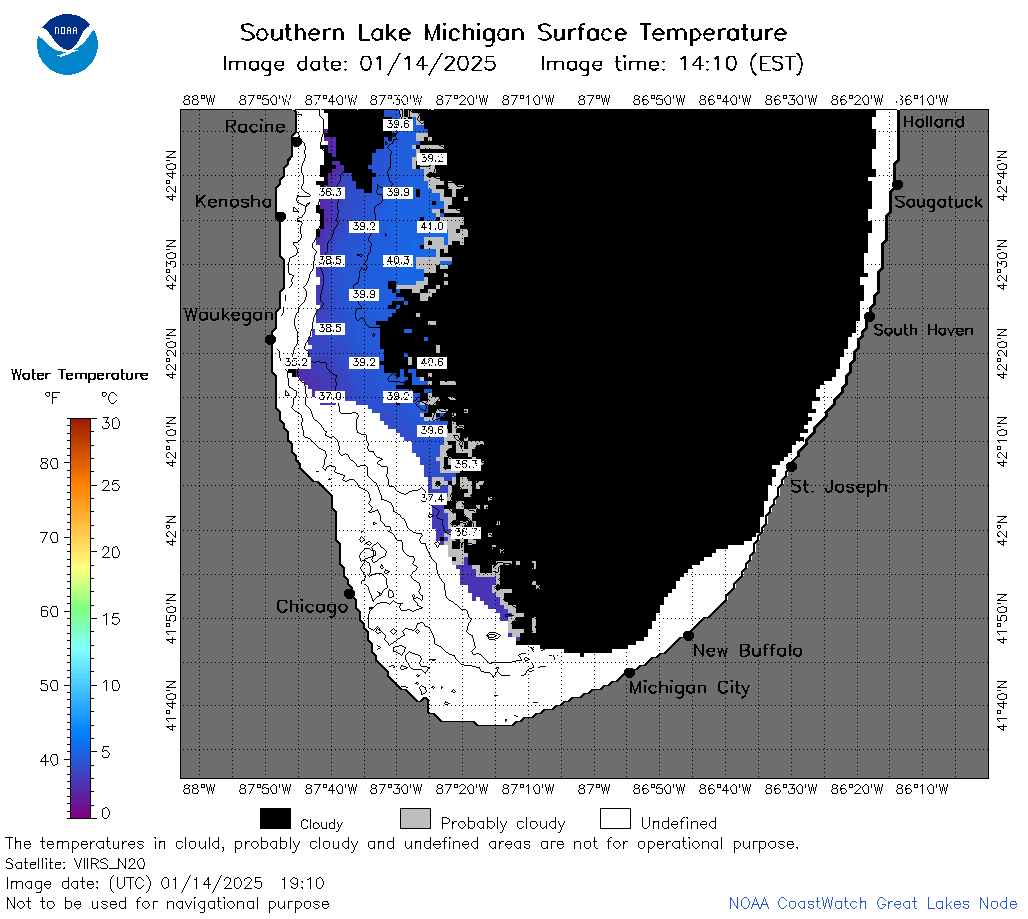
Analysis of Southern Lake Michigan water temperature (derived from NOAA-20 VIIRS data) at 1810 UTC on 14th January; lake ice appears white [click to enlarge]
The presence of lake ice off the southwestern/southern coast of Lake Michigan was confirmed by a Water Temperature analysis
(above) and Synthetic Aperture Radar (SAR) data
(below). Lake ice in SAR imagery exhibits high backscatter values, represented by the yellow to red colors normally associated with higher wind speeds.
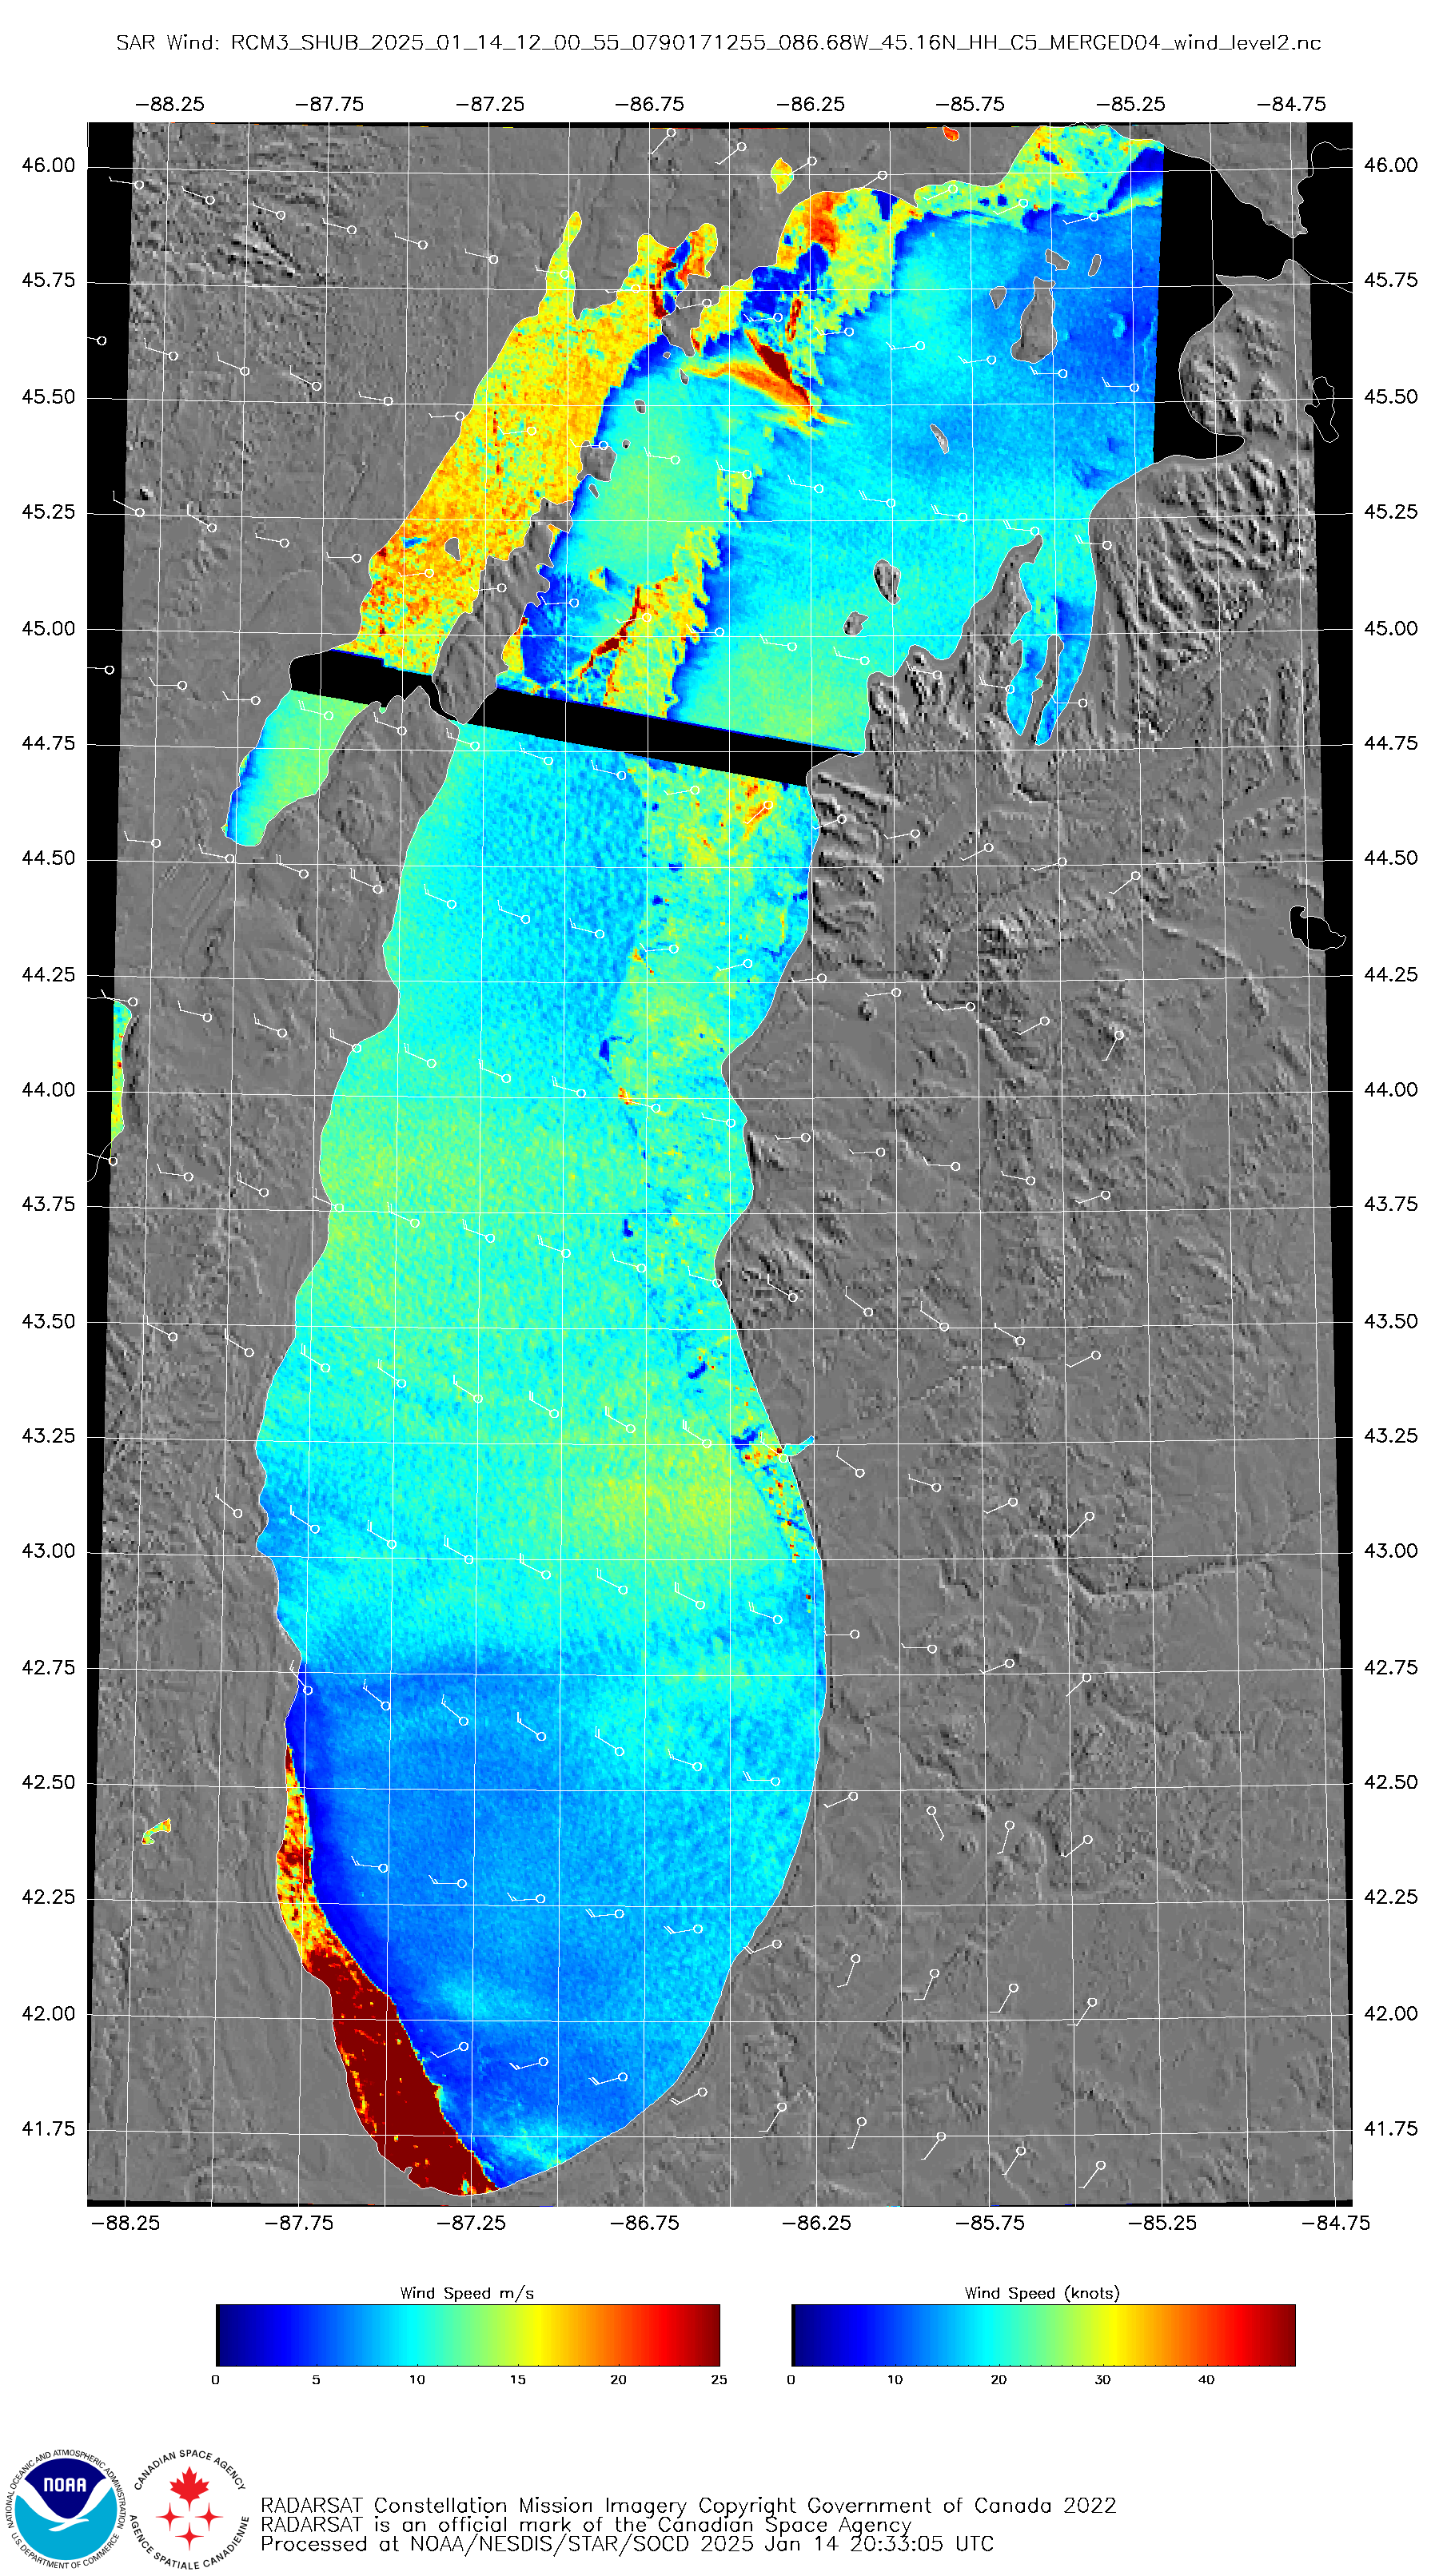
RCM-3 Synthetic Aperture Radar image at 1200 UTC on 14th January [click to enlarge]
A longer sequence of GOES-19 True Color RGB images during the daytime hours on 13/14/15 January
(below) revealed a gradual growth in nearshore ice across southwestern/southern Lake Michigan during that 3-day period, as cold air remained in place across that area.

GOES-19 (Preliminary/Non-operational) True Color RGB images during the daytime hours on 13/14/15 January [click to play MP4 animation]
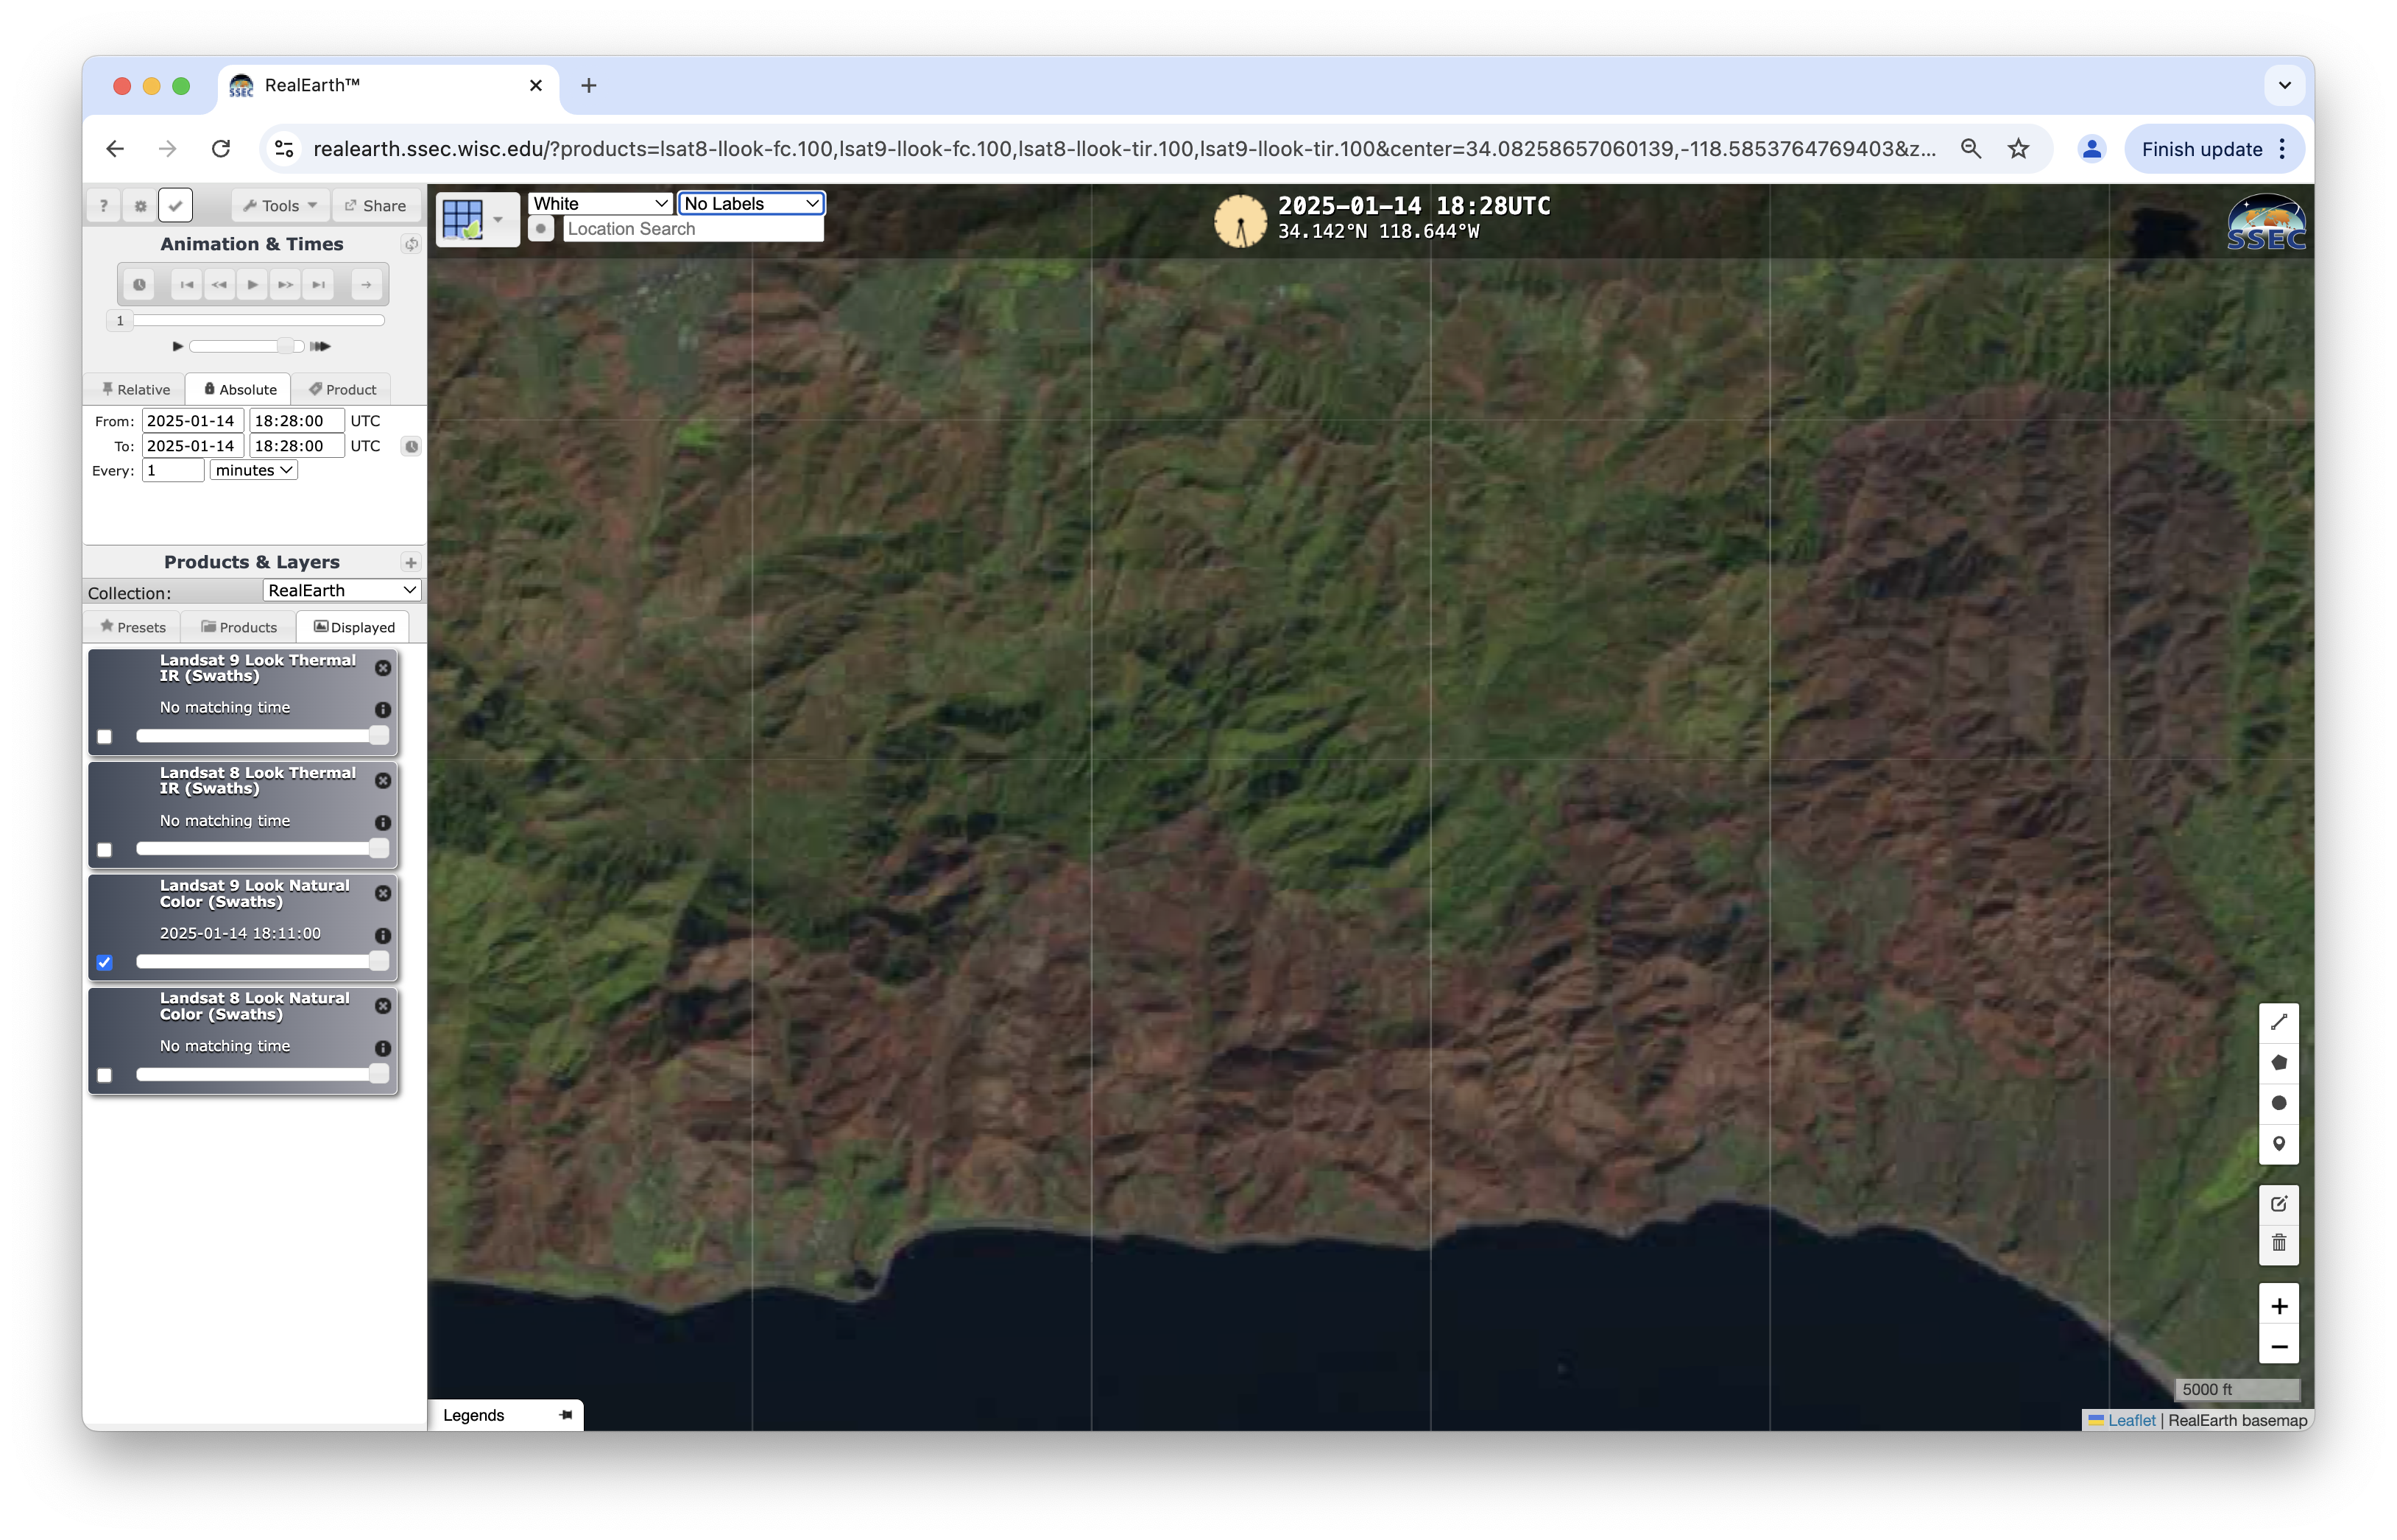
A Landsat-9 Natural Color RGB image at 1635 UTC on 16th January
(below) showed a high-resolution view of Lake Michigan ice (pale shades of cyan) off the coast near Chicago.

Landsat-9 Natural Color RGB image at 1635 UTC on 16th January [click to enlarge]
View only this post
Read Less