Suomi/NPP VIIRS 11.45 µm IR channel and NUCAPS sounding points (click to enlarge)
NOAA Unique Cross-track Infrared Sounder (CrIS)/Advanced Technology Microwave Sounder (ATMS) Processing System (NUCAPS) Soundings have started flowing into AWIPS-2 at NWS WFOs across the country. These soundings offer high spectral (and high spatial) resolution soundings derived from the CrIS and ATMS instruments that fly on the Suomi/NPP satellite. The toggle above shows the footprint of the soundings in comparison to an 11.45 µm VIIRS instrument (also on the Suomi/NPP satellite) IR image from approximately 1800 UTC on 10 June 2014. The NUCAPS soundings cover a larger area because they are processed by NOAA/NESIS (vs. being downloaded on the X-Band Direct Broadcast antenna at CIMSS in Madison WI, whose antenna is the source of the VIIRS 11.45 µm IR image shown).
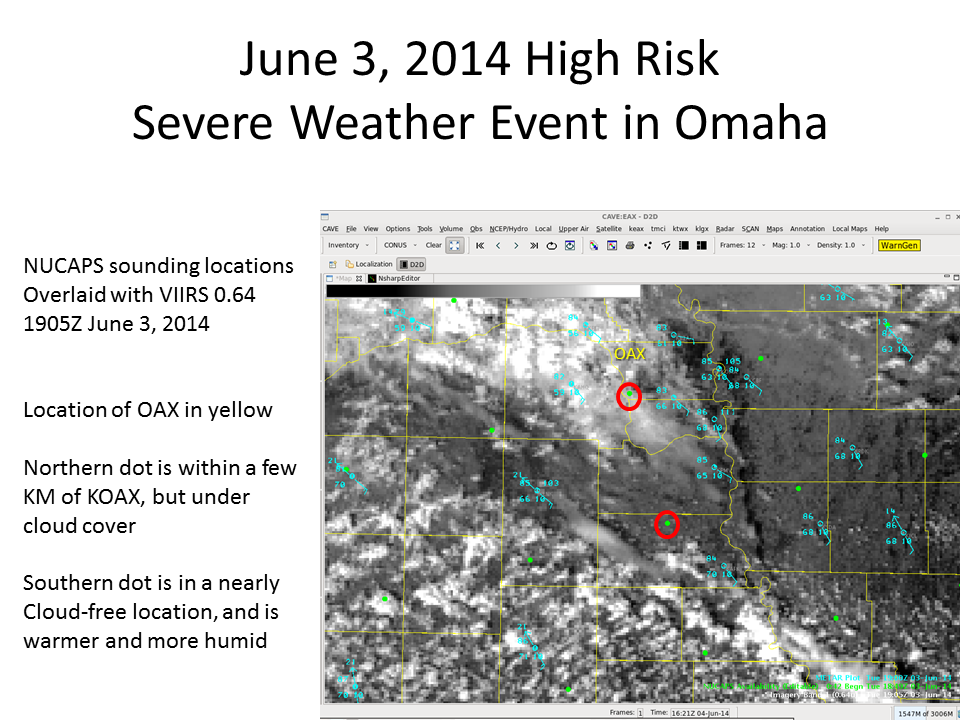
The sounding data, if available, are under the ‘Satellite’ menu tab of AWIPS-2, and then NPP Products can be selected to view NUCAPS Sounding Availability, as shown in this screenshot. Once the sounding locations are loaded, the mouse can be used to select a point, and a left click produces a sounding in an NSharpEditor environment; that is, you can edit it (if, for example, you think the surface dewpoint in the sounding is too dry).
The mid-continent overpass at around 1800 UTC can provide valuable information on the possibility of convective development. For example, consider the visible imagery below from 1915 UTC on May 29 2014. Will convection develop out of that broken cumulus field as forecast by the GFS (not shown)?
GOES-13 0.63 µm Visible Imagery, 1915 UTC 29 May 2014 (click to enlarge)
The animation below steps through the Suomi/NPP overpass just after 1800 UTC that was used to created NUCAPS soundings on that day, followed by a close-up over Omaha, then a screen-capture of the created sounding. The sounding (which includes surface values close to those reported by the METAR) has only modest values of Convective Available Potential Energy (CAPE), suggesting that convection is unlikely. And, indeed, visible imagery near sunset shows dissipating cumulus clouds.
NUCAPS Sounding over North America, over Omaha and surroundings, and the individual NUCAPS sounding indicated (Courtesy of Dan Nietfeld, SOO at Omaha/Valley WFO, click to enlarge)
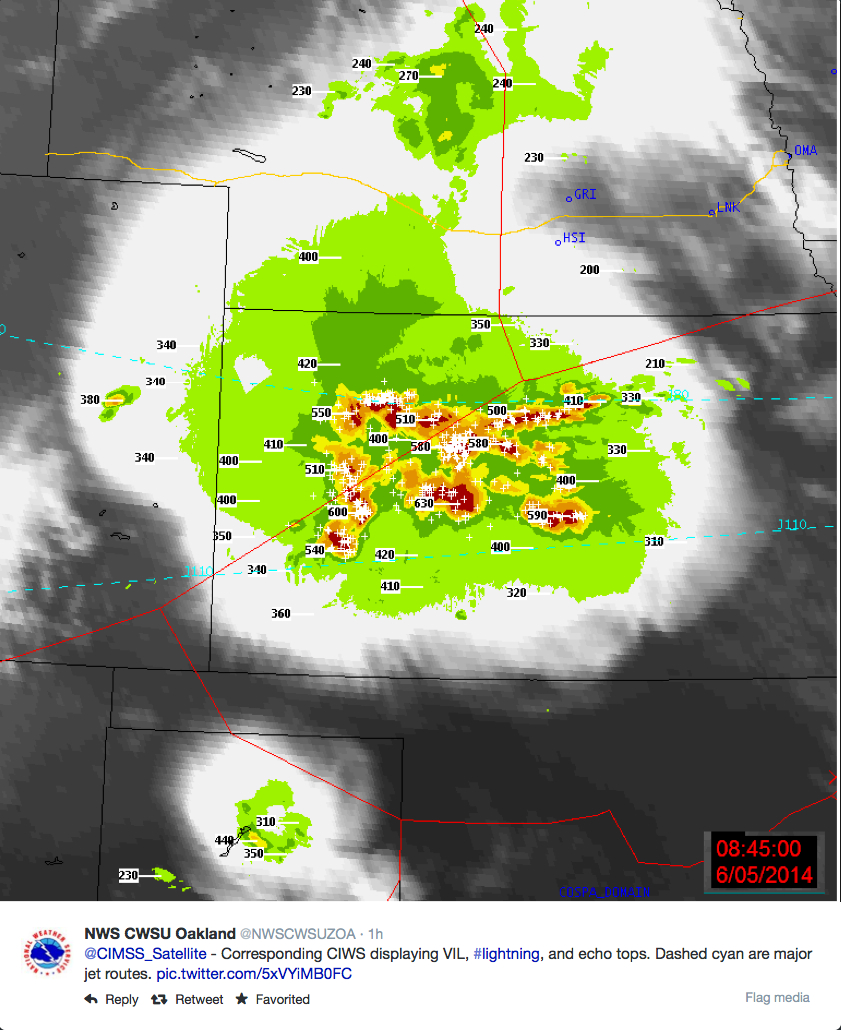
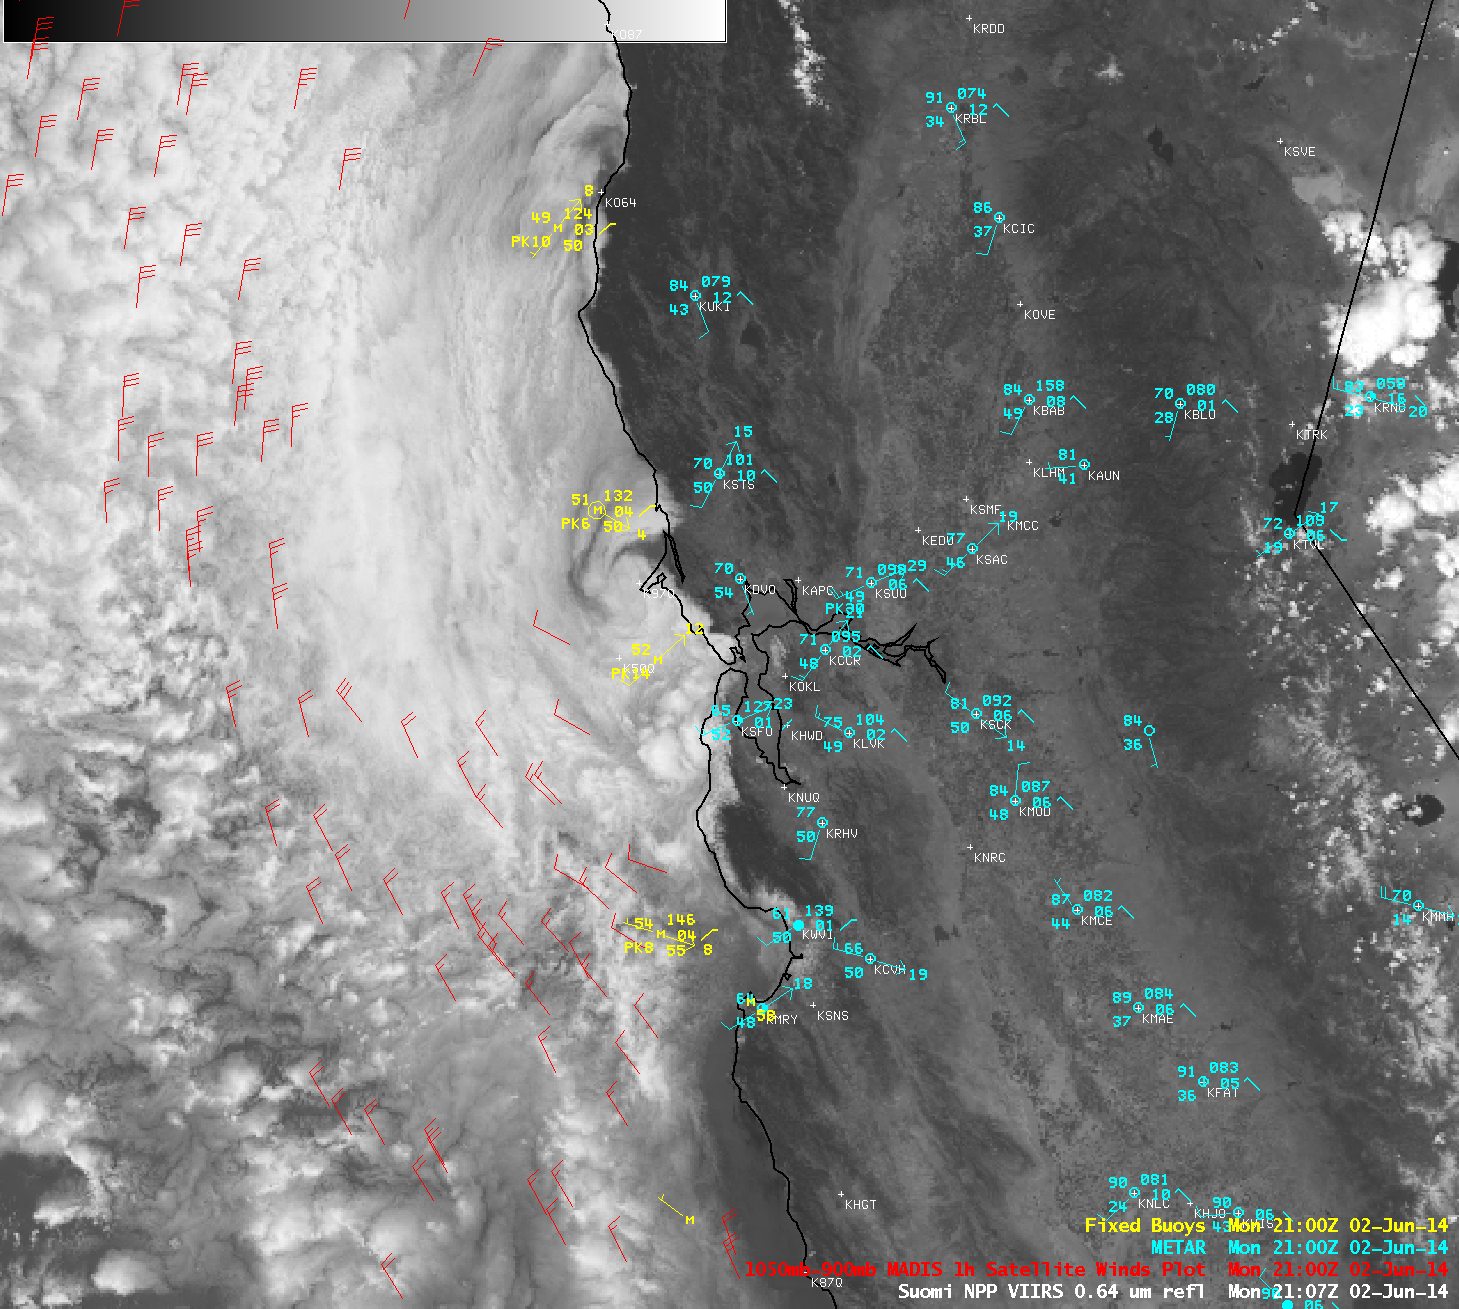
A second case, below, also from Dan Nietfeld, shows NUCAPS soundings before the devastating hailstorm on June 3 in a High Risk region. In this case, the NUCAPS soundings underestimated the temperature/dewpoint at the surface, but the editable sounding software makes quick work of adjusting the lowest part of the sounding, and the CAPE in the adjusted sounding increased from 1800 to more than 3000. (The location of the sounding is shown here; it is the southern of the two circled green dots.) NUCAPS data underscores the potential of any convection.
NUCAPS soundings, original and adjusted, 1849 UTC on 3 June (Also courtesy Dan Nietfeld, NWS; click to enlarge)
(Click here for further information on ATMS; Click here for further information on CrIS). Many thanks to Dan Nietfeld, SOO at Omaha, for imagery above. Hyperspectral Soundings are described in a COMET module that can be viewed here. A paper (pdf format) describing validation of NUCAPS soundings is available here. Suomi/NPP support is provided in part by the NOAA/NESDIS Joint Polar Satellite System (JPSS) program.
View only this post Read Less


