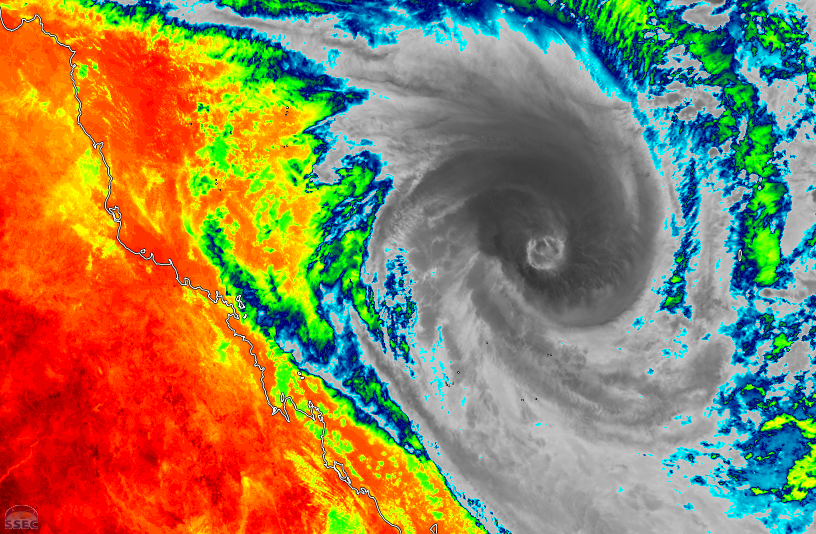
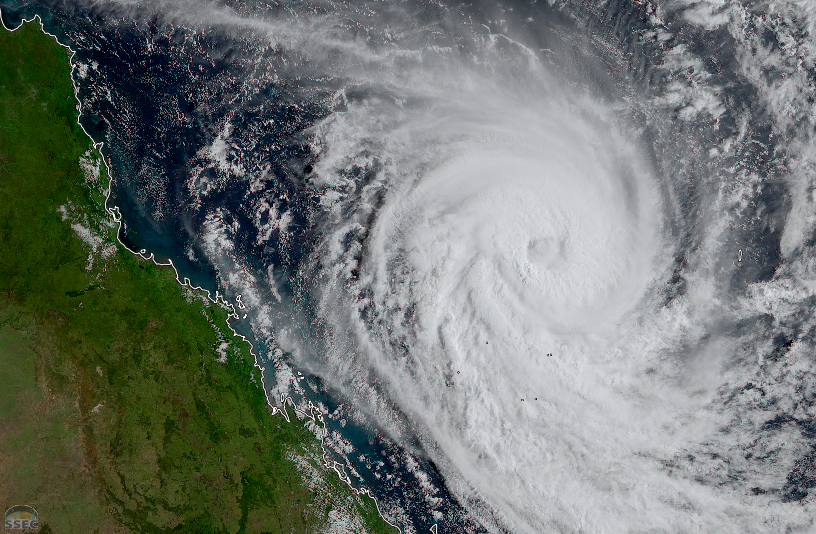
It has been an active period of impactful weather in and near Australia, and today is no exception. Severe Tropical Cyclone Alfred continues to spin northeast of Queensland. The latest update from the Australian Bureau of Meteorology indicates a central pressure of 956 mb. Over the last day, it was downgraded from a Catergory 4 to a Category 3, but sustained winds are still at 85 knots (155 km/h) and gusts are reaching 120 knots (220 km/h). Recent Band 14 (infrared window) and true color imagery from AHI aboard Himawari-9 as displayed on RealEarth confirms Alfred’s weakening, with a filled-in eye that is well over 100 km across.
The current forecasted track for Alfred is to continue along a largely southerly path, and it is expected to pass between mainland Australia and the French island of New Caledonia with no landfall. The most significant impacts expected to be storm surges and waves. However, outer rain bands may prove to be challenging to the Queensland coast, which has already been struggling with the aftermath of recent significant rainfall.
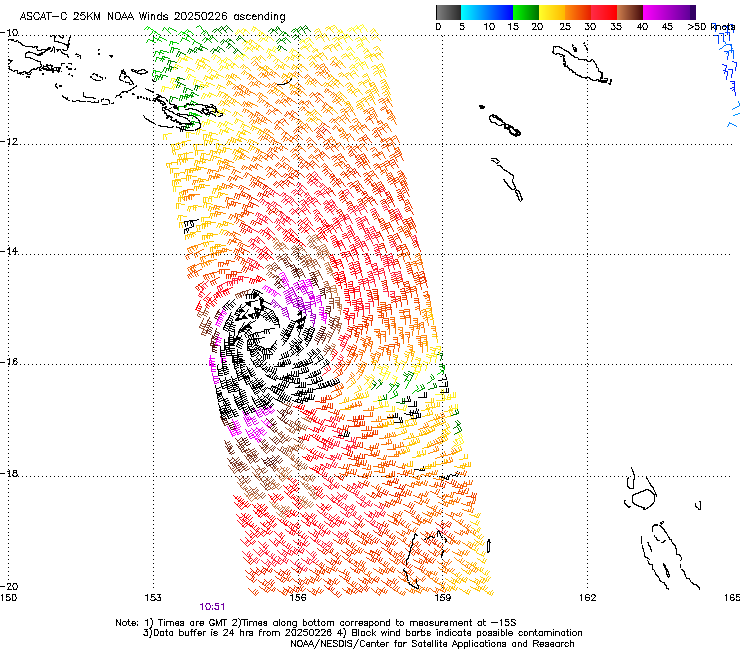
MetOp-C passed directly over the center of Alfred on 26 February enabling ASCAT analysis of the near-surface winds. While most meteorologists already know that the strongest hurricane winds are not directly in the center of the rotation but near the eyewall, this image helps to reinforce that idea. Due to the relatively narrow swath of ASCAT and the geometry of low earth orbits, it can be challenging to get more frequent wind updates.
Alfred was one of three named tropical cyclones that were concurrently active in the tropical western Pacific Ocean this week, alongside Seru and Rae. While these latter storms were not as intense as Alfred at its peak, the impacts were more significant due to passing much more closely to the Pacific island nations of Vanuatu and Fiji. This true color AHI loop shows the rare sight of three Category 1+ tropical storms in such close proximity. Since then, the later two storms have both weakened and moved away from the populated islands.
View only this post Read Less


