This website works best with a newer web browser such as Chrome, Firefox, Safari or Microsoft
Edge. Internet Explorer is not supported by this website.
10-minute Full Disk scan True Color RGB images from GOES-18 (GOES-West), GOES-17, GOES-19 (Preliminary/Non-operational) and GOES-16 (GOES-East) created using Geo2Grid (above) showed the slow drift of nearshore ice and the more rapid motion of lake effect clouds across southern Lake Michigan on 18th February 2025.The respective satellite locations over the Equator at... Read More
From left to right: GOES-18, GOES-17, GOES-19 and GOES-16 True Col.or RGB images, from 1310-1540 UTC on 18th February [click to play animated GIF]
10-minute Full Disk scan True Color RGB images from GOES-18 (GOES-West), GOES-17, GOES-19 (Preliminary/Non-operational) and GOES-16 (GOES-East) created using Geo2Grid(above) showed the slow drift of nearshore ice and the more rapid motion of lake effect clouds across southern Lake Michigan on 18th February 2025.
The respective satellite locations over the Equator at that time were: GOES-18 (137.0 W longitude), GOES-17 (104.4 W longitude), GOES-19 (89.5 W longitude) and GOES-16 (75.2 W longitude). GOES-17 had been temporarily brought out of storage and was drifting slowly from 12th-15th February 2025, approximately 0.3 degrees of longitude in total. All GOES-17 ABI imagery during this “Longitude Test” were resampled to the nominal 105 W location (the final GOES-17 image during this test period was at 1540 UTC on 18th February). GOES-17 products were analyzed for any potential impacts that this shift in longitude might cause. The overall goal of the Longitude Test was to determine what product impacts (if any) there might be when GOES-16 (currently operational as GOES-East) is moved to 75.5 W in March 2025, ahead of GOES-19’s arrival (GOES-19 is then scheduled to become operational as GOES-East on 4th April). This also tested our ability to track a GOES-R series satellite as it moved (and still receive quality data).
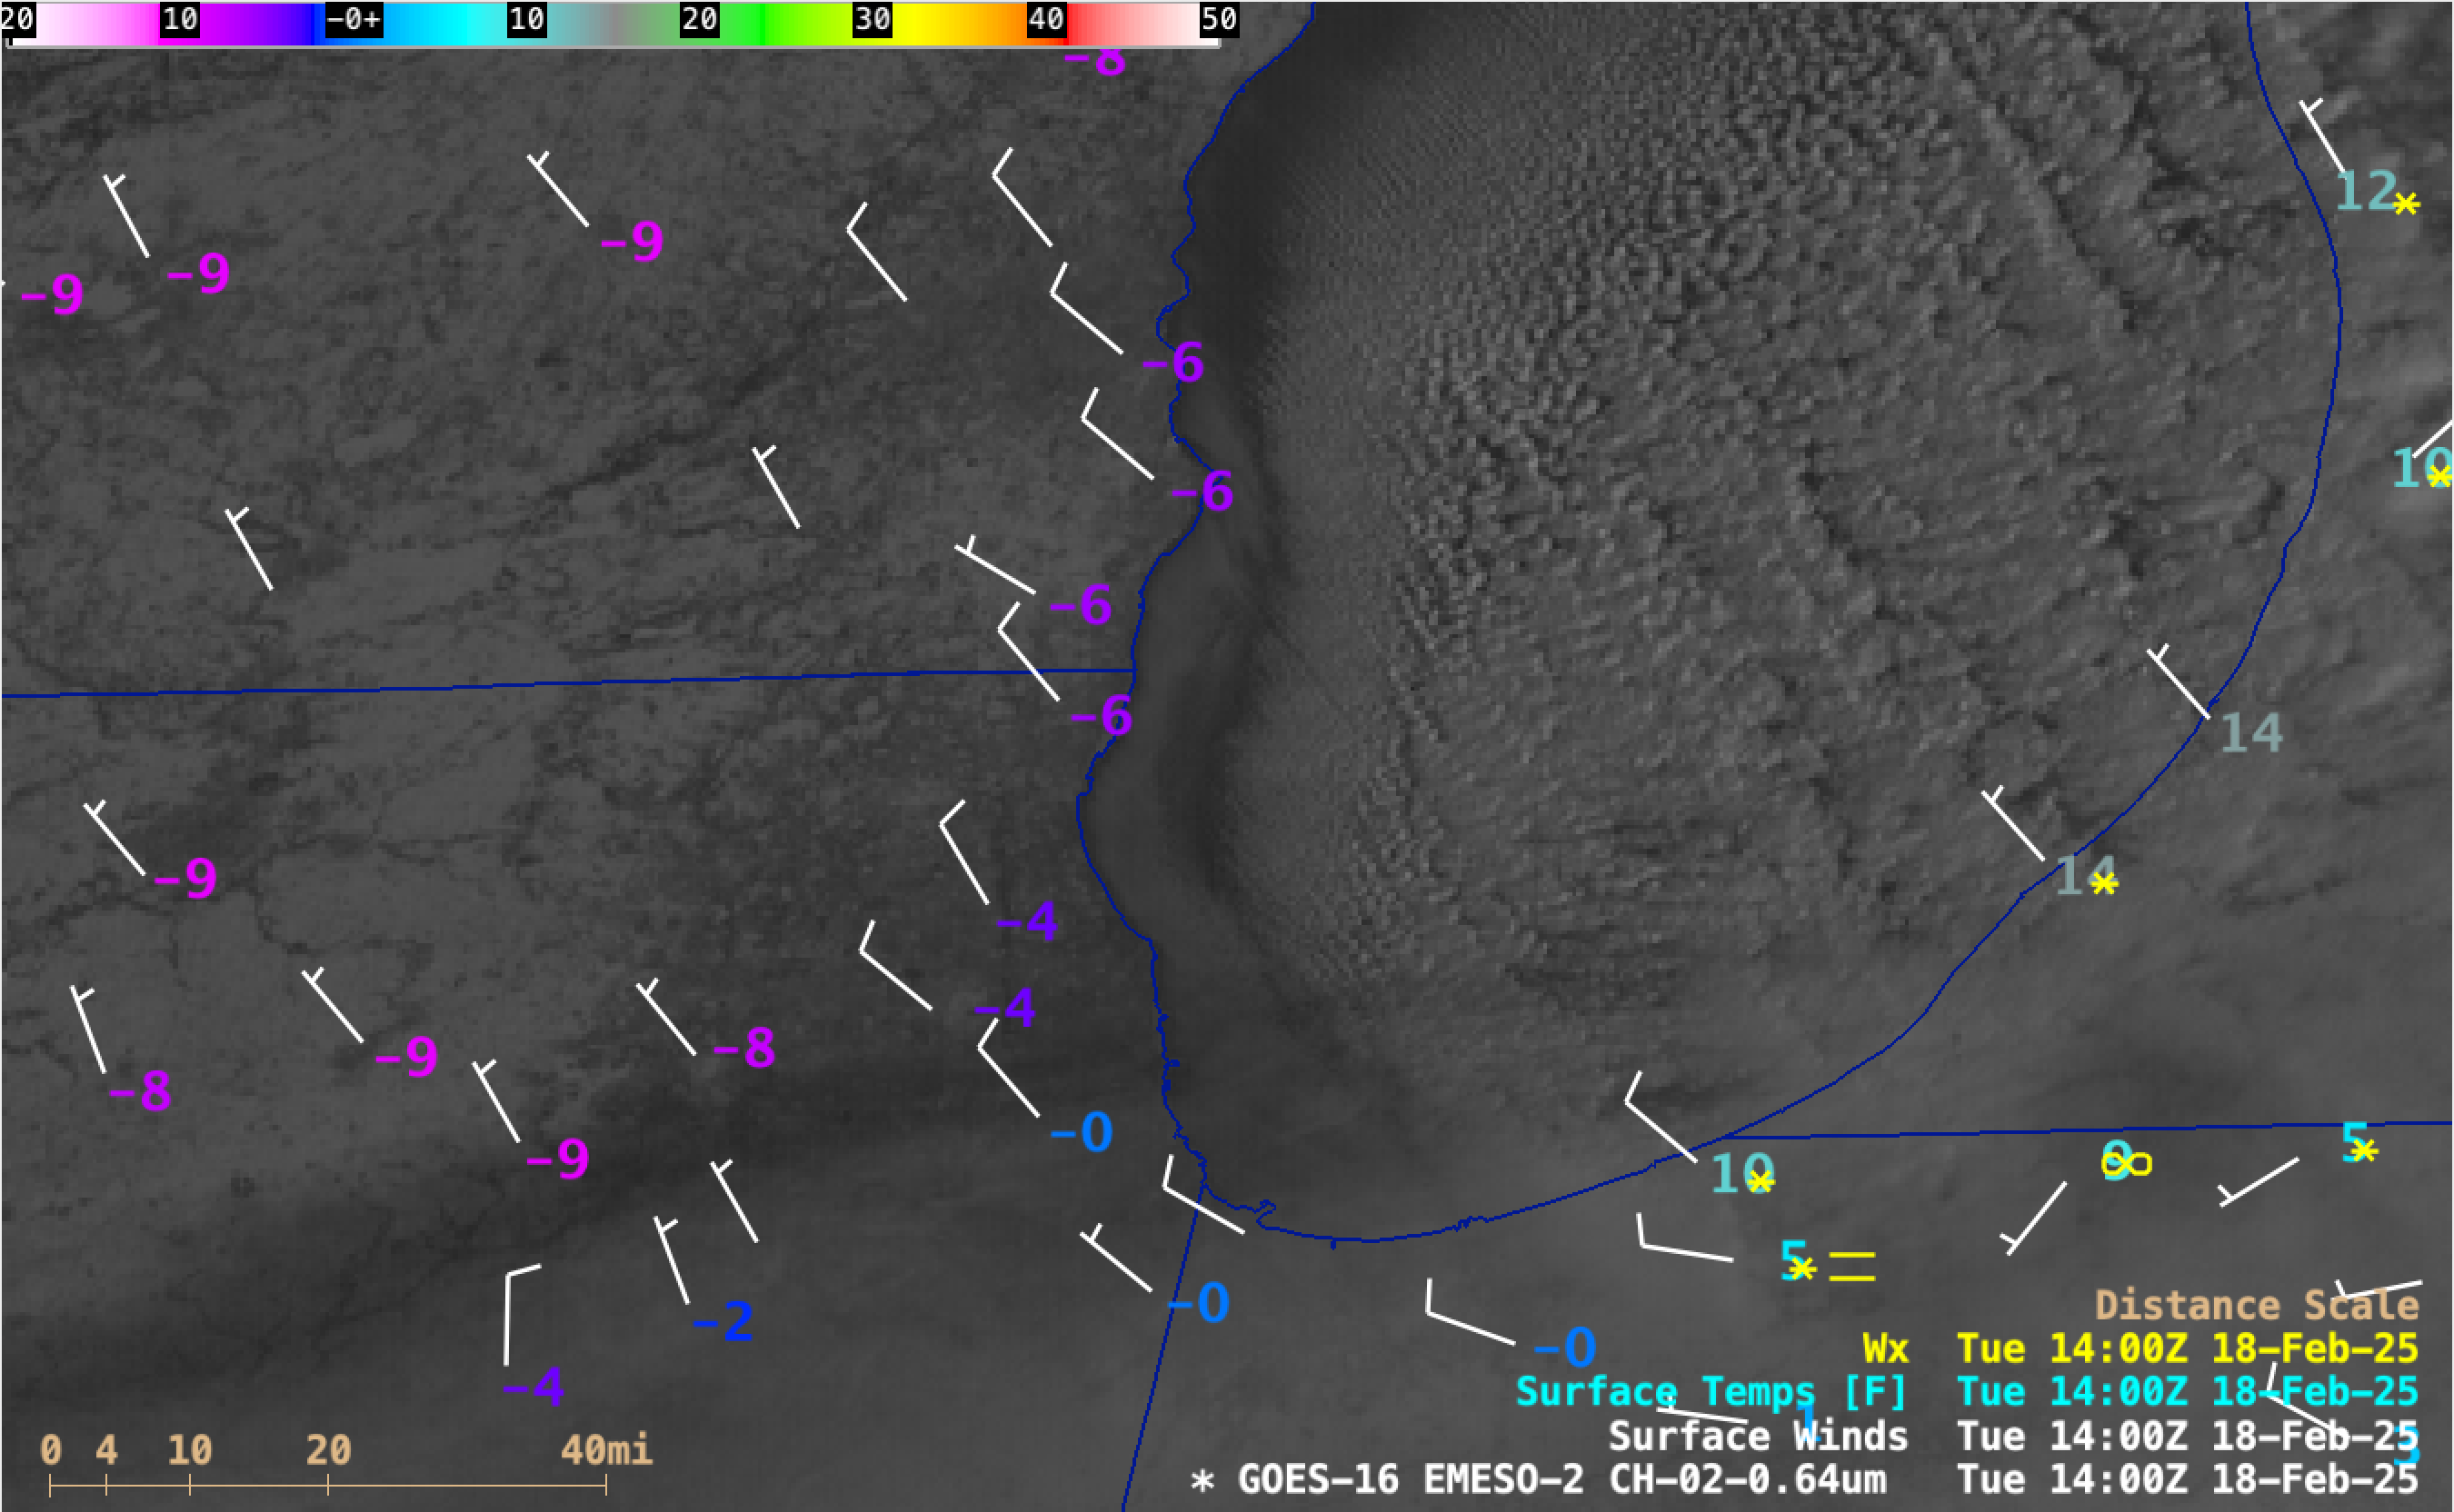
GOES-16 Visible images (below) included plots of surface wind/temperature/weather. Winds were generally light, and early morning temperatures across southeast Wisconsin and northeast Illinois were around -10 F away from the lake and around -5 F along the lakeshore. Air temperatures were much warmer beneath the lake effect clouds that were moving inland across northern Indiana and western Michigan (with some sites reporting light snow).
GOES-16 Red Visible (0.64 µm) images with plots of Surface Wind barbs (white), Surface Temperature (purple/blue/cyan) and Surface Weather (green), from 1301-2201 UTC on 18th February [click to play MP4 animation]
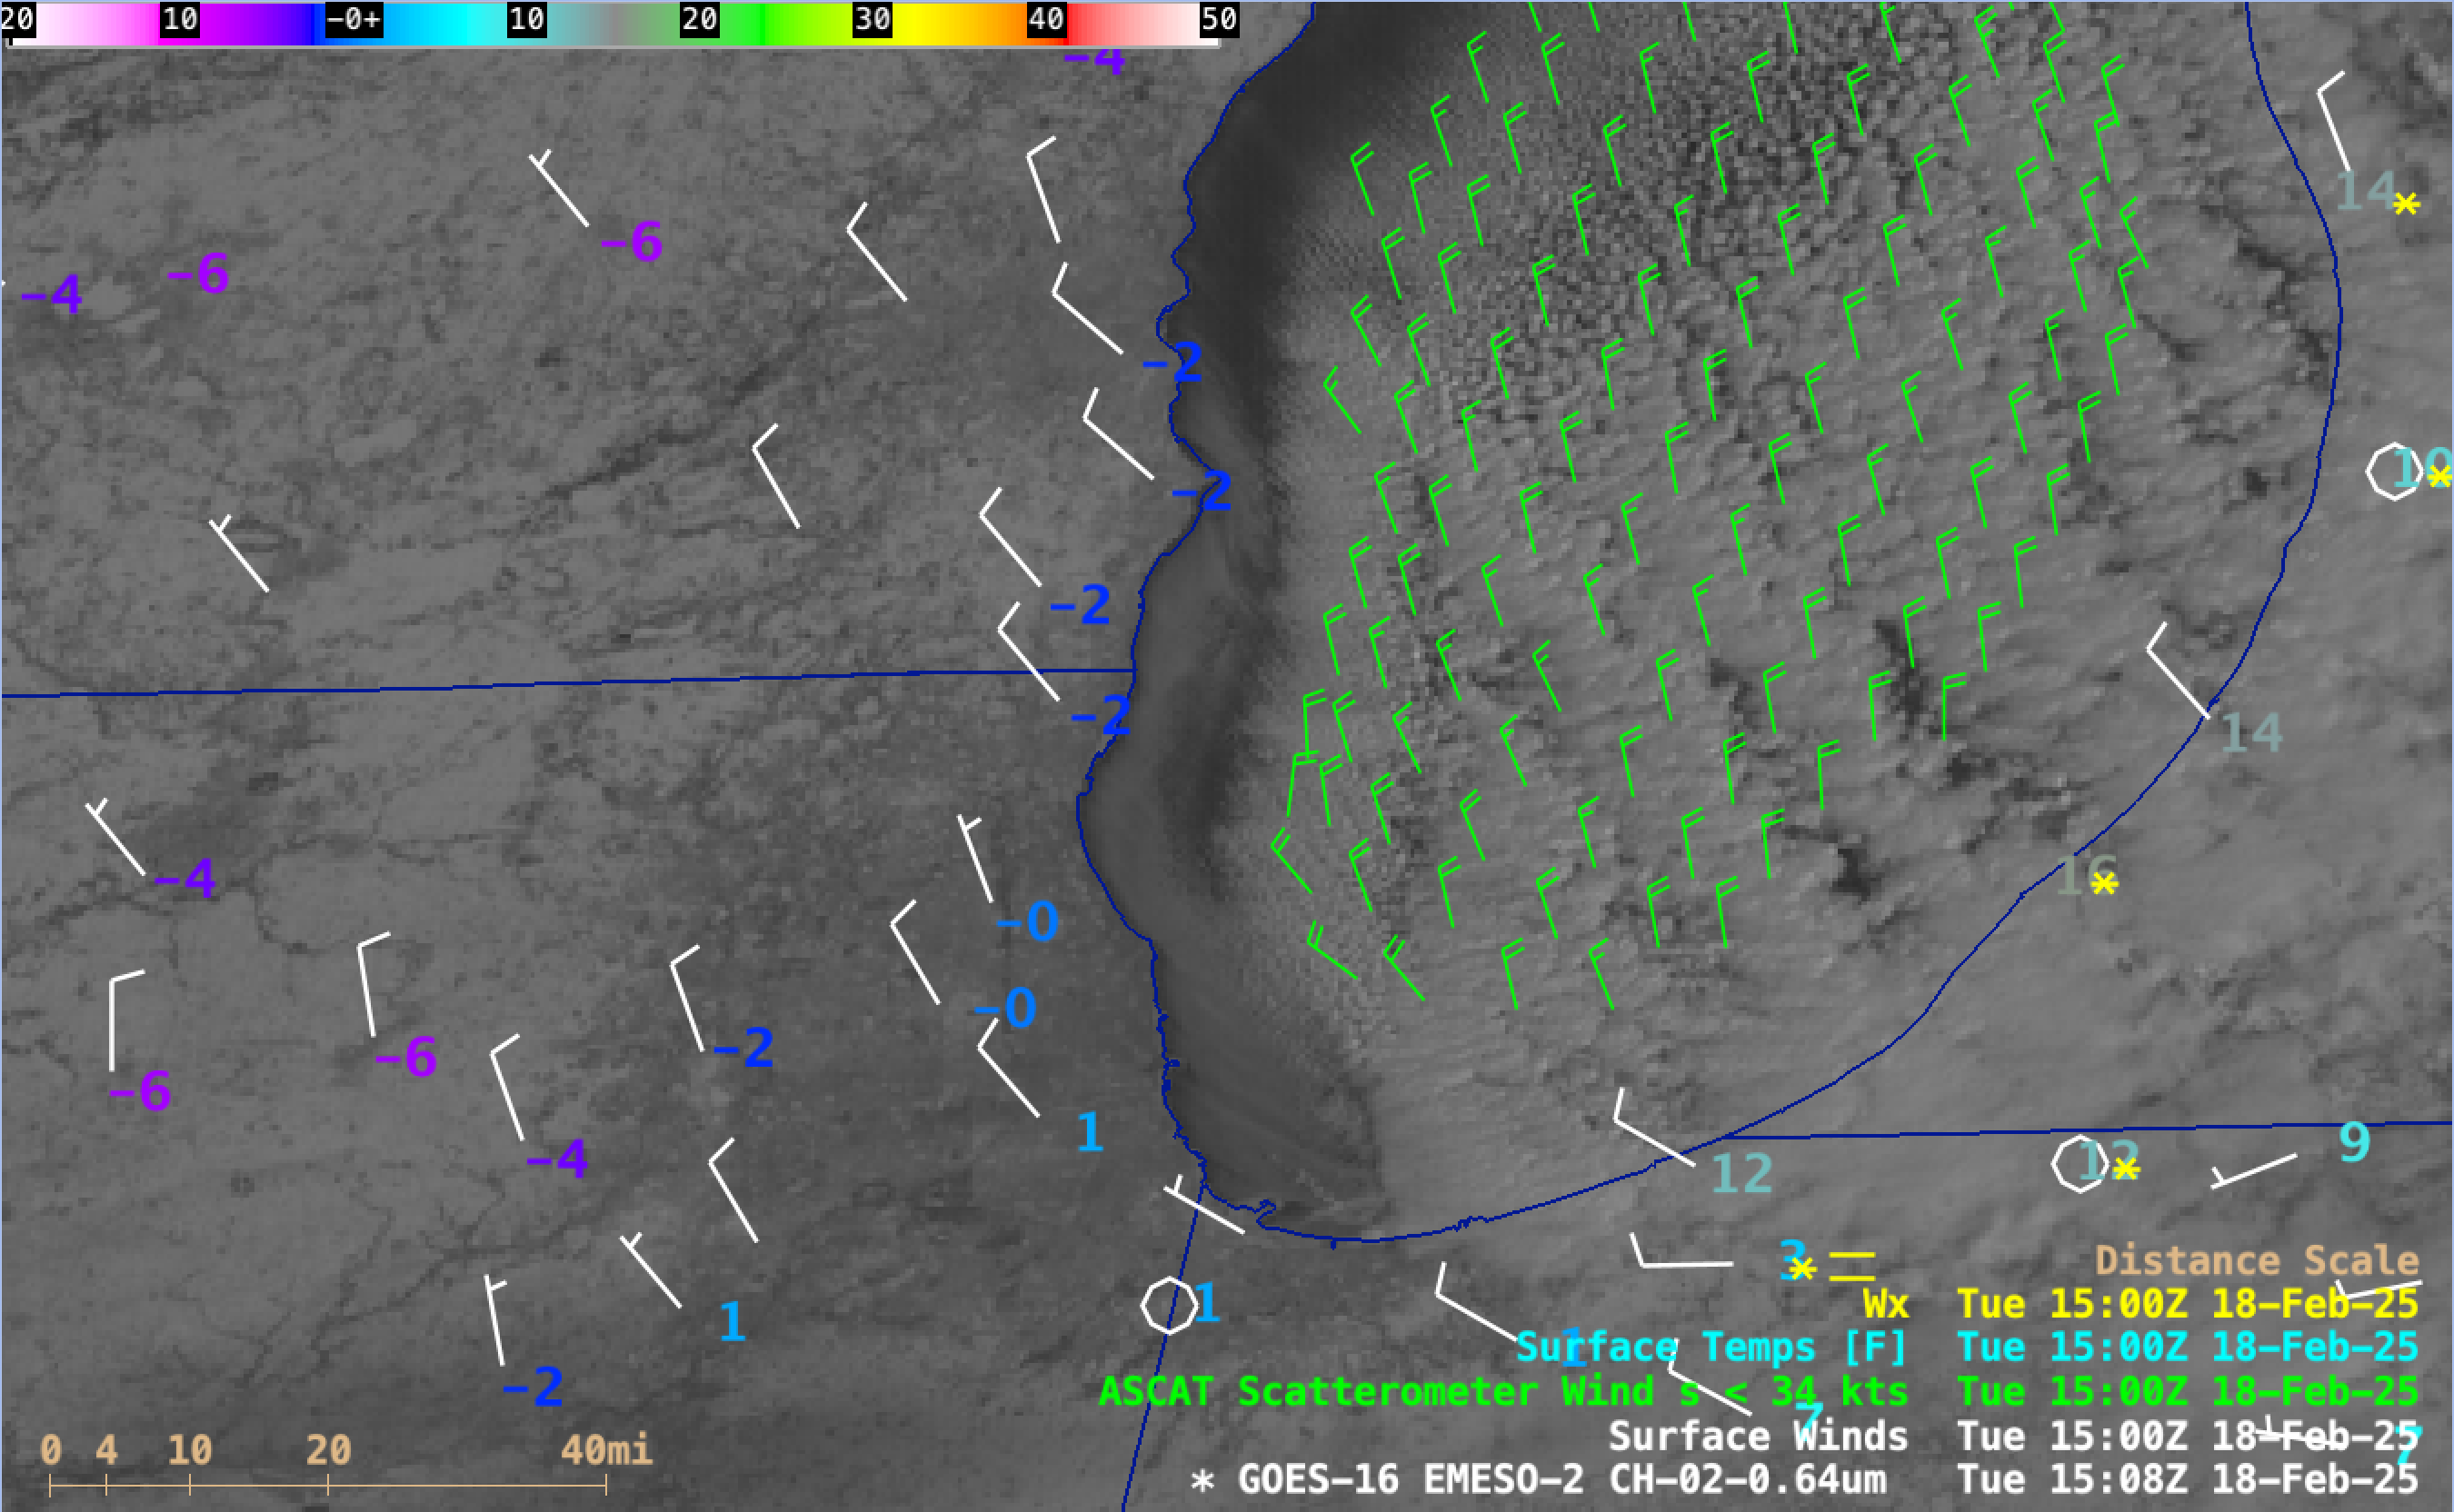
A GOES-16 Visible image with plots of Metop ASCAT winds (below) depicted speeds of 15-25 knots over Lake Michigan at 1508 UTC.
GOES-16 Red Visible (0.64 µm) image with plots of Metop ASCAT winds over Lake Michigan (green) at 1508 UTC on 18th February [click to enlarge]
The University of Wisconsin-Madison Space Science and Engineering Center owns and operates a network of low-earth orbiting direct broadcast satellite antennas around the United States, and provides software support for partner institutions with similar antenna systems. Last week, a new version of the web interface hosted by each antenna’s on-site... Read More
The University of Wisconsin-Madison Space Science and Engineering Center owns and operates a network of low-earth orbiting direct broadcast satellite antennas around the United States, and provides software support for partner institutions with similar antenna systems. Last week, a new version of the web interface hosted by each antenna’s on-site direct broadcast processing system was rolled out to improve the experience of browsing the wide array of satellite imagery and derived products available. Products displayed are automatically generated utilizing a collection of CSPP (Community Satellite Processing Package) software, including Polar2Grid, for designated fixed sectors and tropical cyclones within view of satellite overpasses from a given antenna, with a typical latency of 5 – 15 minutes after an overpass ends.
Screenshot showing an inventory of all LEO satellite products available to view on the AOML direct broadcast processing system image browser.
The new browser pages are available at the following locations:
National Weather Service Pacific Region users also have internal access to similar product browser sites featuring data from SSEC’s antenna located at NWS Guam and NOAA’s antenna at the Inouye Regional Center on Ford Island, Hawaii. These pages are lightweight and perform well on desktop and mobile browsers.
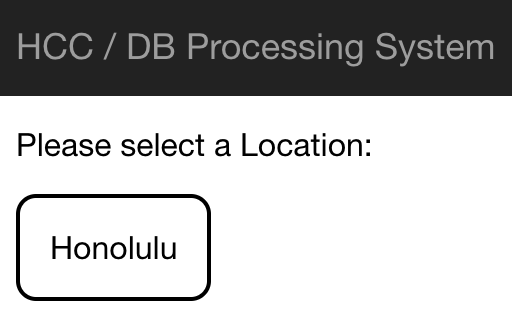
To use the page, you’ll first have to select a location to view. Each site has at least one static sector centered over the antenna location, and if there are tropical storms in the region, additional locations will be listed on this first screen:
Screenshot showing the location selection screen on the HCC direct broadcast processing system image browser.
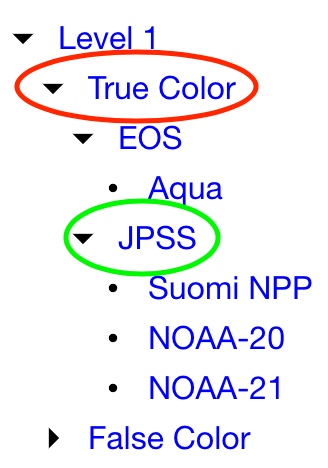
After selecting a location, you can now select which products you’d like to view on the left sidebar. Currently, a selection of Level 1 visible and infrared imagery from VIIRS, MODIS, and AVHRR, plus Level 1 microwave imagery from AMSR-2 is shown in the browser, along with Level 2 microwave products from MiRS (ATMS and AMSU/MHS). The full list is broken down first by level, then product name. By default, similar products from multiple satellite constellations are grouped together, and when possible, similar product nicknames to those used for GOES ABI are used. For example, clicking the down arrow next to True Color (red circle below) reveals that the EOS and JPSS constellations provide this product, and clicking the down arrow next to JPSS (green circle below) reveals that True Color products are available from S-NPP, NOAA-20, and NOAA-21. By default, all will be toggled on when the True Color product is loaded, but you can click any of the names to remove them from the listing if you wish.
Screenshot showing the product selection process details on the HCC direct broadcast processing system image browser.
Selecting products will open a thumbnail listing on the right side of the page with the selected images from the last week in reverse chronological order. When you click on a specific product thumbnail, it will go full screen. If you wish to download the image that you are currently viewing, there is a download button in the upper right. Also on this screen, you can use the keyboard’s arrow keys or the on-screen arrows to go backwards and forwards in time through the products that you selected. This allows you to make an impromptu animation or image toggle of your choosing, as shown below:
Screen capture showing a loop through a week’s worth of MiRS TPW products from the HCC direct broadcast processing system image browser.
Future plans include rolling out a version of this site to a dedicated test processing server located on the campus of the University of Wisconsin-Madison, including additional products of interest, and making it easier to know when upcoming satellite overpasses are expected. And finally, a big thanks to SSEC software developer Geoff Yoerger for his efforts creating this new image browser functionality!
The dominant story in the continental United States on February 18 is the significant winter weather that is impacting nearly every state east of the Rocky Mountains. A glance at this morning’s National Weather Service alert map shows a continuous band of cold weather warnings from the Canadian border down... Read More
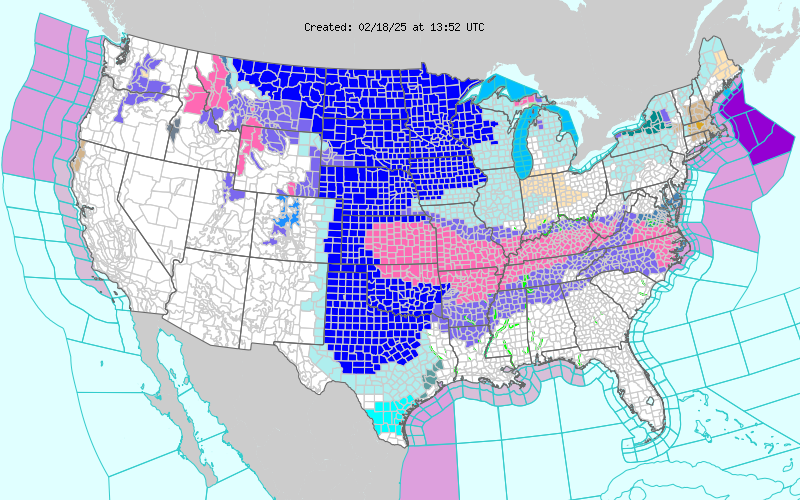
The dominant story in the continental United States on February 18 is the significant winter weather that is impacting nearly every state east of the Rocky Mountains. A glance at this morning’s National Weather Service alert map shows a continuous band of cold weather warnings from the Canadian border down to central Texas, with a fierce winter storm stretching from Kansas to the Atlantic Ocean. NWS forecasters are reporting that they are camping out in their offices in order to ensure continuity of coverage so that the public they serve can remain safe and aware of these dangerous conditions.
Map of NWS alerts across the continental United States at 1352 UTC, including extreme cold warnings (royal blue), cold weather advisories (light blue), winter storm warnings (pink), and winter weather advisories (lavender). Map of surface conditions at 1200 UTC on 18 February 2025. From the NSF NCAR Research Applications Laboratory real-time surface weather page.
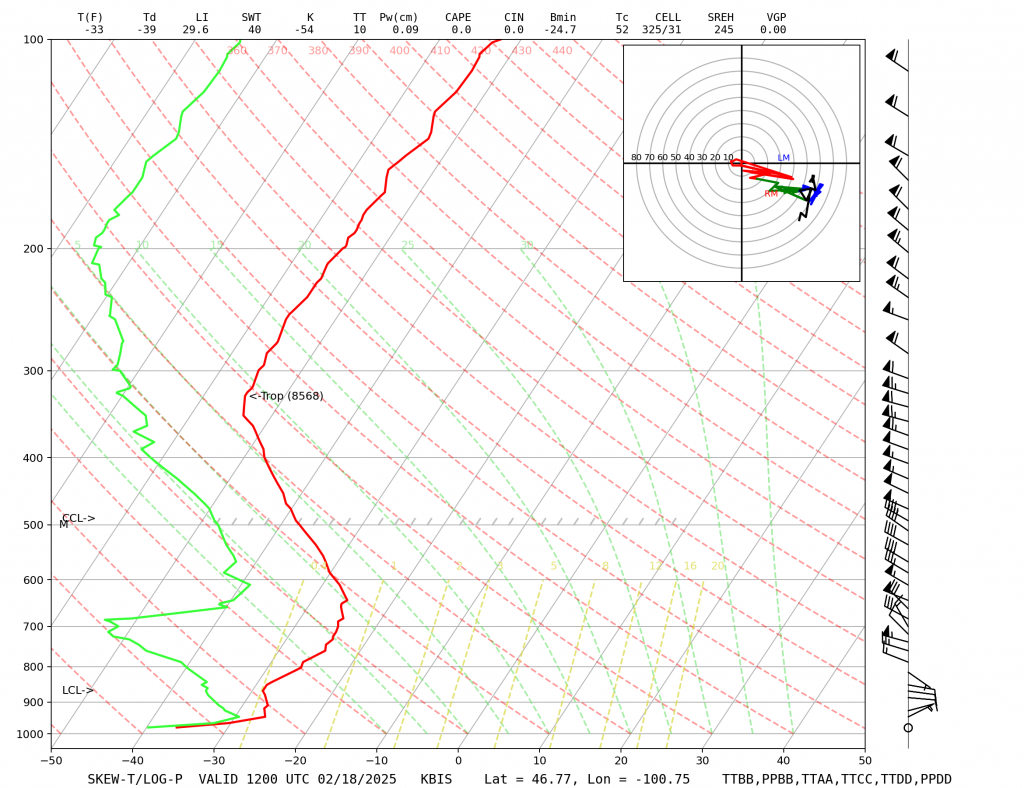
Overnight lows in the upper midwest were particularly cold, with temperatures below -30 F in parts of the Dakotas (the coldest minimum temperature was -45 F at Antelope Creek ND). These extremely cold temperatures are often associated with notable temperature inversions above the surface. As surface temperatures cool overnight, the strong infrared emissivity of snow enhances the radiative cooling. However, as air is a poor conductor of heat, temperatures aloft remain relatively unaffected. This is particularly clear in the 1200 UTC balloon launched from Bismarck, North Dakota. Note how the surface temperature (-36.3 C) is barely warmer than the temperature at 500 mb (-37.7 C). The sounding also notes that the lifting condensation level (LCL) of around 890 mb is substantially warmer than the surface.
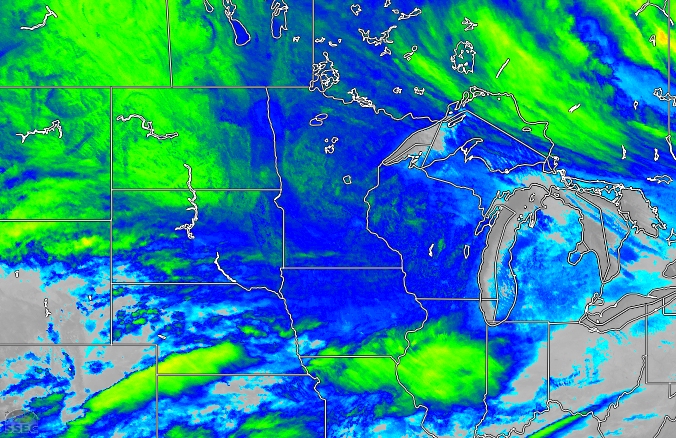
When cloud temperatures are the same or warmer than surface temperatures, it can be challenging to interpret infrared satellite imagery. For example, here is the GOES-16 ABI Band 13 image from 1150 UTC as displayed using the enhanced infrared color scale.
GOES-16 ABI Band 13 (10.4 microns) for 1150 UTC on 18 February 2025
Looking at the northern shore of Michigan’s upper peninsula and the western shore of the lower peninsula, it appears that the banded structures of lake effect snows are present in the shades of blues. Therefore it is reasonable to assume that a lake effect event is ongoing in that region of the image, but given that the temperatures of the clouds are basically the same as the underlying surface, it’s not obvious. But discerning what is happening in the Dakotas and Minnesota is far more difficult. Are there large stratiform clouds present, or are the surface temperatures so cold that they have cloud-like temperatures? This is where products like the night microphysics RGB can be very useful.
GOES-16 night microphysics RGB for the same time as the IR image above.
Normally, the noisy orange regions seen in the upper midwest and northern great plains indicate high, thick, very cold clouds. The speckles appear when brightness temperatures are less than -30 C due to noise in the 3.9 micron channel at extreme cold temperatures. However, there are clues in here that we’re actually looking at clear skies in those orange regions. Let’s zoom in on northern Minnesota.
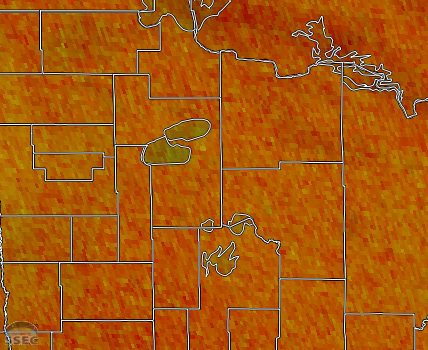
A zoomed in view of the previous map focused on northern Minnesota.
Here, it is clear that the lakes, most notably Upper and Lower Red Lake in the center of the image, are differently colored than the surrounding regions. The greener tinge is a result of reduced influence of the 12.4-10.4 micron difference and enhanced influence of the 10.4-3.9 micron difference. This likely is surface ice which means this region is clear. Therefore, the orange regions in the RGB product indicate that skies are basically clear in Minnesota and North Dakota, with some cloud coverage in southern and western South Dakota showing up as darker reds. The lake effect snows are much more clearly visible as yellow in the RGB compared to the IR image where they are basically the same temperature as the surface. Since the RBG recipe uses the 3.9 micron channel as an ingredient, this product shouldn’t be used for interpretation much after 1200 UTC this time of year as the sun is about to rise and solar reflectance at 3.9 will dominate over emission.
Overnight in the eastern Indian ocean, a tropical storm underwent significant deepening to become Severe Tropical Cyclone Zelia. The name “tropical cyclone” might make one think of a comparatively weak storm compared to a hurricane, but that is because the names of these systems vary depending on the part of... Read More
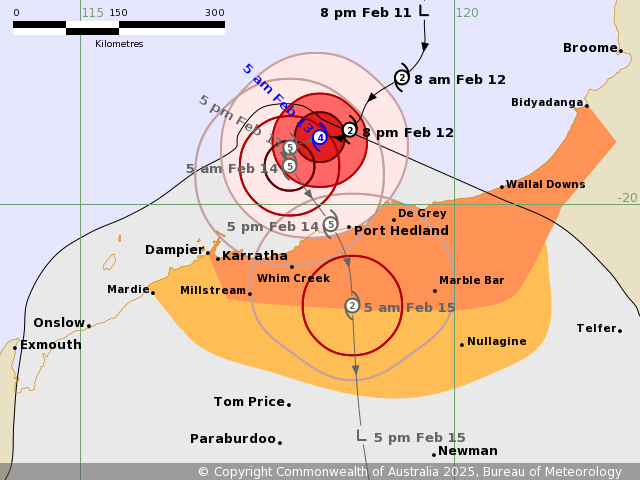
Overnight in the eastern Indian ocean, a tropical storm underwent significant deepening to become Severe Tropical Cyclone Zelia. The name “tropical cyclone” might make one think of a comparatively weak storm compared to a hurricane, but that is because the names of these systems vary depending on the part of the world they take place. There’s no functional different between a hurricane, typhoon, or severe tropical cyclone, just a different ocean basin where they can be found. The category rankings are the same for all tropical cyclones, and as of sunrise on 13 February, it had become a Catergory 4 storm, with winds over 209 km/h (130 mph). Forecasts from the Australian Bureau of Meteorology indicate that it will continue to strengthen to a Category 5 system before taking a sharp left hand turn and heading south. Zelia is currently lashing the coast with winds and rain as it strengthens, and because of some locations will be under this system for many hours, some rainfall forecasts are in excess of 50 cm (20 inches).
Track forecast for Severe Tropical Cyclone Zelia from the Australian Bureau of Meteorology (BOM).
The rapid development of an eye can be seen in the following loop of Band 13 (10.4 microns, the infrared window) from the Advanced Himawari Imager (AHI) aboard Japan’s Himawari-9 geostationary satellite, . Because this eye development took place in the nighttime hours, visible-wavelength imagery cannot be used to observe this process. Longtime viewers of tropical cyclone imagery might be slightly started to see Zelia spinning in a clockwise direction, but that’s expected for a Southern Hemisphere cyclone.
Himawari-9 Band 13 view of Severe Tropical Cyclone Zelia
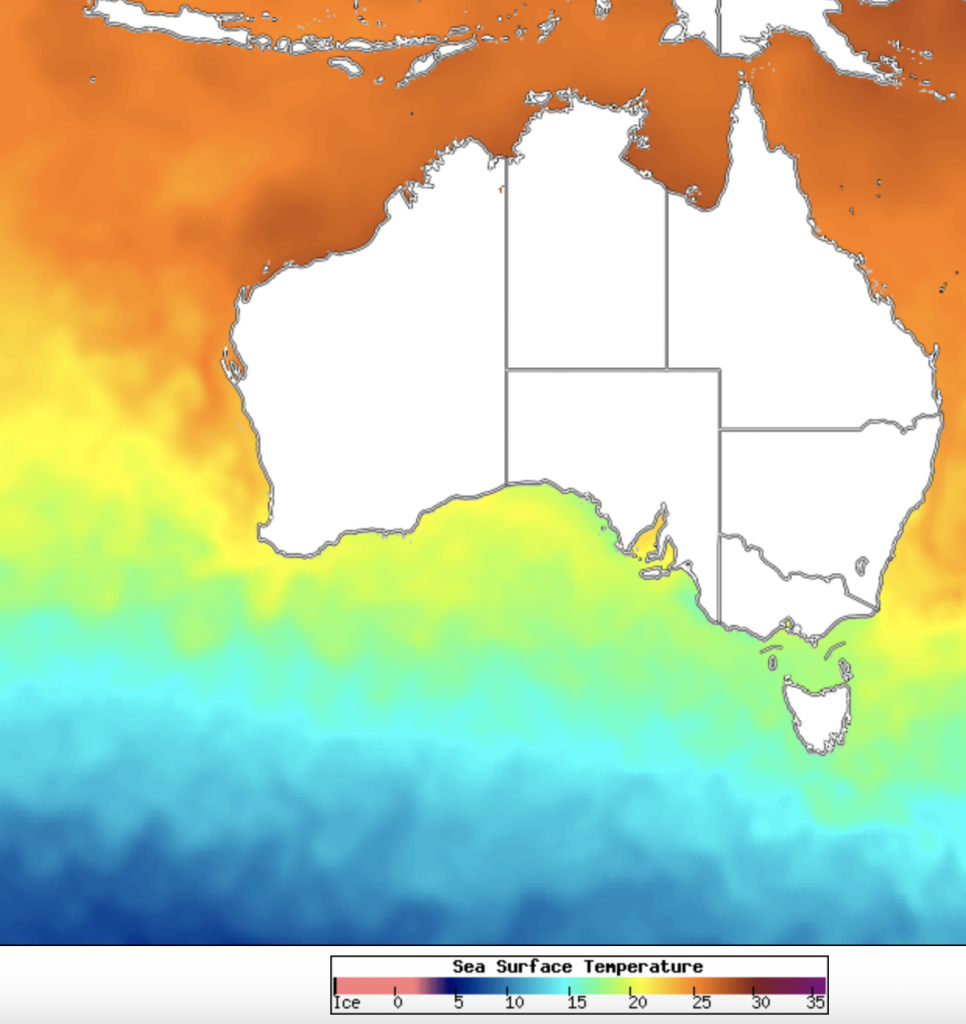
This strong intensification is not unexpected given the extremely warm sea surface temperatures found just northwest of Australia. The NESDIS High Resolution Sea Surface Temperature analysis (available from SSEC’s Real Earth) shows temperatures at or above 25 C (over 77 F), which contribute substantially to the latent heat processes needed for tropical cyclone development and maintenance.
For the latest updates, be sure to check the BOM’s Tropical Cyclone website.
===== 14 February Update =====
2.5-minute Himawari-9 Visible (0.64 µm, left) and Infrared (10.4 µm, right) images, from 2212 UTC on 13 February to 0502 UTC on 14 February (courtesy Scott Bachmeier, CIMSS) [click to play animated GIF | MP4]
2.5-minute Target Sector JMA Himawari-9 Visible and Infrared images (above) showed that Zelia made landfall along the coast of Western Australia (near Port Hedland) not long before 0500 UTC on 14 February. Cloud-top infrared brightness temperatures in the eyewall region were in the -80 to -85ºC range (shades of violet to purple).
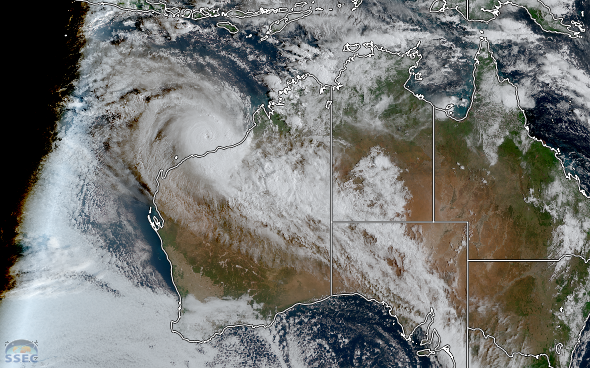
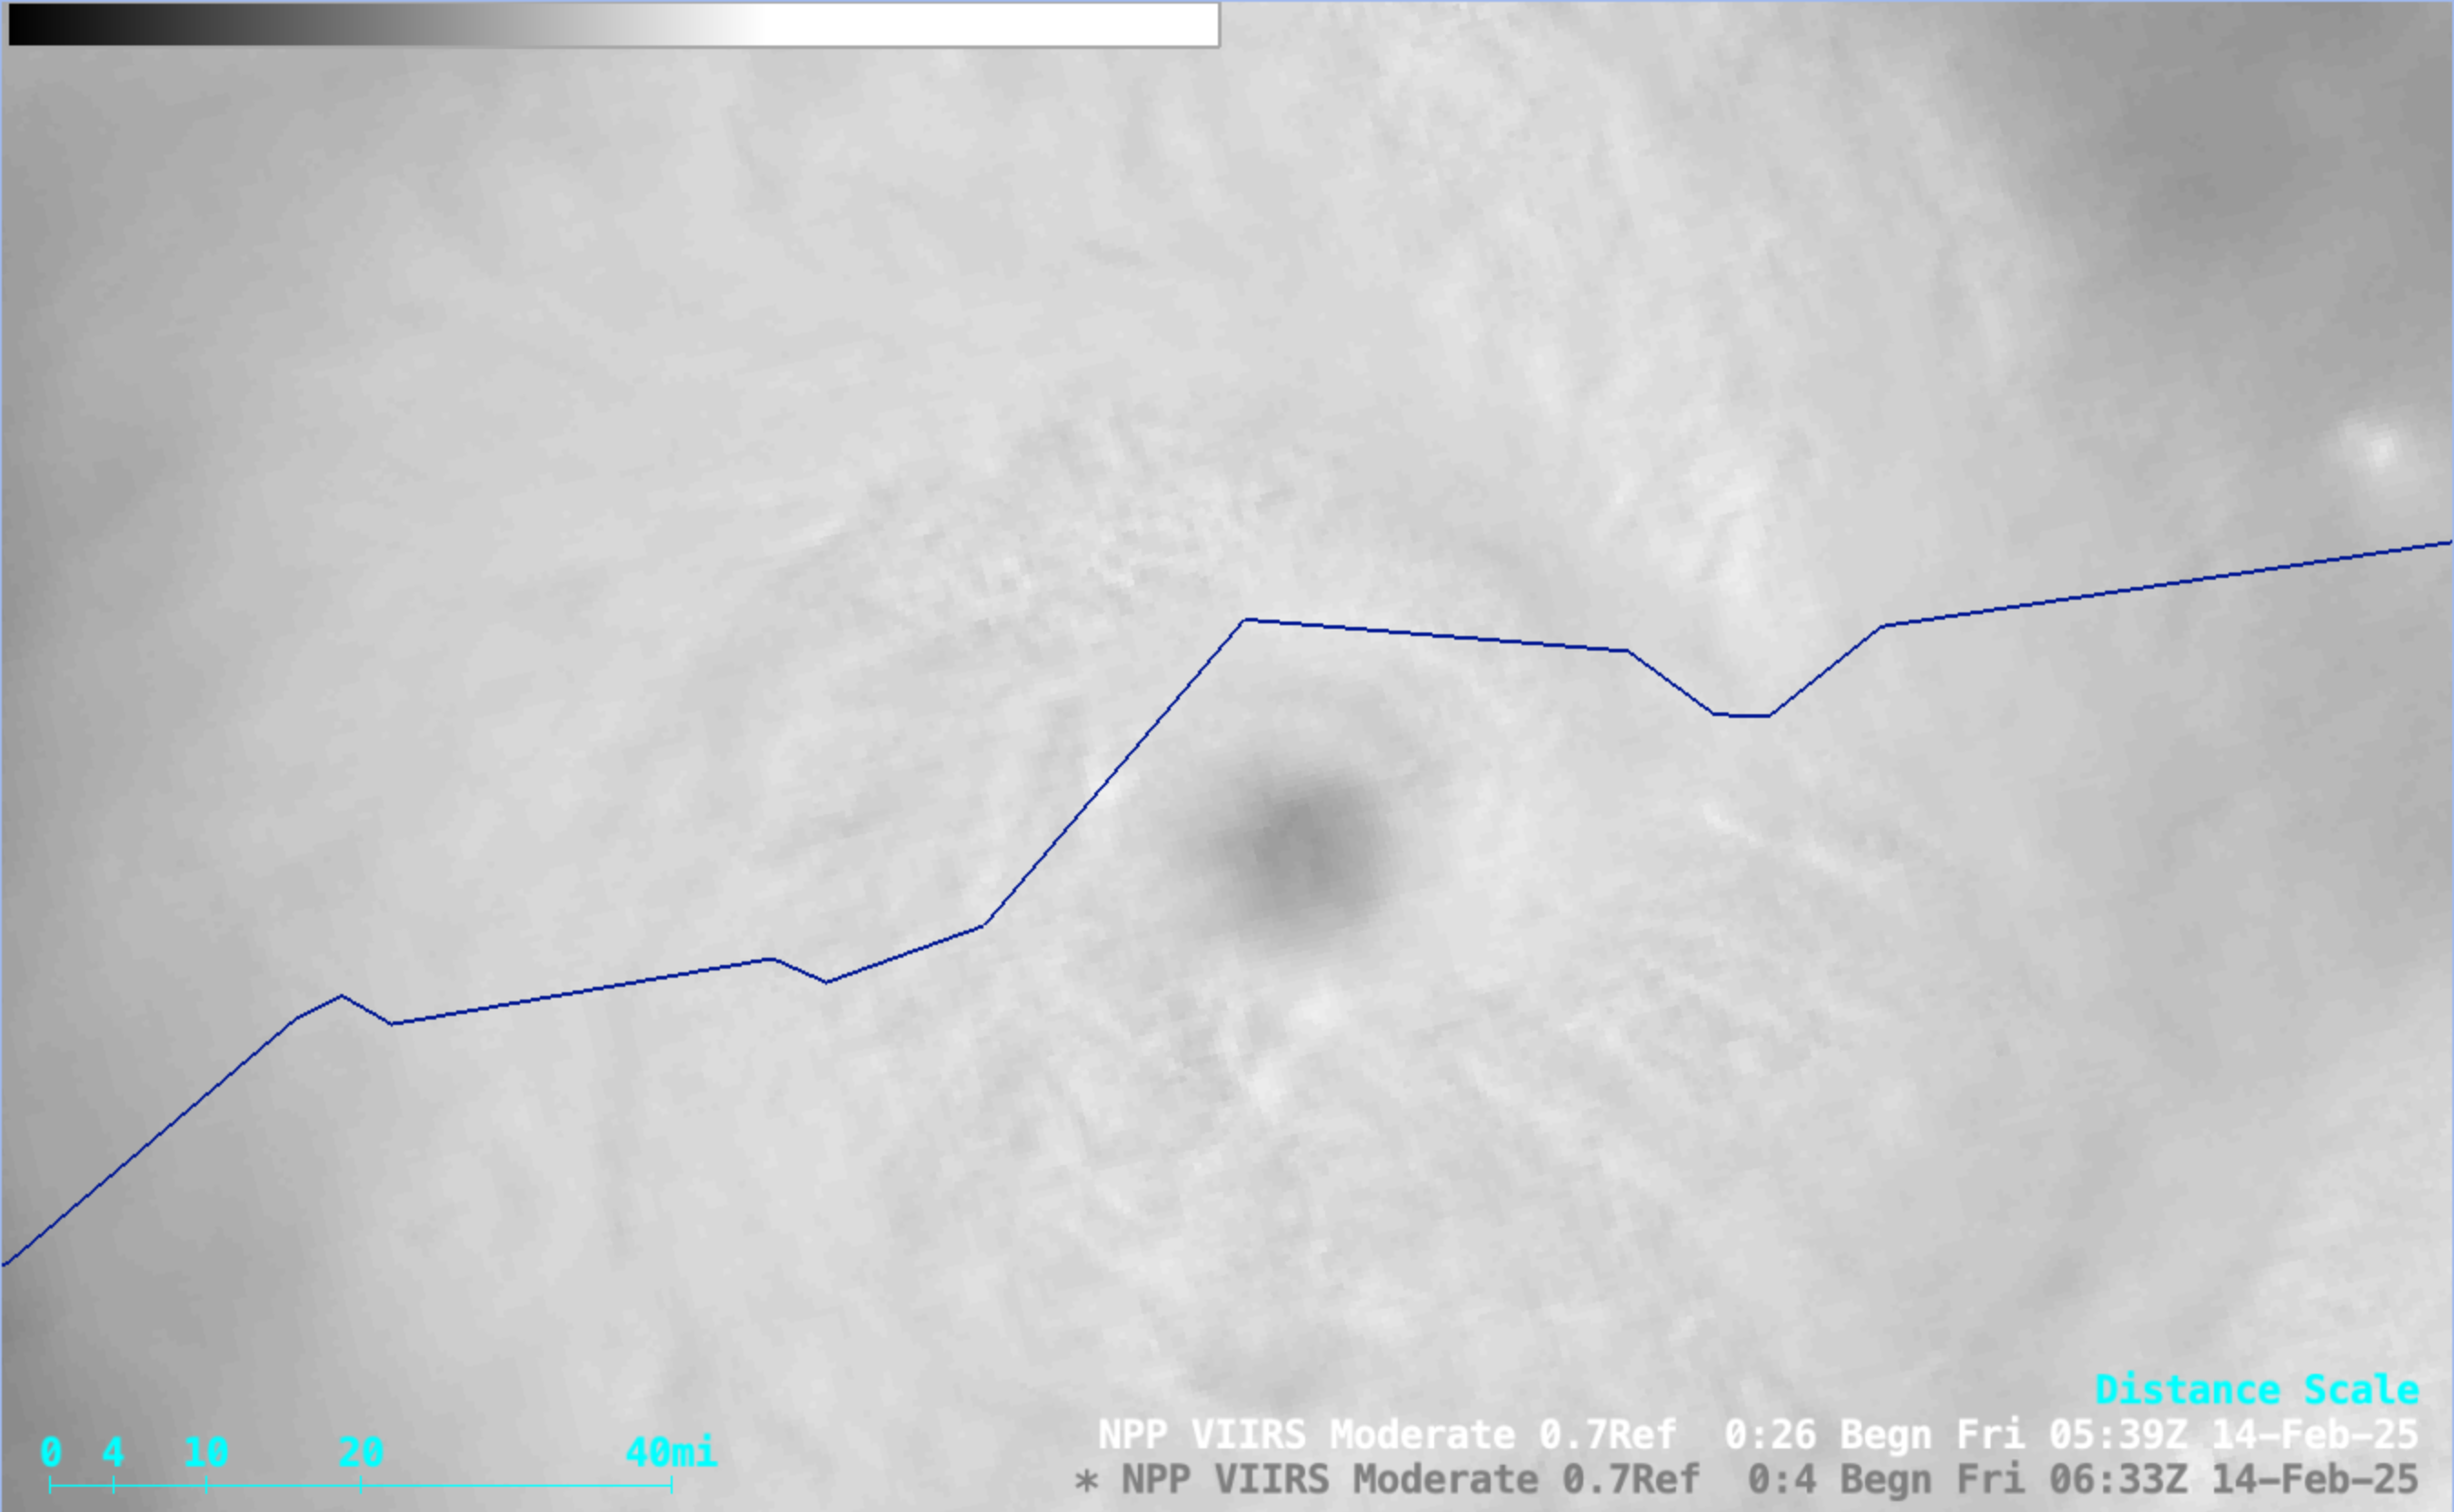
A Suomi-NPP VIIRS Day/Night Band image (below) provided a high resolution view of the cloud-filled eye of Zelia, shortly after the tropical cyclone made landfall.
Suomi-NPP VIIRS Day/Night Band (0.7 µm) image, valid at 0524 UTC on 14 February (courtesy Scott Bachmeier, CIMSS) [click to enlarge]
In a ~2 day animation of 2.5-minute Himawari-9 Infrared images (below), it was apparent that Zelia remained generally quasi-stationary for an extended period on 12-13 February — and as mentioned in a Joint Typhoon Warning Center discussion, this led to a wind-induced upwelling of cooler sub-surface water beneath the Category 4 intensity tropical cyclone (which likely played a role in reducing further intensification). The images include surface plots from Port Hedland (YPPD), which reported a wind gust of 65 knots at 0700 UTC. Also of note: during much of the day on 12 February, thunderstorms moving inland across the Port Hedland region exhibited cloud-top infrared brightness temperatures as cold as -90 to -95ºC (shades of yellow to gray, embedded within darker purple areas) — these thunderstorms were producing periods of heavy rain (YPPD METARs).
2.5-minute Himawari-9 Infrared (10.4 µm) images, from 1502 UTC on 12 February to 0702 UTC on 14 February (courtesy Scott Bachmeier, CIMSS) [click to play animated GIF | MP4]


