
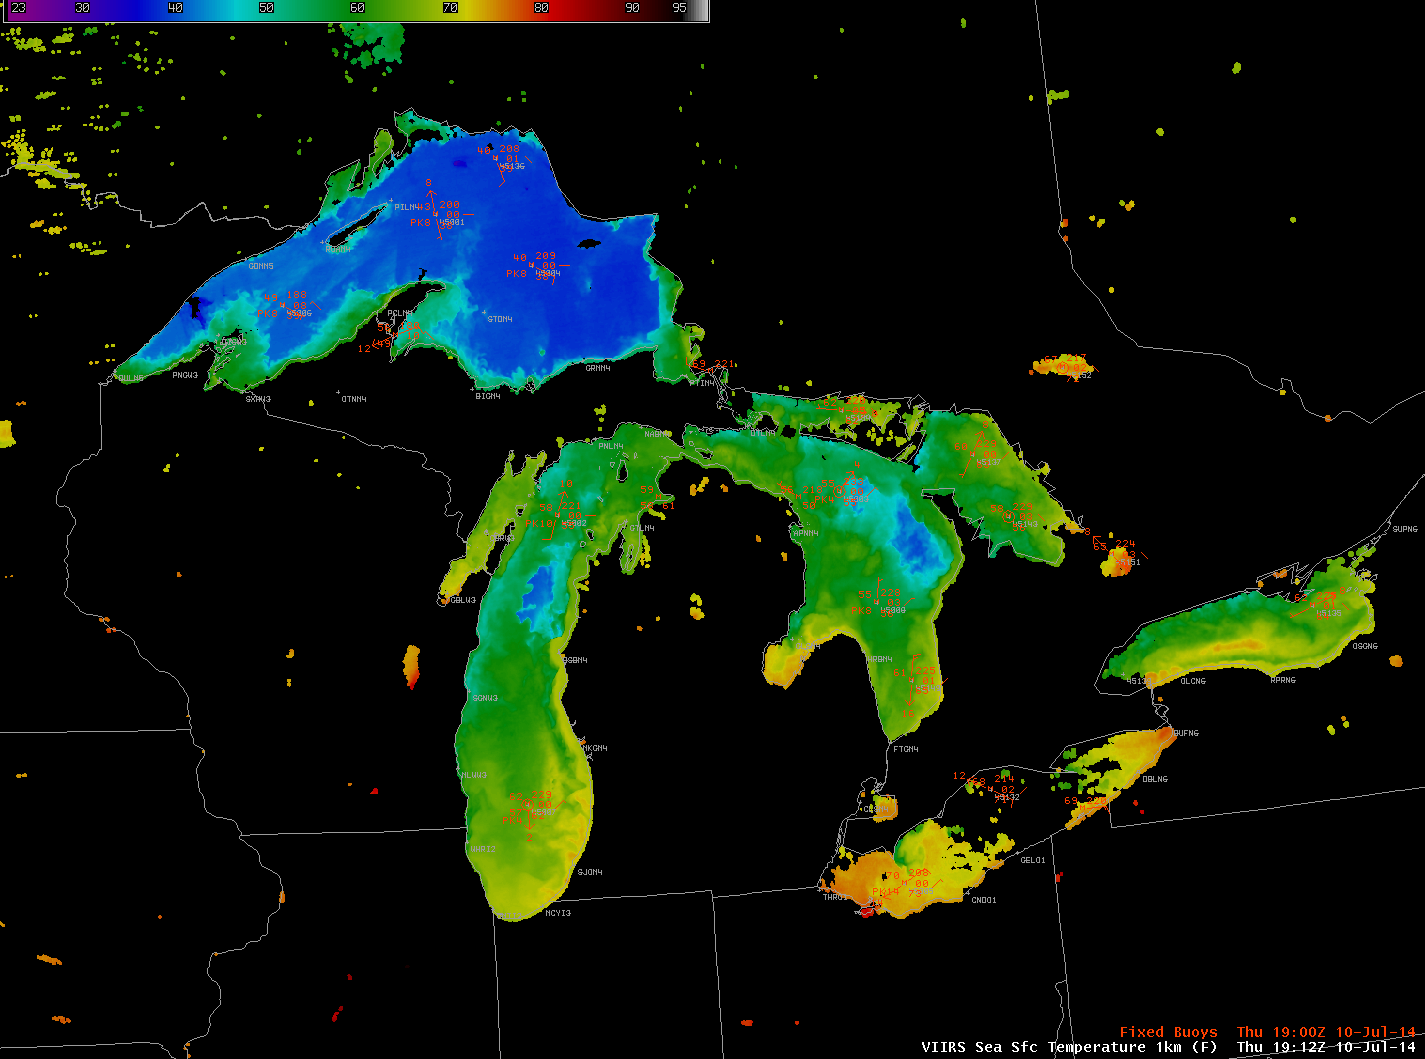
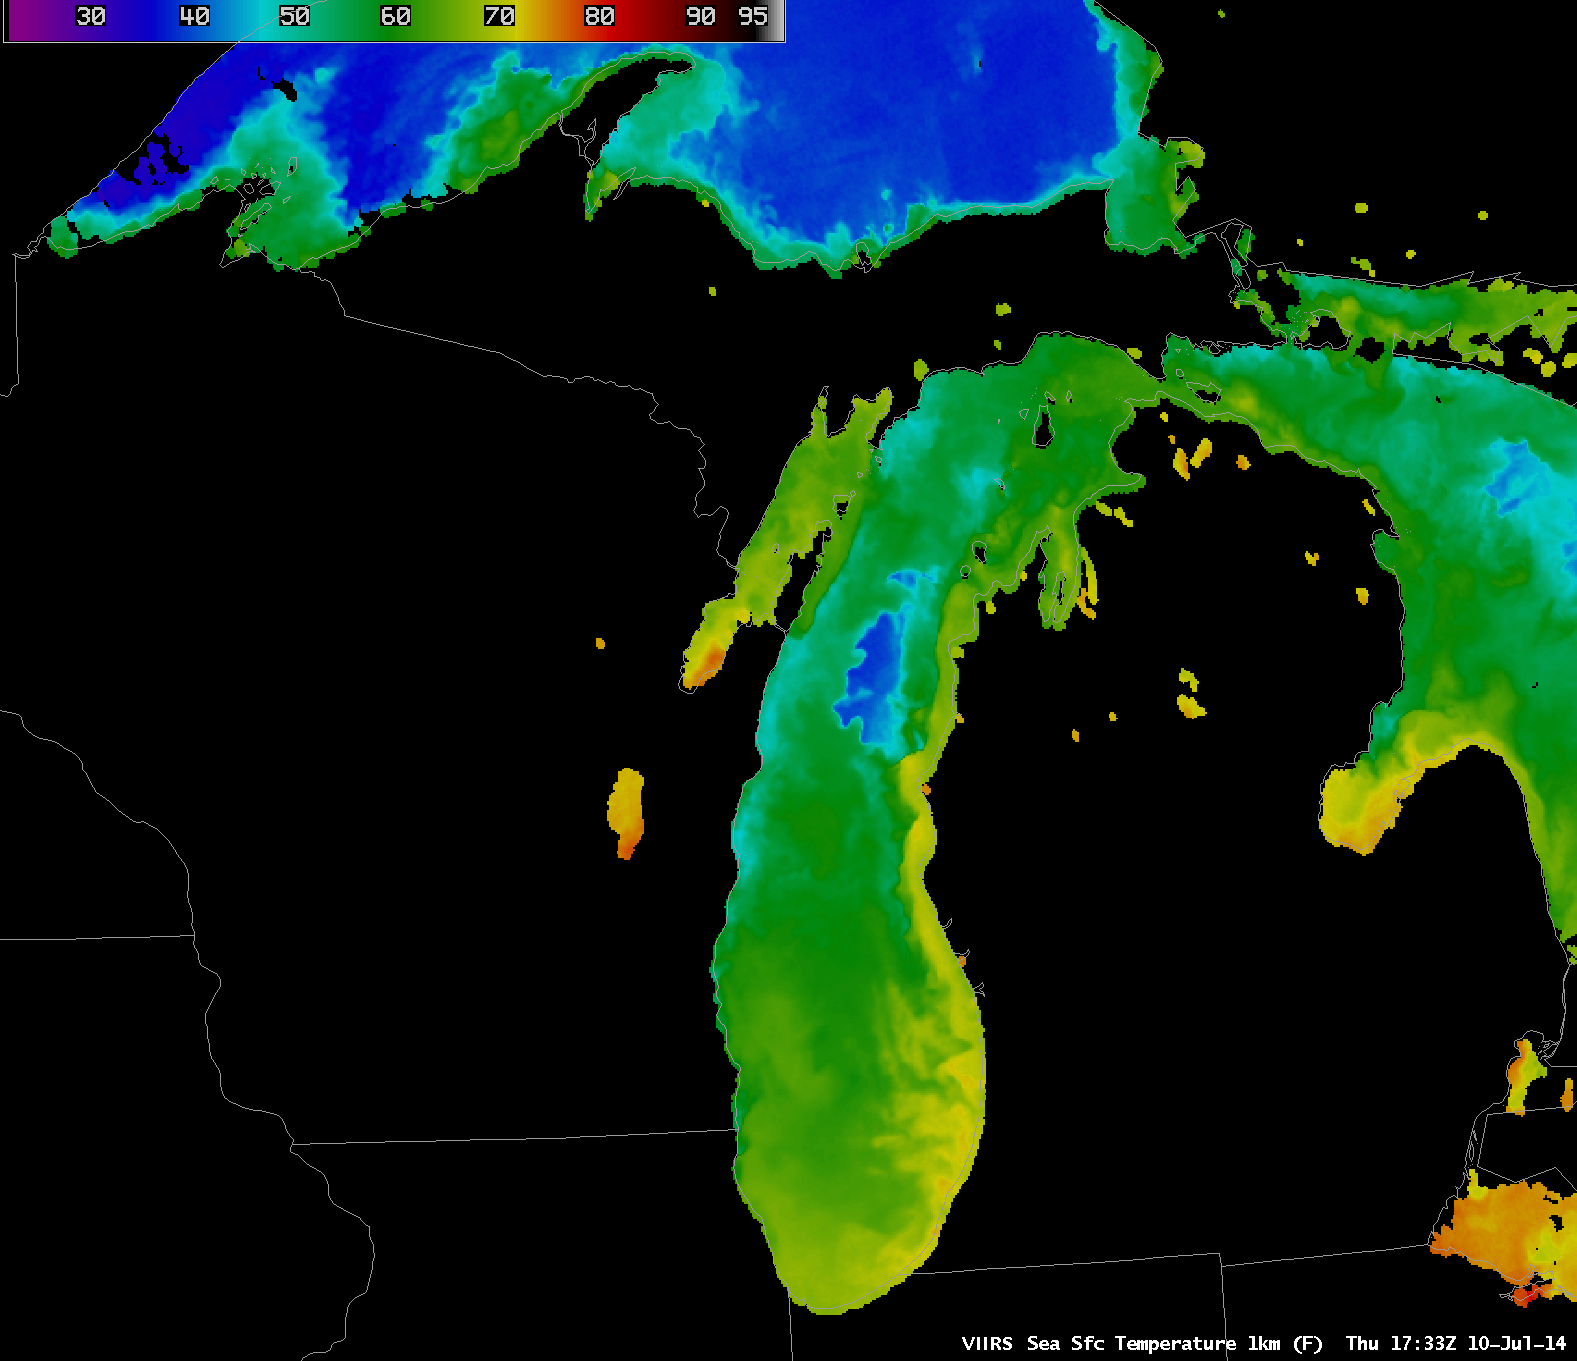
Suomi NPP VIIRS Sea Surface Temperature product over the Great Lakes, with bouy data, ~1900 UTC 10 July 2014
Favorable orbital geometry of the Suomi NPP satellite and mostly clear skies over the Great Lakes basin allowed for a nearly complete picture of Great Lakes water temperatures from VIIRS on 10 July (in fact, all Great Lakes were viewed on two successive orbits). As has been noted elsewhere, lake water temperatures are running significantly below normal: pockets of surface water in the 30s F (darker blue color enhancement) persist in Lakes Michigan and Lake Huron, and much of Lake Superior still has surface water temperatures in the 30s to near 40°F.
Over the Lake Michigan area, high pressure with light winds in tandem with the thermal contrast between the cold waters (closer view) and the rapidly-warming land surfaces led to the generation of a well-defined lake breeze, which could be seen on GOES-13 0.63 µm visible channel images (below; click image to play animation; also available as an MP4 movie file). Early in the animation, note the formation of a thin patch of fog/stratus over the area of colder waters in northern Lake Michigan, as southeasterly/southerly winds advected warmer air over the cold water (MODIS visible/SST image comparison). The haziness seen moving over the western portion of Lake Michigan at the end of the animation is smoke transported from wildfires in northwestern Canada (Terra MODIS AOD and trajectories)
GOES-13 0.63 µm visible channel images (click to play animation)
View only this post Read Less

![GOES-15 (top) and GOES-13 (bottom) 0.63 µm visible channel images [click to play animation]](https://cimss.ssec.wisc.edu/satellite-blog/wp-content/uploads/sites/5/2014/07/140708_goes15_goes13_visible_canadian_smoke_anim.gif)


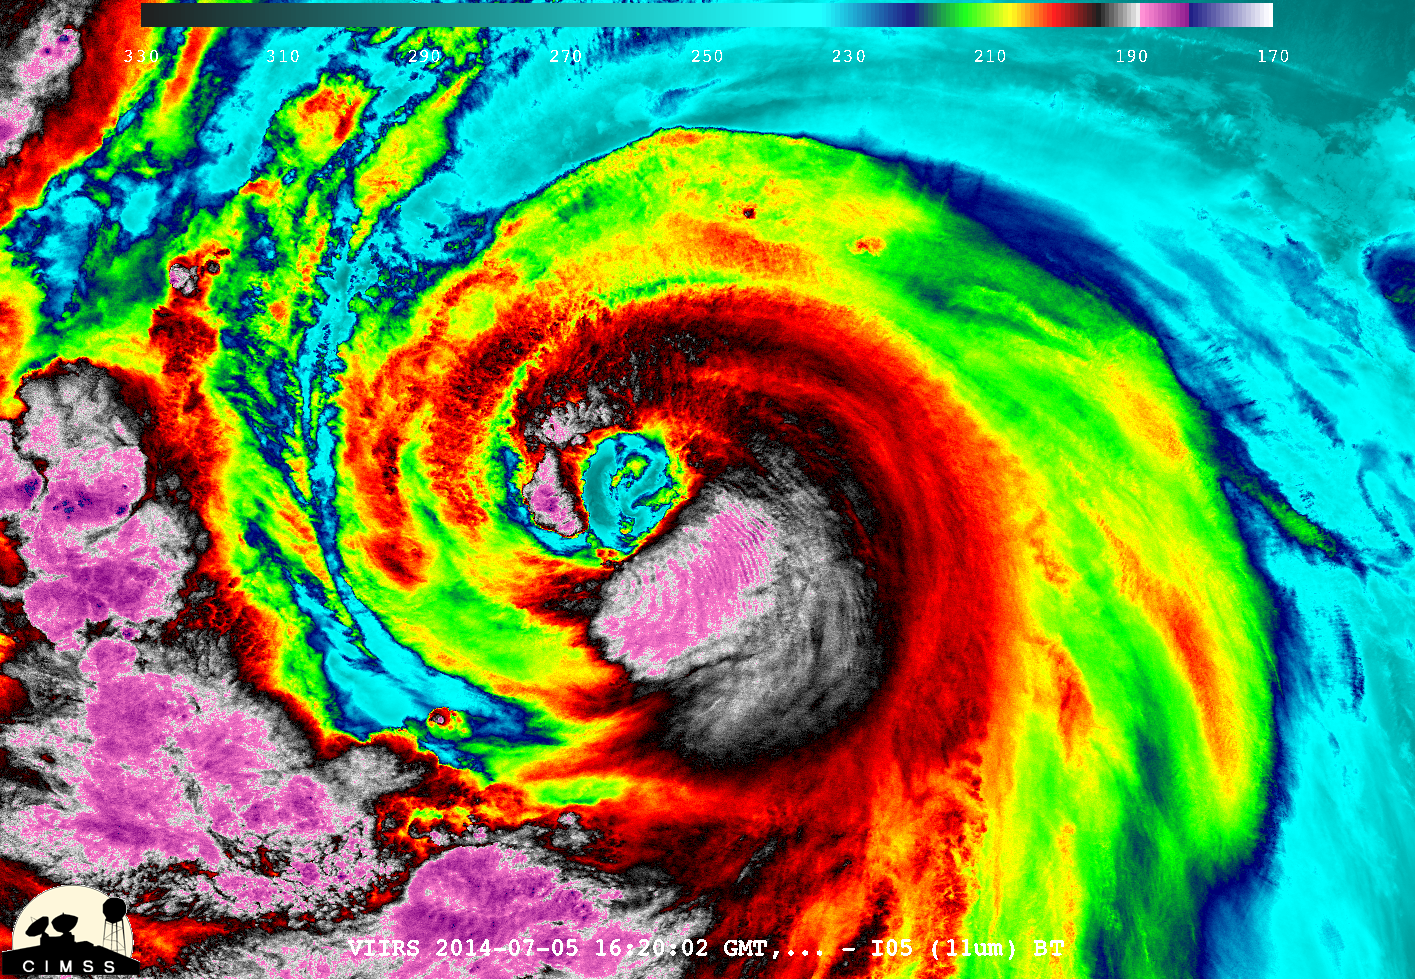
![COMS-1 (left) and MTSAT-2 (right) visible channel images [click to play animation]](https://cimss.ssec.wisc.edu/satellite-blog/wp-content/uploads/sites/5/2014/07/140706-07_coms_mtsat_visible_neoguri_eye_anim.gif)
