")
GOES-13 0.63 µm visible channel images (click image to play animation)
AWIPS images of 1-km resolution GOES-13 0.63 µm visible channel data (above; click image to play animation) showed an undular bore marking a surface-based convective outflow boundary which formed over southwestern Nebraska early in the day on 31 July 2013 — this outflow boundary then propagated southwestward during the day and acted as a focus for the formation of severe thunderstorms over southwestern Kansas later that afternoon (SPC storm reports).
The southwestward-propagating outflow boundary / undular bore feature was also seen on 4-km resolution GOES-13 6.5 µm water vapor channel imagery (below; click image to play animation).
")
GOES-13 6.5 µm water vapor channel images (click image to play animation)
The GOES-13 imager 6.5 µm water vapor channel weighting function calculated using the 12 UTC rawinsonde data from Dodge City, Kansas (below) indicated that the weighting function peaked much lower in the atmosphere (around 500 hpa) than normal — this allowed a thermal signal (albeit a faint one) of the boundary layer convective outflow boundary cloud features to be seen on the water vapor imagery.
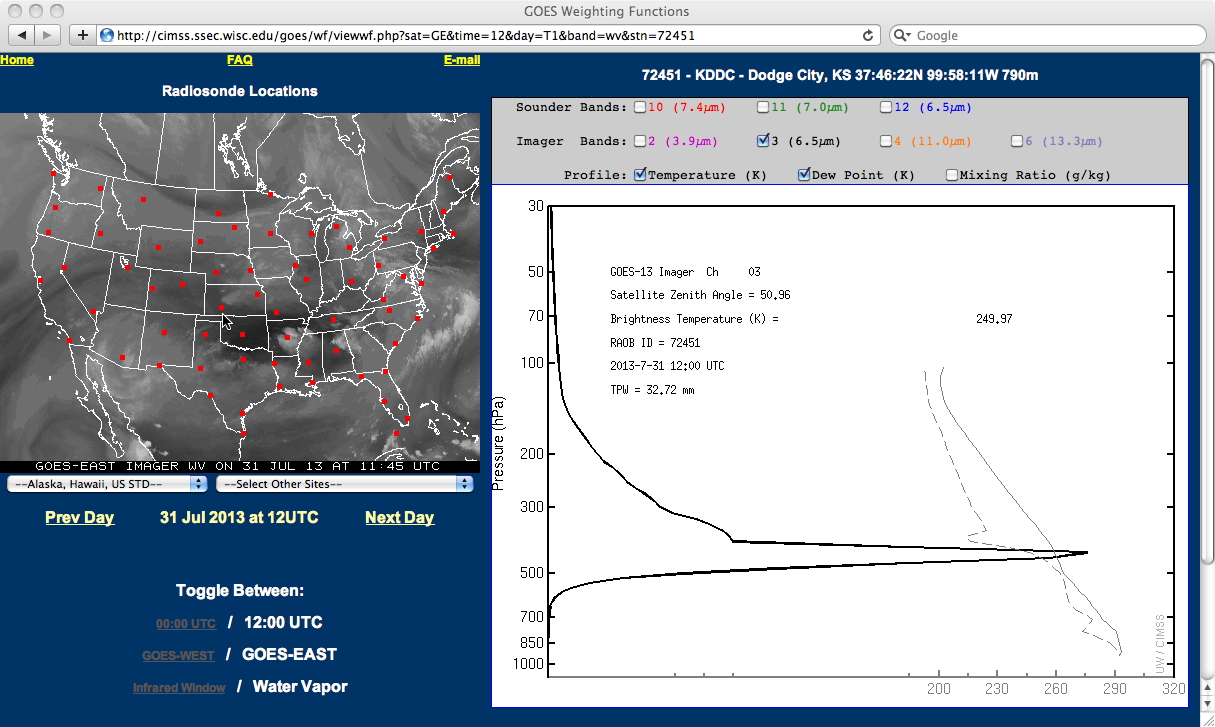
GOES-13 water vapor channel weighting function plot (using Dodge City, Kansas rawinsonde data)
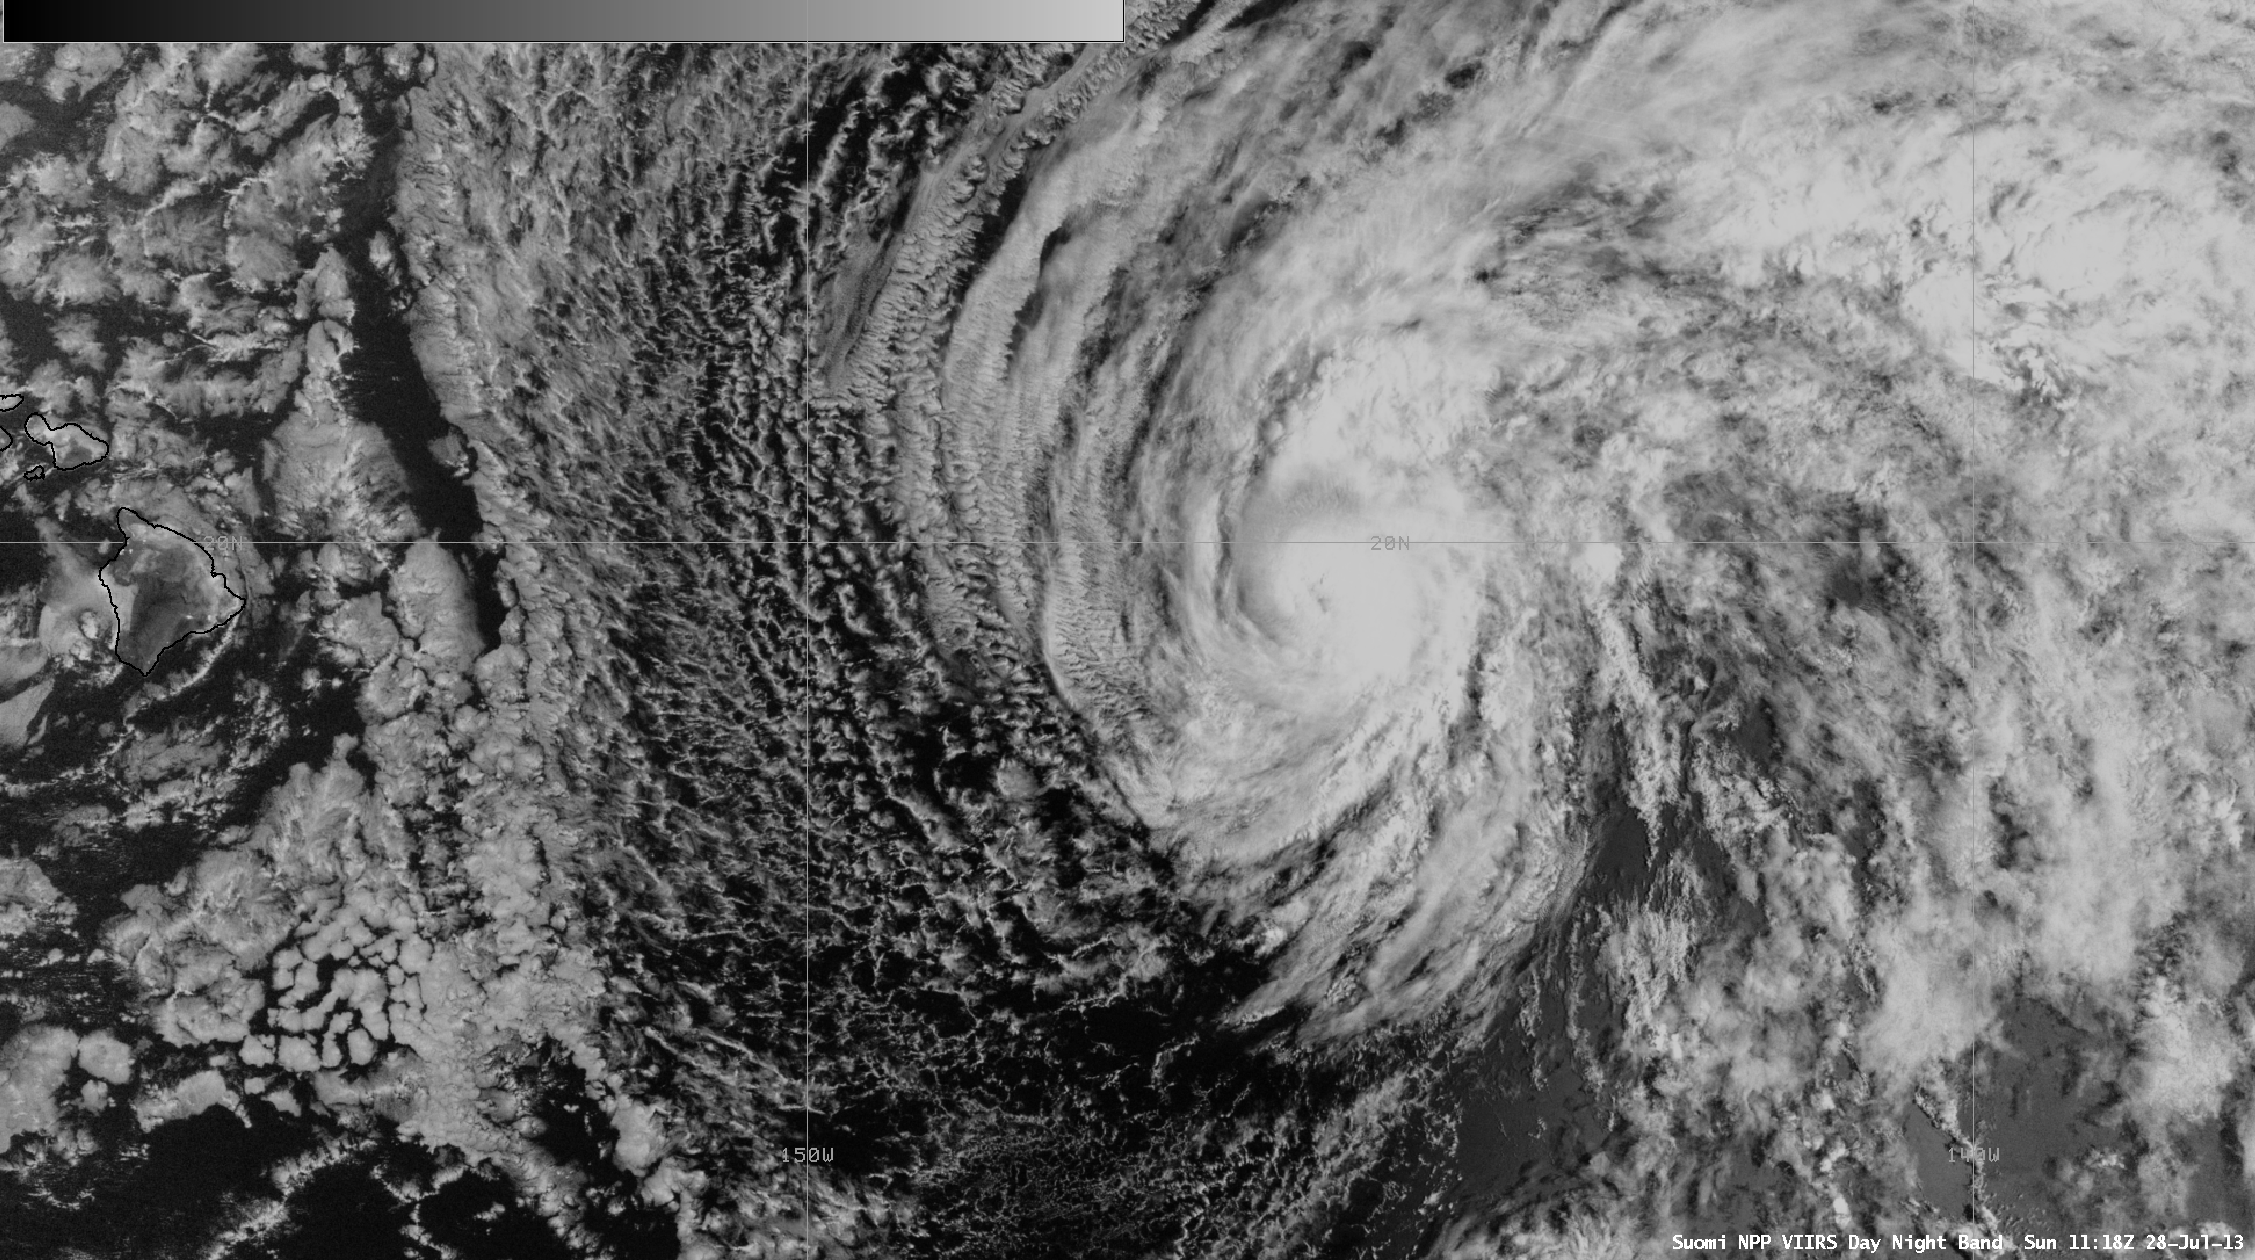
A good view of the undular bore (which was trailing the leading edge of the convective outflow boundary) could be seen on a comparison of 1-km resolution MODIS 0.64 µm visible channel and 11.0 µm IR channel images at 17:05 UTC (below).

MODIS 0.64 µm visible channel and 11.0 µm IR channel images
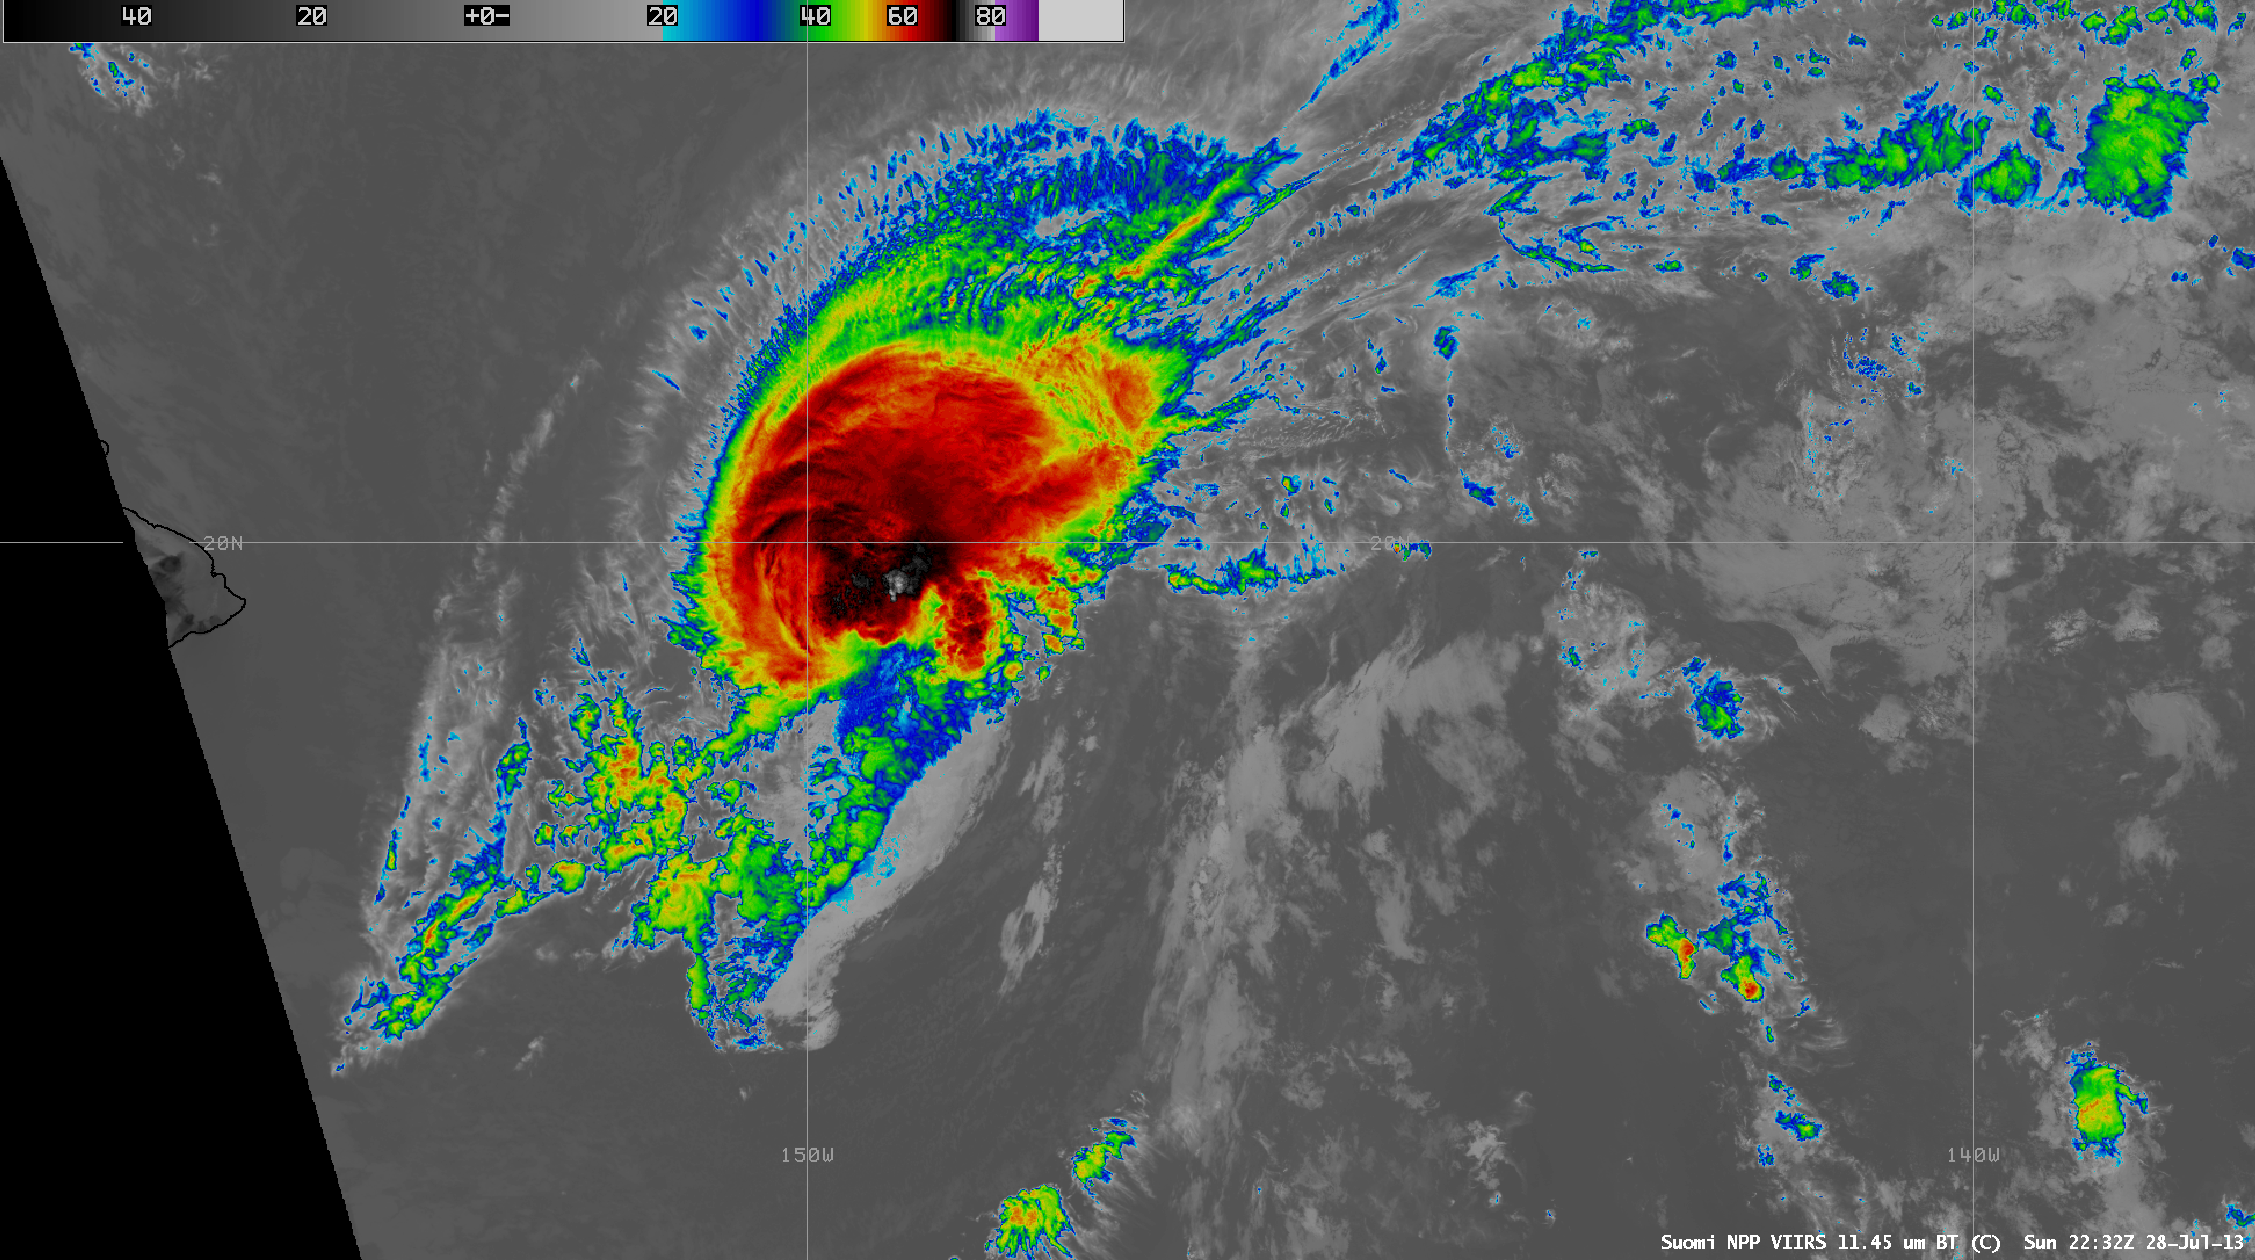
New thunderstorms formed along the old convective outflow boundary (as it encountered increasing instability across southwestern Kansas during the afternoon hours), as seen on 1-km resolution Suomi NPP VIIRS 0.64 µm visible channel and 11.45 µm IR channel images (below). This storm was producing 1-inch diameter hail and wind gusts of 50-60 mph.

Suomi NPP VIIRS 0.64 µm visible channel and 11.45 µm IR channel mages, with SPC reports of hail
A comparison of the 1-km resolution Suomi NPP VIIRS 11.45 µm IR channel image with the corresponding 4-km resolution GOES-13 10.7 µm IR channel image (below) displayed an unusually large 30-degree difference between the coldest cloud-top IR brightness temperatures of the northernmost of the newly-formed thunderstorms in Kansas (-92º C on VIIRS, vs -62º C on GOES).

VIIRS 11.45 µm IR channel and GOES-13 10.7 µm IR channel images
View only this post Read Less
")
 (Click Image to play animation)")
 (3x3 Field of View) (Click Image to play animation)")
 (Click Image to play animation)")
")
")


")


 and GOES-12 (right) visible imagery")
 and GOES-12 (right) 10.7 µm imagery")


