This website works best with a newer web browser such as Chrome, Firefox, Safari or Microsoft
Edge. Internet Explorer is not supported by this website.
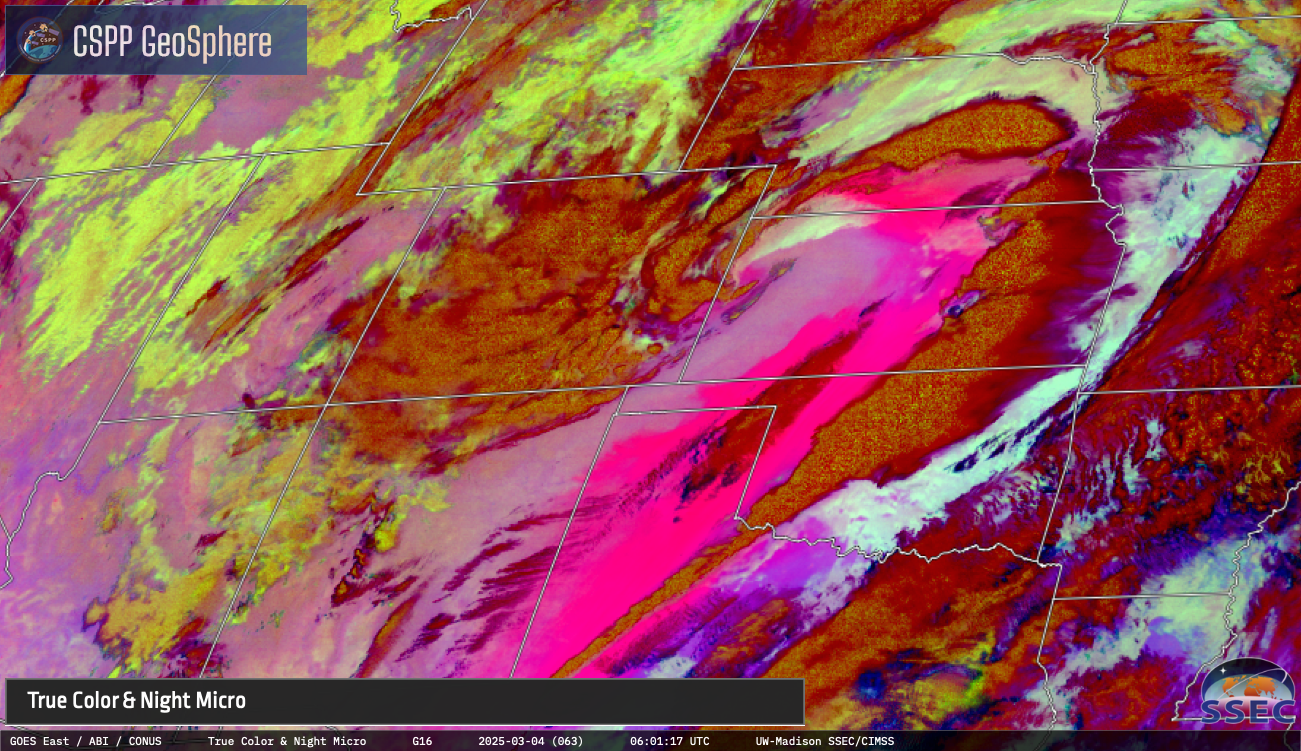
CSPP Geosphere imagery on 5 March, above, (direct link to imagery), shows the development of a smoke plume from a fire at the north end of San Jose Island. When did the Next Generation Fire System first identify the fire that caused the smoke plume? The NGFS Alerts Dashboard, below, shows a detection... Read More
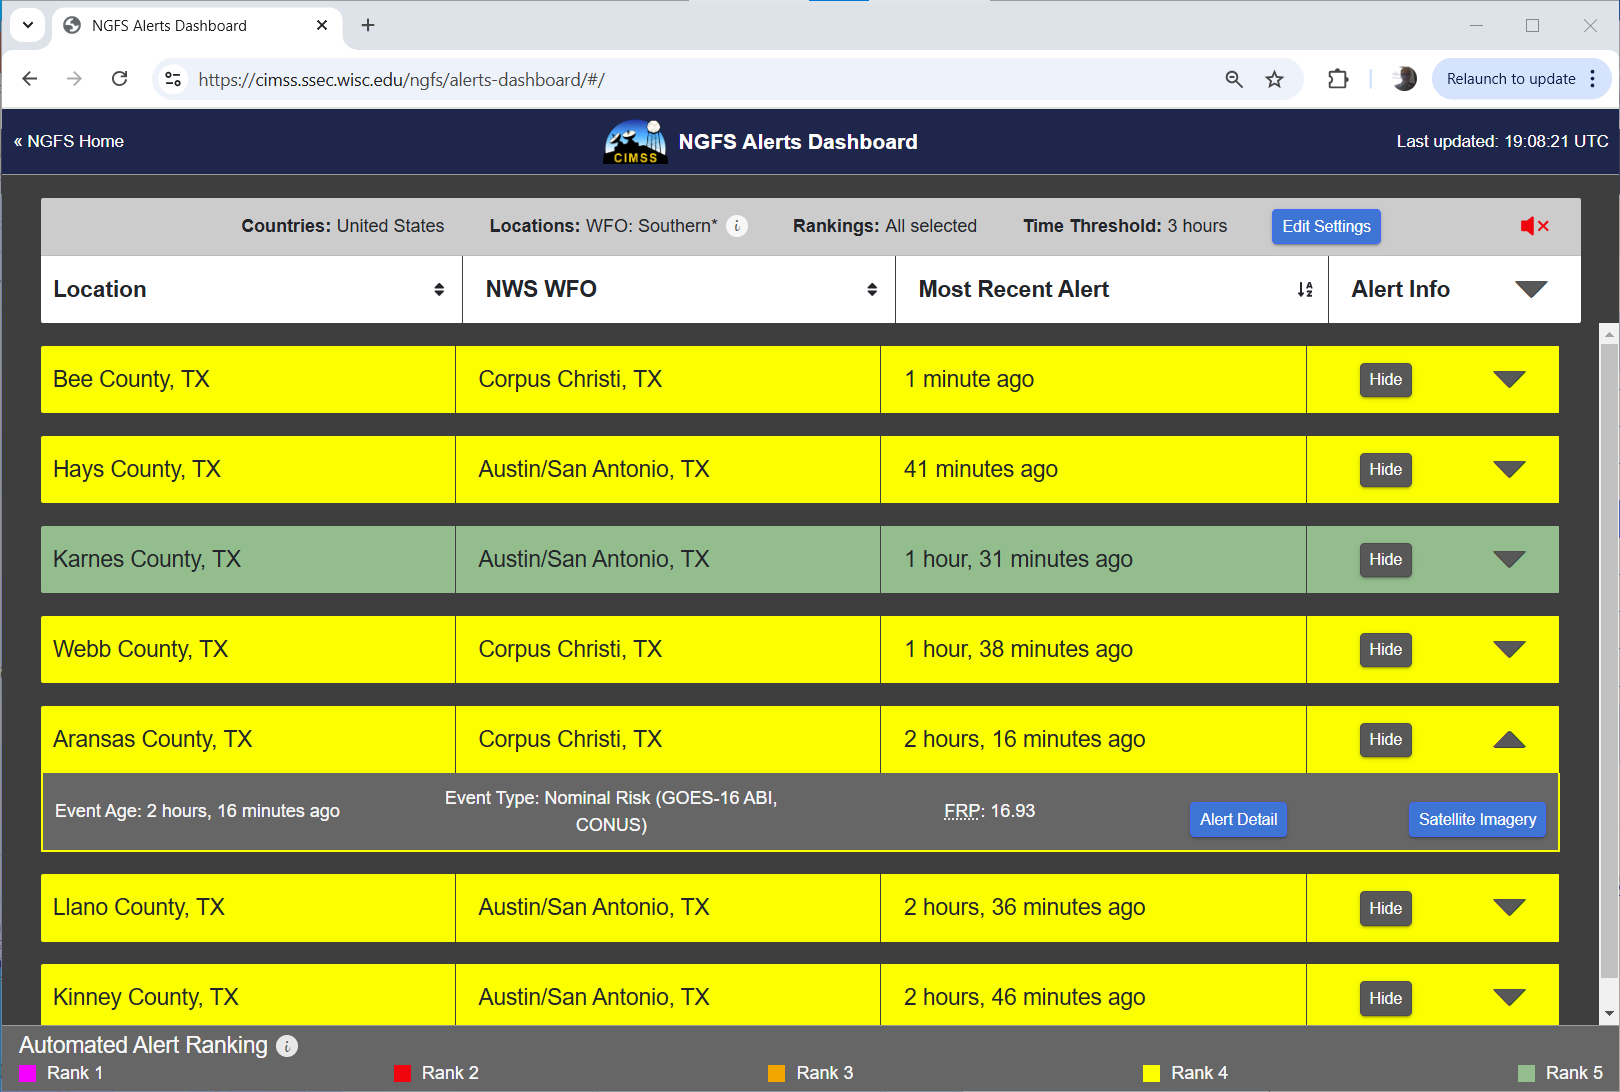
CSPP Geosphere imagery on 5 March, above, (direct link to imagery), shows the development of a smoke plume from a fire at the north end of San Jose Island. When did the Next Generation Fire System first identify the fire that caused the smoke plume? The NGFS Alerts Dashboard, below, shows a detection over Aransas County.
NGFS Alerts Dashboard at 1908 UTC on 5 March 2024 (Click to enlarge); note that only CONUS scanning is shown for the Aransas County detection because Mesosectors were viewing elsewhere
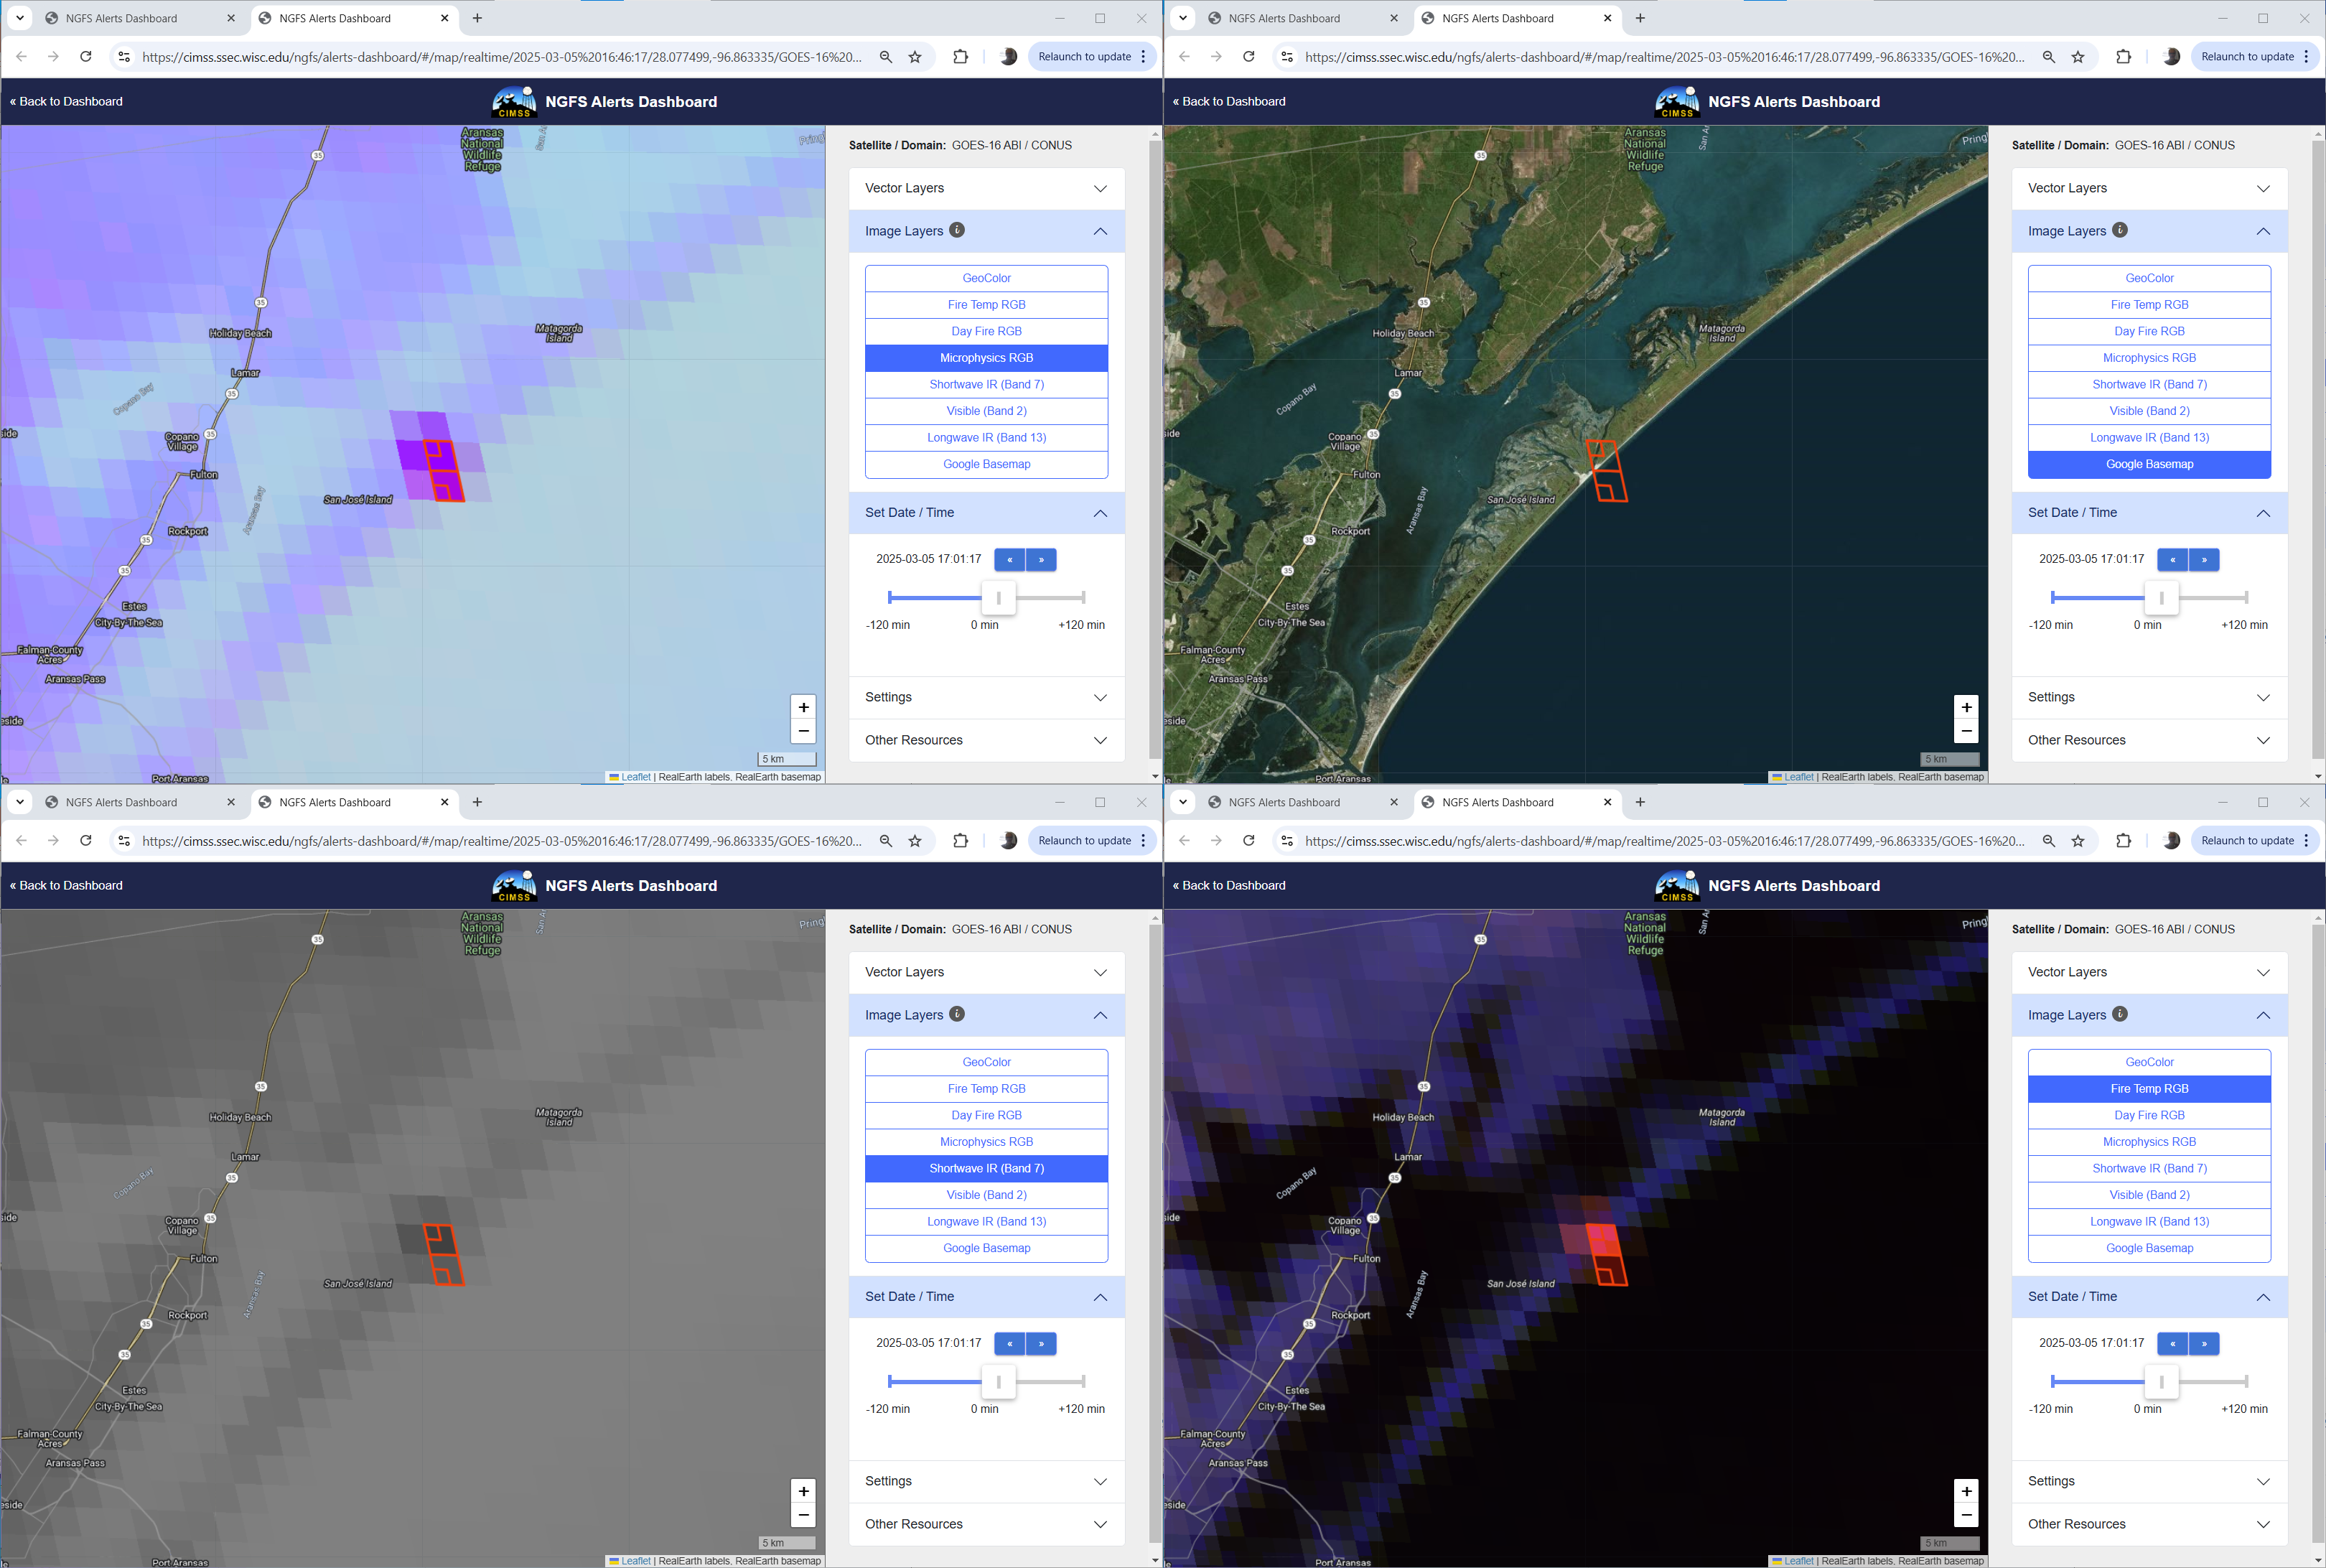
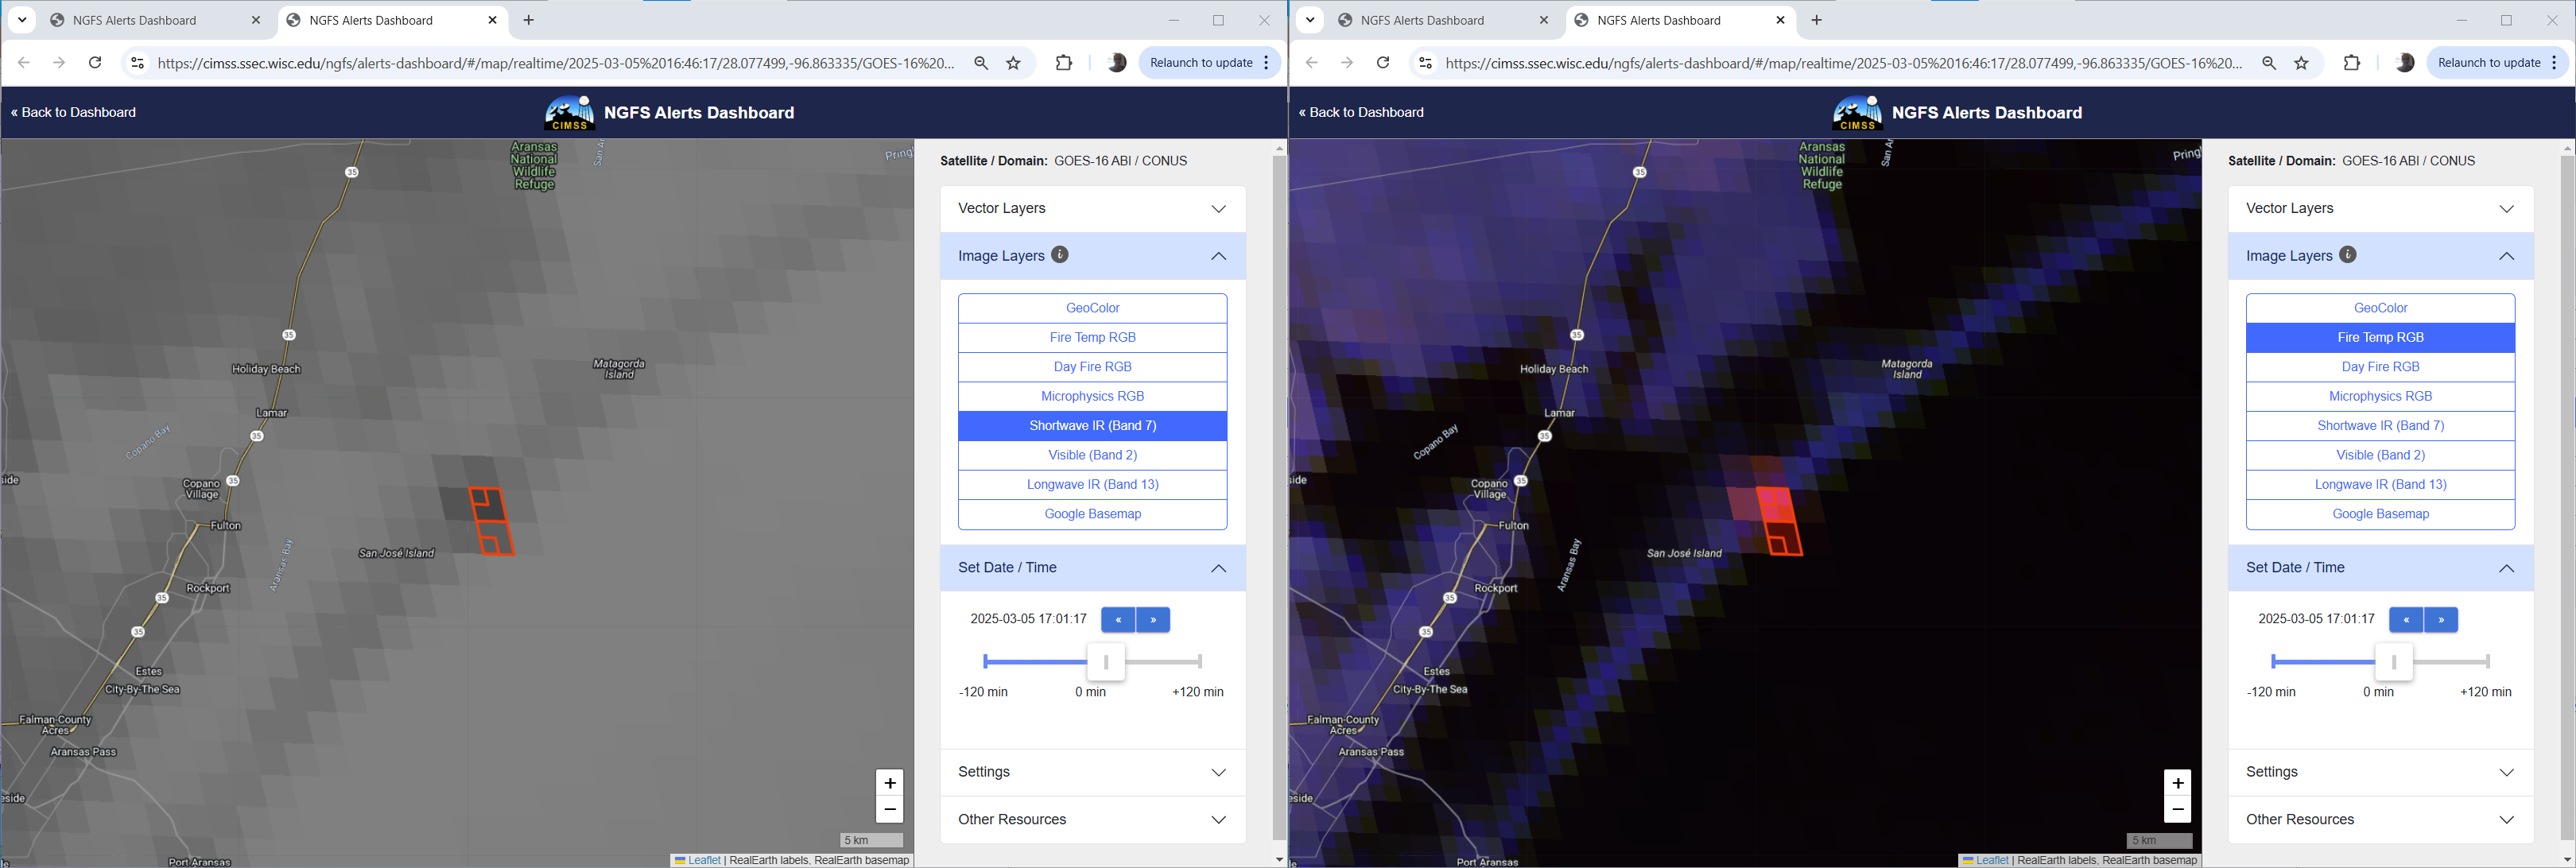
What did those CONUS (every five minute) detections show?The animation below shows NGFS Microphysics, Fire Temperature RGB and Band 7 (Shortwave infrared, 3.9 µm) imagery from GOES-16. The NGFS detection occurred at 1646 UTC. The fire develops quickly and the Fire Temperature RGB and Band 7 imagery show a very obvious fire signal by 1701 UTC.
GOES-16 NGFS Microphysics RGB (upper left), Google Map (upper right), GOES-16 Band 7 Shortwave Infrared (3.9 µm, lower left) and GOES-16 Fire Temperature RGB (lower right), 1636-1701 UTC on 5 March 2025 (Click to enlarge)
NGFS detections also occur with VIIRS imagery that has much greater spatial resolution, as fine as 375m for some infrared (and visible) channels. The NOAA-21 overpass shows a smoke plume in the GeoColor imagery below, and three separate fire detections in these Real Earth screenshots (from here).
NOAA-21 NGFS Fire Detections superimposed on GeoColor imagery, 1922 UTC on 5 March 2024 (Click to enlarge)
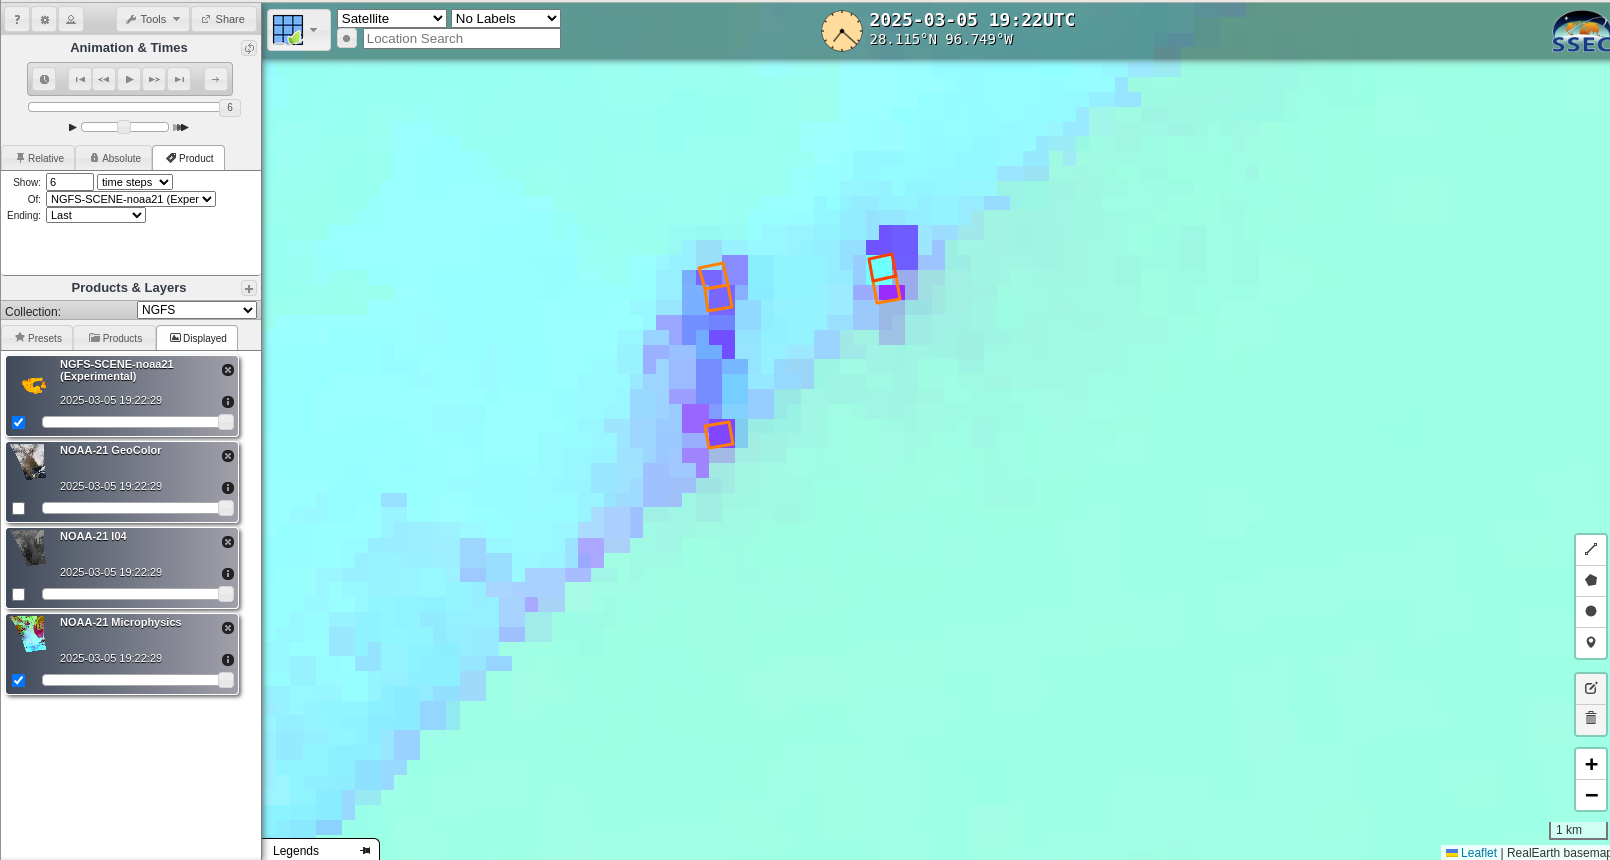
A zoomed-in view of the NGFS detections and the NGFS Microphysics is shown below. Of particular note is that VIIRS data resolves three separate fires.
VIIRS-based NGFS fire detections plotted on top of an NGFS Microphysics RGB, 1922 UTC on 5 March 2025 (Click to enlarge)
What did GOES show at the same time? That’s shown below in a toggle between GeoColor and the NGFS Microphysics RGB. The advantages of the higher-resolution VIIRS imagery shown above is obvious. VIIRS coverage is somewhat limited over CONUS; it is much more plentiful over Alaska where GOES pixel sizes have become large because of the distance to Alaska from the sub-satellite point of GOES-18.
GOES-16 GeoColor and NGFS MIcrophysics, 1921 UTC on 5 March 2025 (Click to enlarge)
This detection on 5 March was over a relatively uninhabited region, where satellite detection will likely give the earliest alert for responders. On 4 March, when much of south Texas was within a critical fire weather outlook from SPC, a fire developed within the pixels that included at the NWS Corpus Christi office! The NGFS detections for that (brief) grassland fire are shown below.
NGFS MIcrophysics and Fire Detections near Corpus Christi TX, 2151 – 2236 UTC on 4 March 2025 (Click to enlarge)
This example on 4 March demonstrates why it’s important for a weather office to have windows!
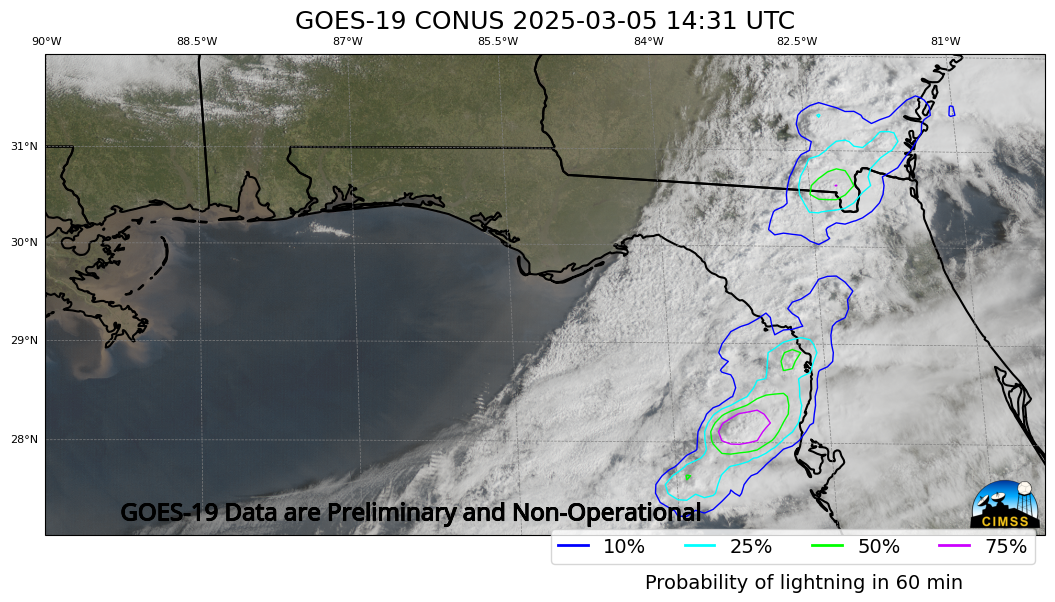
GOES-19 today is positioned at 89.5oW, the test position, but is presently scheduled to drift east to the GOES-East location at 75.2oW. When on station in early April, it will become the operational GOES-East satellite. CIMSS scientists have been modifying CSPPGeo software to produce products, such as LightningCast probability (available online here,... Read More
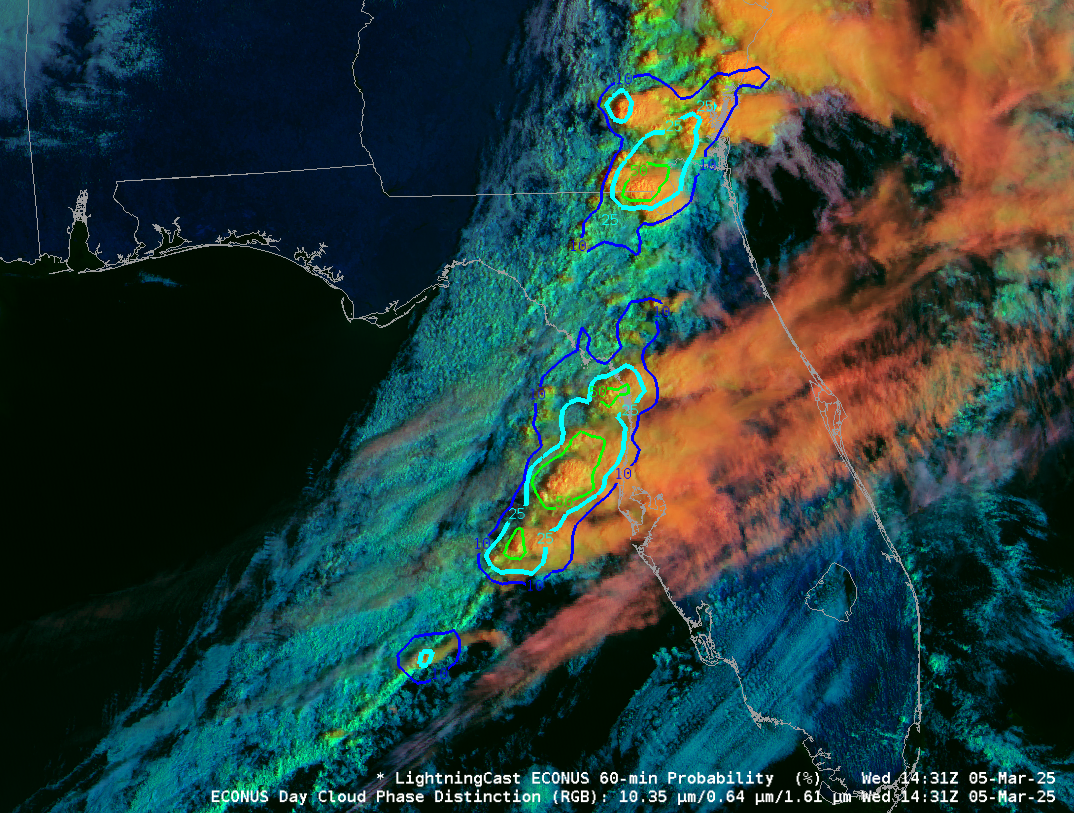
CSPPGeo LightingCast contours plotted on top of GOES-19 True Color imagery, 1431 UTC on 5 March 2025 (Click to enlarge)
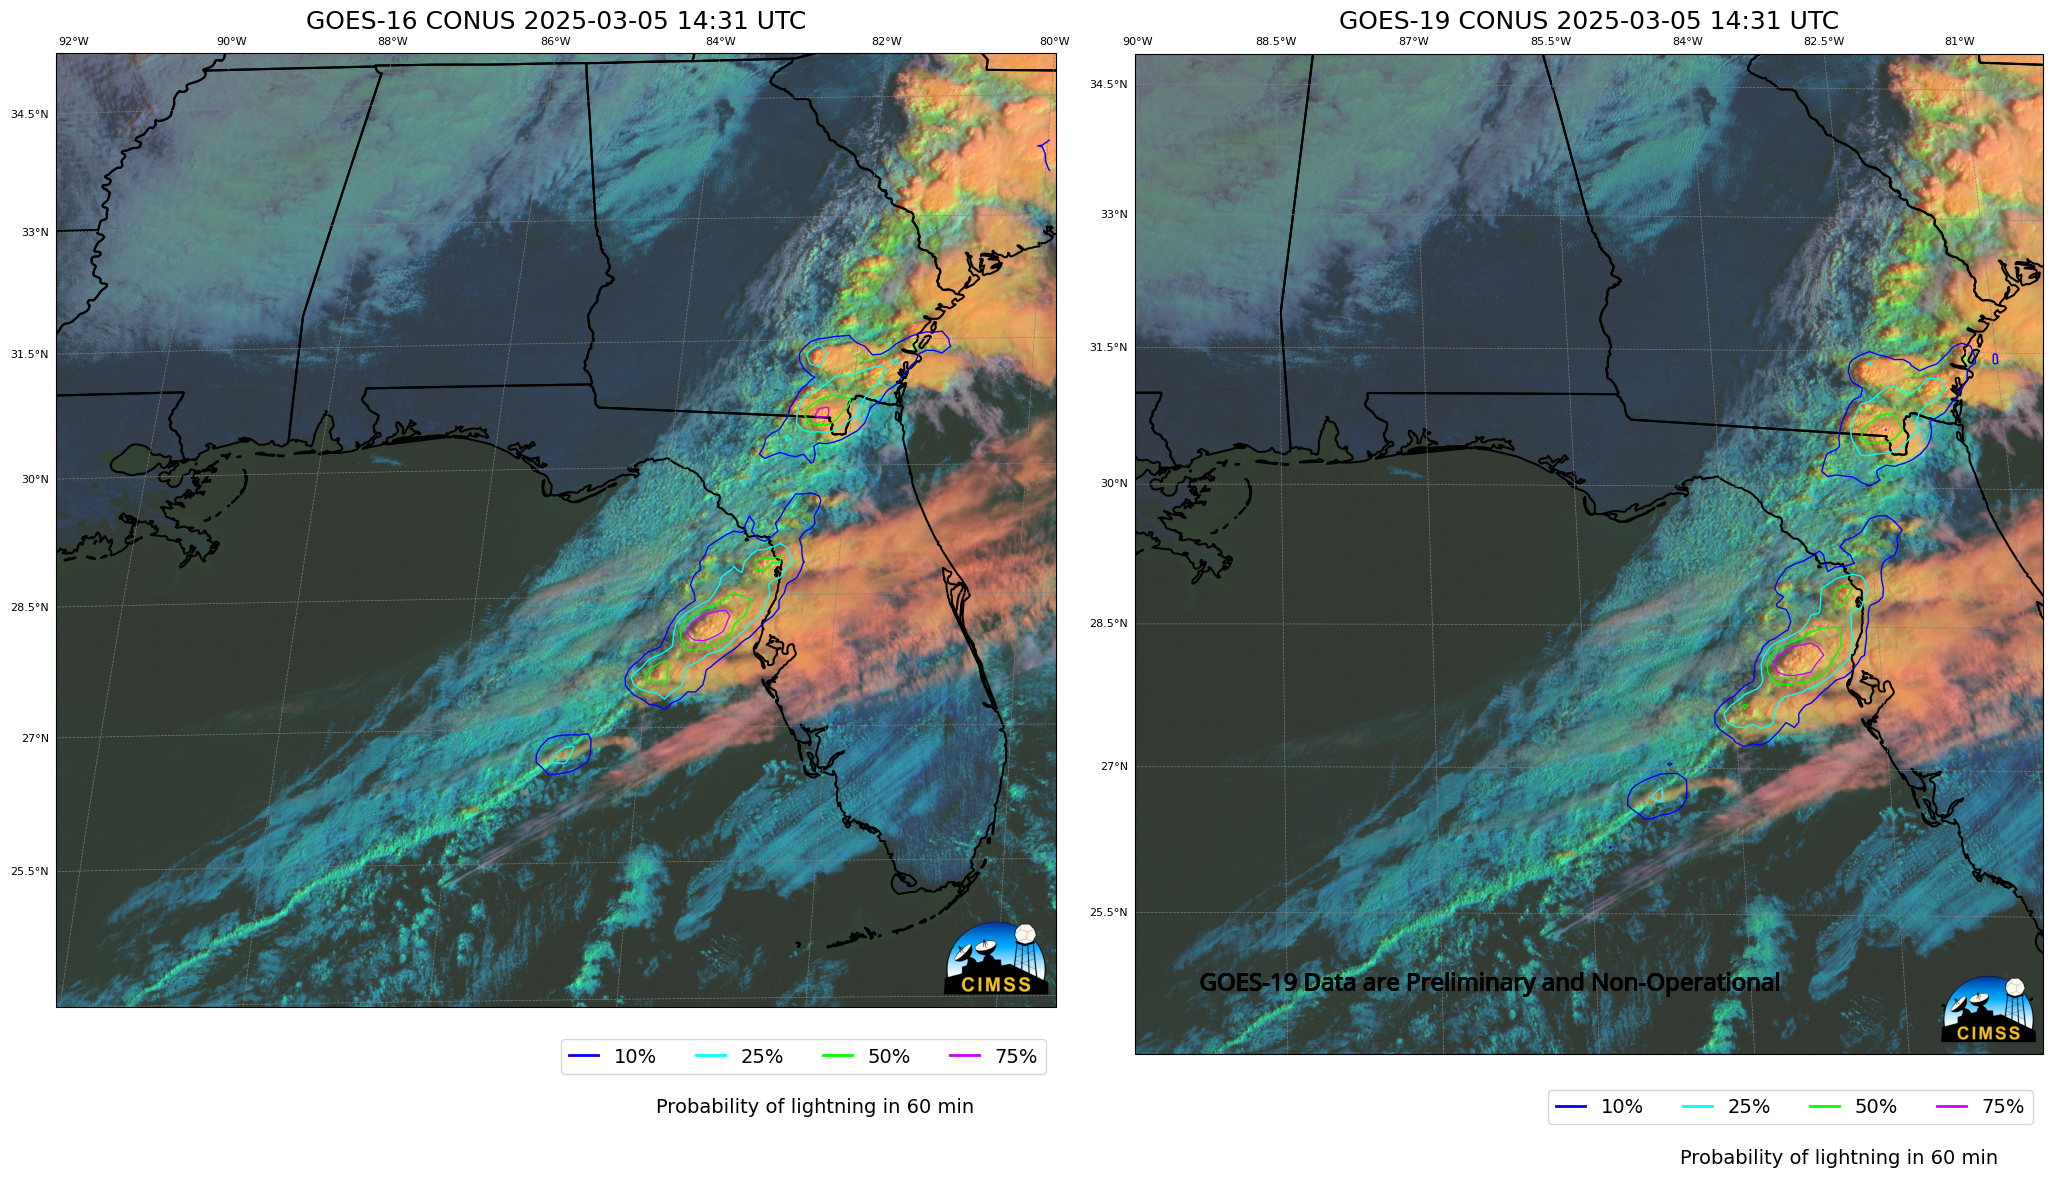
GOES-19 today is positioned at 89.5oW, the test position, but is presently scheduled to drift east to the GOES-East location at 75.2oW. When on station in early April, it will become the operational GOES-East satellite. CIMSS scientists have been modifying CSPPGeo software to produce products, such as LightningCast probability (available online here, or, for GOES-16/GOES-18 in AWIPS), using GOES-19 data as input. The image above shows LightningCast probabilities from GOES-19 over a True Color image (a new feature of the latest beta). A comparison with GOES-16 (using Day Cloud Phase Distinction) is below. Differences in the fields are most likely due to view angle differences. You can read more on GOES-19 LightningCast probabilities here, and this blog post describes the (first) beta version of the software.
CSPPGeo LightingCast contours plotted on top of GOES-16 (left) and GOES-19 (right) Day Cloud Phase Distinction RGB imagery, 1431 UTC on 5 March 2025 (Click to enlarge)
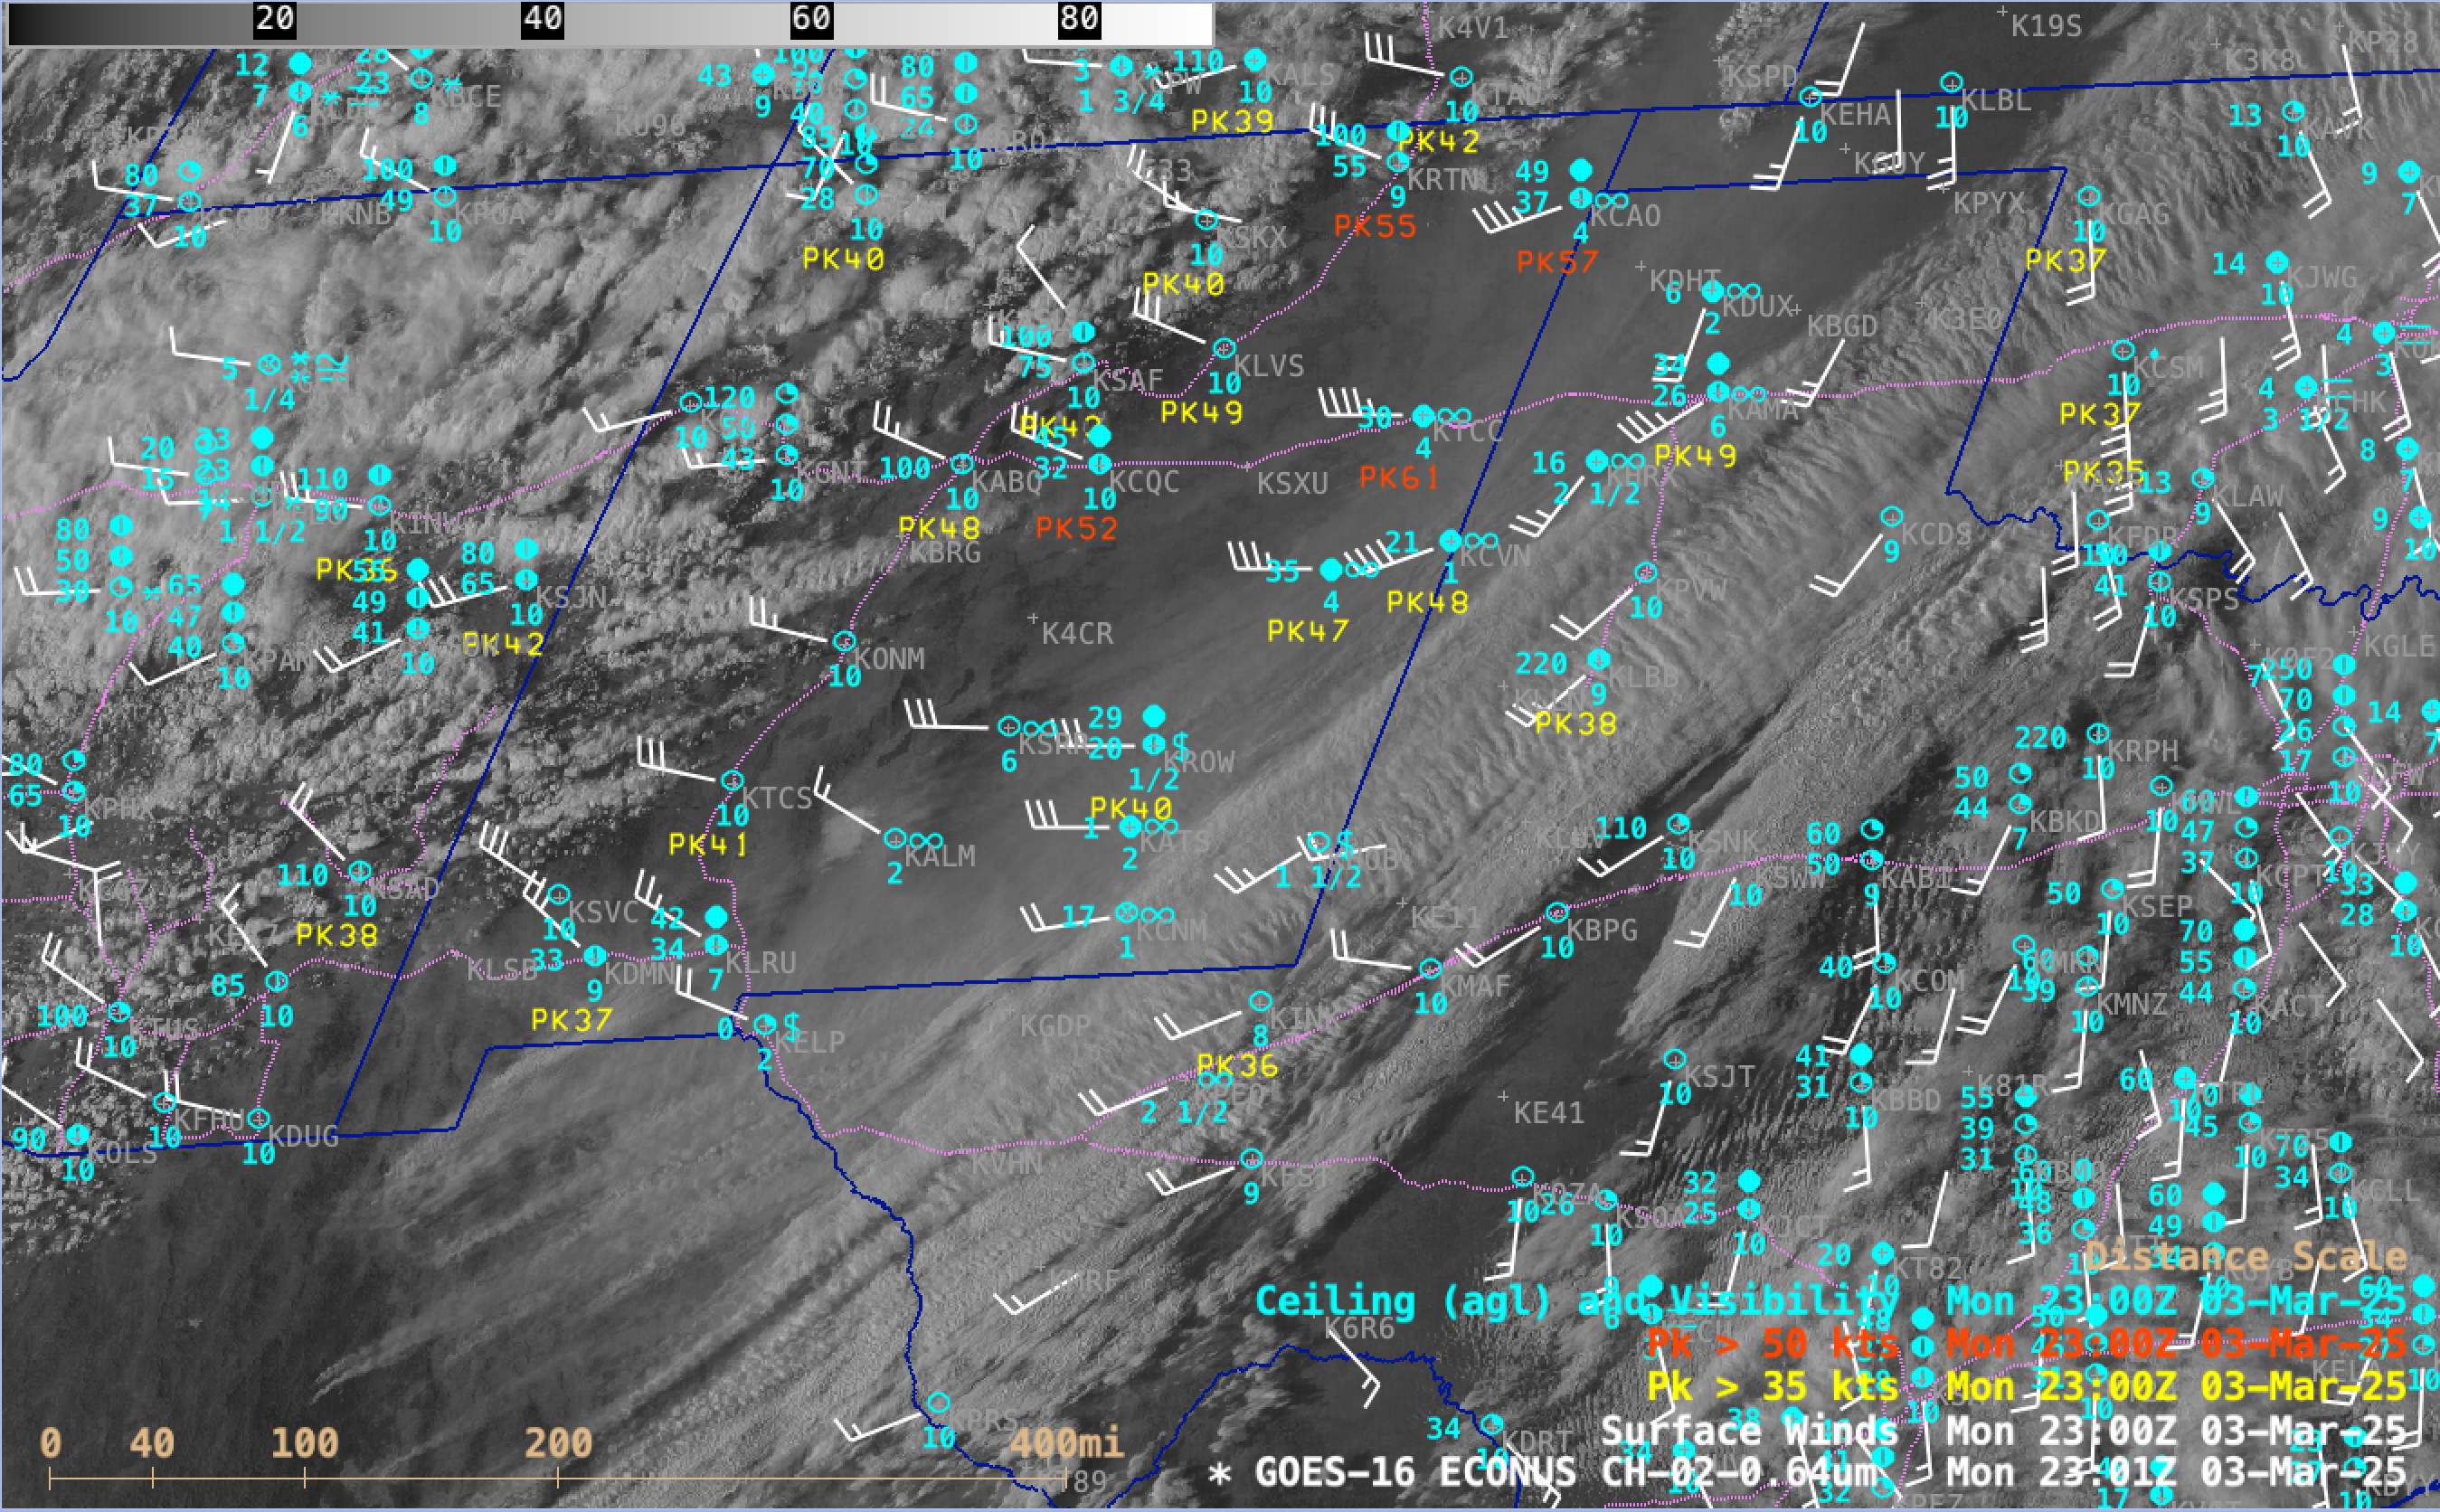
5-minute CONUS Sector GOES-16 (GOES-East) Visible images (above) showed the strong winds — associated with the passage of a cold front — which produced widespread areas of blowing dust across parts of southern/eastern New Mexico and western/northern Texas on 03 March 2025. This blowing dust caused marked reductions in visibility — leading to closures... Read More
GOES-16 Red Visible (0.64 µm) images with plots of Surface Wind barbs (white), Peak Wind gusts (yellow/red) and Ceiling/Visibility/Weather (cyan) from 1516-2341 UTC on 03 March; Interstate highways are plotted in violet [click to play MP4 animation]
5-minute CONUS Sector GOES-16 (GOES-East) Visible images (above) showed the strong winds — associated with the passage of a cold front — which produced widespread areas of blowing dust across parts of southern/eastern New Mexico and western/northern Texas on 03 March 2025. This blowing dust caused marked reductions in visibility — leading to closures of Interstates 10 and 25 near Deming KDMN and Las Cruces KLRU in southern New Mexico, in addition to multiple-vehicle accidents near Roswell KROW.
GOES-16 True Color RGB images from the CSPP GeoSphere site (below) provided a more distinct view of the dense blowing dust, which eventually stretched from northern Mexico to far southeast Colorado and far southwest Kansas. Note the plume of blowing sand whose source region was White Sands National Park in southern New Mexico.
GOES-16 True Color RGB images, from 1611 UTC on 03 March to 0001 UTC on 04 March [click to play MP4 animation]
After sunset, GOES-16 Nighttime Microphysics RGB images (below) showed that the leading edge of the airborne dust (highlighted by brighter shades of magenta) advanced as far northward as Nebraska and South Dakota. The Nighttime Microphysics RGB makes use of the 10.3-12.3 µm “Split Window Difference“, which is effective for dust detection.
GOES-16 daytime True Color RGB and Nighttime Microphysics RGB images, from 2331 UTC on 03 March to 1201 UTC on 04 March [click to play MP4 animation]
Sometimes, CIMSS Blog writers get emailed letter, like the one below (anonymized) forwarded along to CIMSS with a requestA long-dormant idea has resurrected itself in my mind, which is to look into the “biomass and carbon impact” (e.g. biomass and carbon knocked down) from some MCS and derecho type events.... Read More
Sometimes, CIMSS Blog writers get emailed letter, like the one below (anonymized) forwarded along to CIMSS with a request
A long-dormant idea has resurrected itself in my mind, which is to look into the “biomass and carbon impact” (e.g. biomass and carbon knocked down) from some MCS and derecho type events.  We may have talked about this briefly some years ago.  Since we share an interest in NW PA, I thought I would ask if you know of any maps or diagrams that would show the affected area from the July 21, 2003 wind event…..of course it produced the tornado that brought down the Kinzua Bridge, but the event itself was much more widespread....

.....Is there an archived database of satellite imagery that would show the damage in NW Pennsylvania from the 21 July 2003 storm?
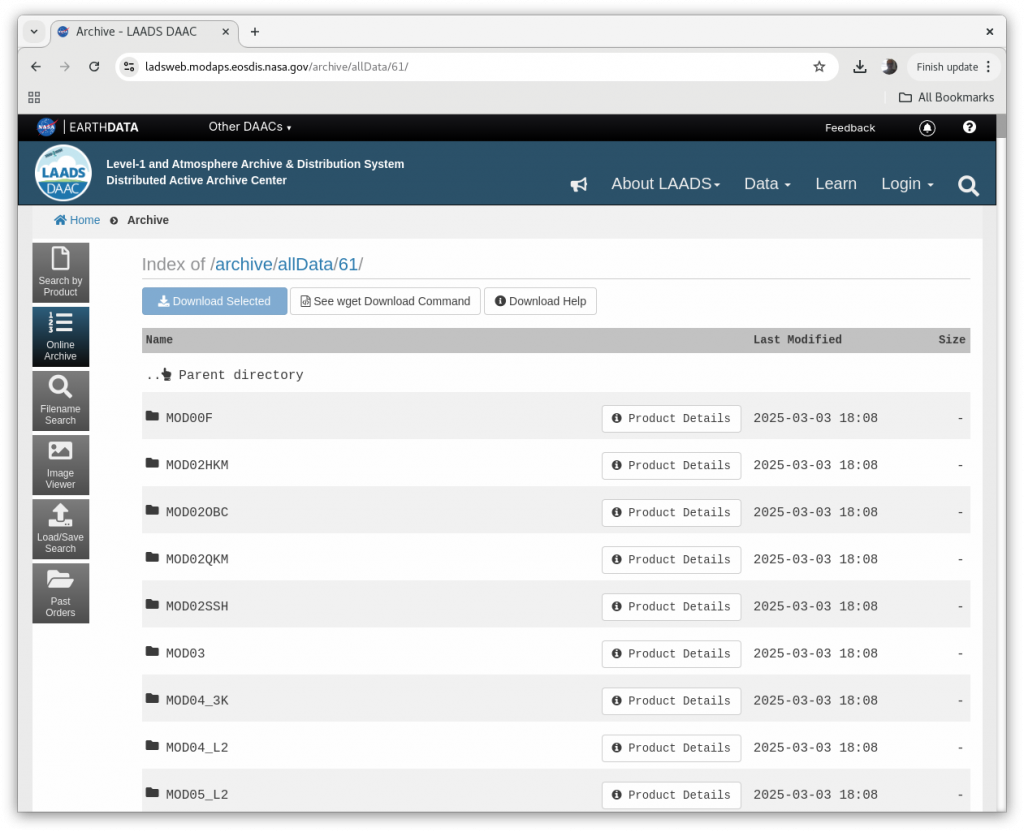
Your blogger first thought of the MODIS Today website — but those images “only” go back to late 2007. There are data sources that allow a reconstruction of those images, however. The big challenge in accessing MODIS data from long ago is knowing when Terra (or Aqua) overflew northwest Pennsylvania, where the Kinzua Viaduct once stood. The CIMSS Polar Orbit Tracking website (https://www.ssec.wisc.edu/datacenter/polar_orbit_tracks/) includes an archive for satellites, so it’s easy to find where Terra was flying on 19 July, 20 July, 21 July, … , 27 July (and other dates too, of course), allowing someone to identify the times of data needed. I’m looking at series of days because I don’t recall cloud conditions over northwest Pennsylvania from back in 2003! The NASA LAADS website (https://ladsweb.modaps.eosdis.nasa.gov/) contains the level-1b hdf files that can be used to create imagery. (This is also discussed in this blog post for imagery over the Himalayas). For this blog post, I searched for Level-1b files ( https://ladsweb.modaps.eosdis.nasa.gov/missions-and-measurements/science-domain/modis-L0L1/ ) and downloaded hdf files containing data to be displayed with polar2grid software. The data needed to construct true-color imagery include quarter-kilometer data (MOD02QKM), half-kilometer data (MOD02HKM) and georeferencing data (MOD03), as shown at the website below (accessible from this link). Each of those folders will have annual and then daily folders to enter; the daily files are 5-minute granules that are matched to times in the polar orbit tracks at the CIMSS website.
Screen capture of NASA/LAADS website that holds Level 0/Level 1 data (Click to enlarge)
Day 207 files (that is, 26 July 2003) that include Kinzua are shown below. Here are the MODIS paths on that day; note the location of 1630 and 1635 UTC on that map!
I downloaded the data from LAADS for multiple days. To display the imagery, polar2grid (free unix-based software from CIMSS available here) is used. First, a geographic location is established for polar2grid:
That polar2grid command creates gridding information for an 1120×840 grid centered at 41.8oN, 78.6oW with 250-m resolution in the n-s and e-w directions. The polar2grid command to create a true_color image and then to place borders, coastlines, and a lat/lon grid are shown below.
./polar2grid.sh -r modis -w geotiff -p true_color -g Kinzua --grid-configs ./Kinzua.yaml -f /path/to/downloadedfiles/Kinzua/206/*.hdf ./add_coastlines.sh --add-borders --borders-resolution f --add-coastlines --coastlines-resolution f --add-grid --grid-D 1.0 1.0 --grid-d 1.0 1.0 --grid-text-size 12 terra_modis_true_color_20030726_??????_Kinzua.tif
The imagery created is below.
MODIS True Color imagery on 26 July 2003 (Click to enlarge)
An animation from 19-27 July 2003 is shown below. An abundance of clouds is obvious. Perhaps days later in July, or in August, will show clearer skies! Still, a difference field between 19 and 25 July (that is, before and after the Kinzua destruction) might show something. A toggle between those two dates is at the bottom of this blog post.
Terra MODIS true-color imagery, 19-27 July 2003 over NW Pennsylvania (Click to enlarge)Terra MODIS true-color imagery, 19 and 25 July 2003 over NW Pennsylvania (Click to enlarge)
Thanks to Kathy Strabala, SSEC/CIMSS, for reminding me about the LAADS data source. A next step for anyone wanting to look at that region would be to access Landsat data and hope for clearer skies.


