A sequence of Suomi-NPP VIIRS Visible images (above) showed the formation of large ice leads in the eastern Beaufort Sea — as well as the growth of a polynya adjacent to the coast near the Alaska/Yukon border — during the 5-day period from 07-11 March 2025.Suomi-NPP VIIRS Shortwave Infrared images... Read More

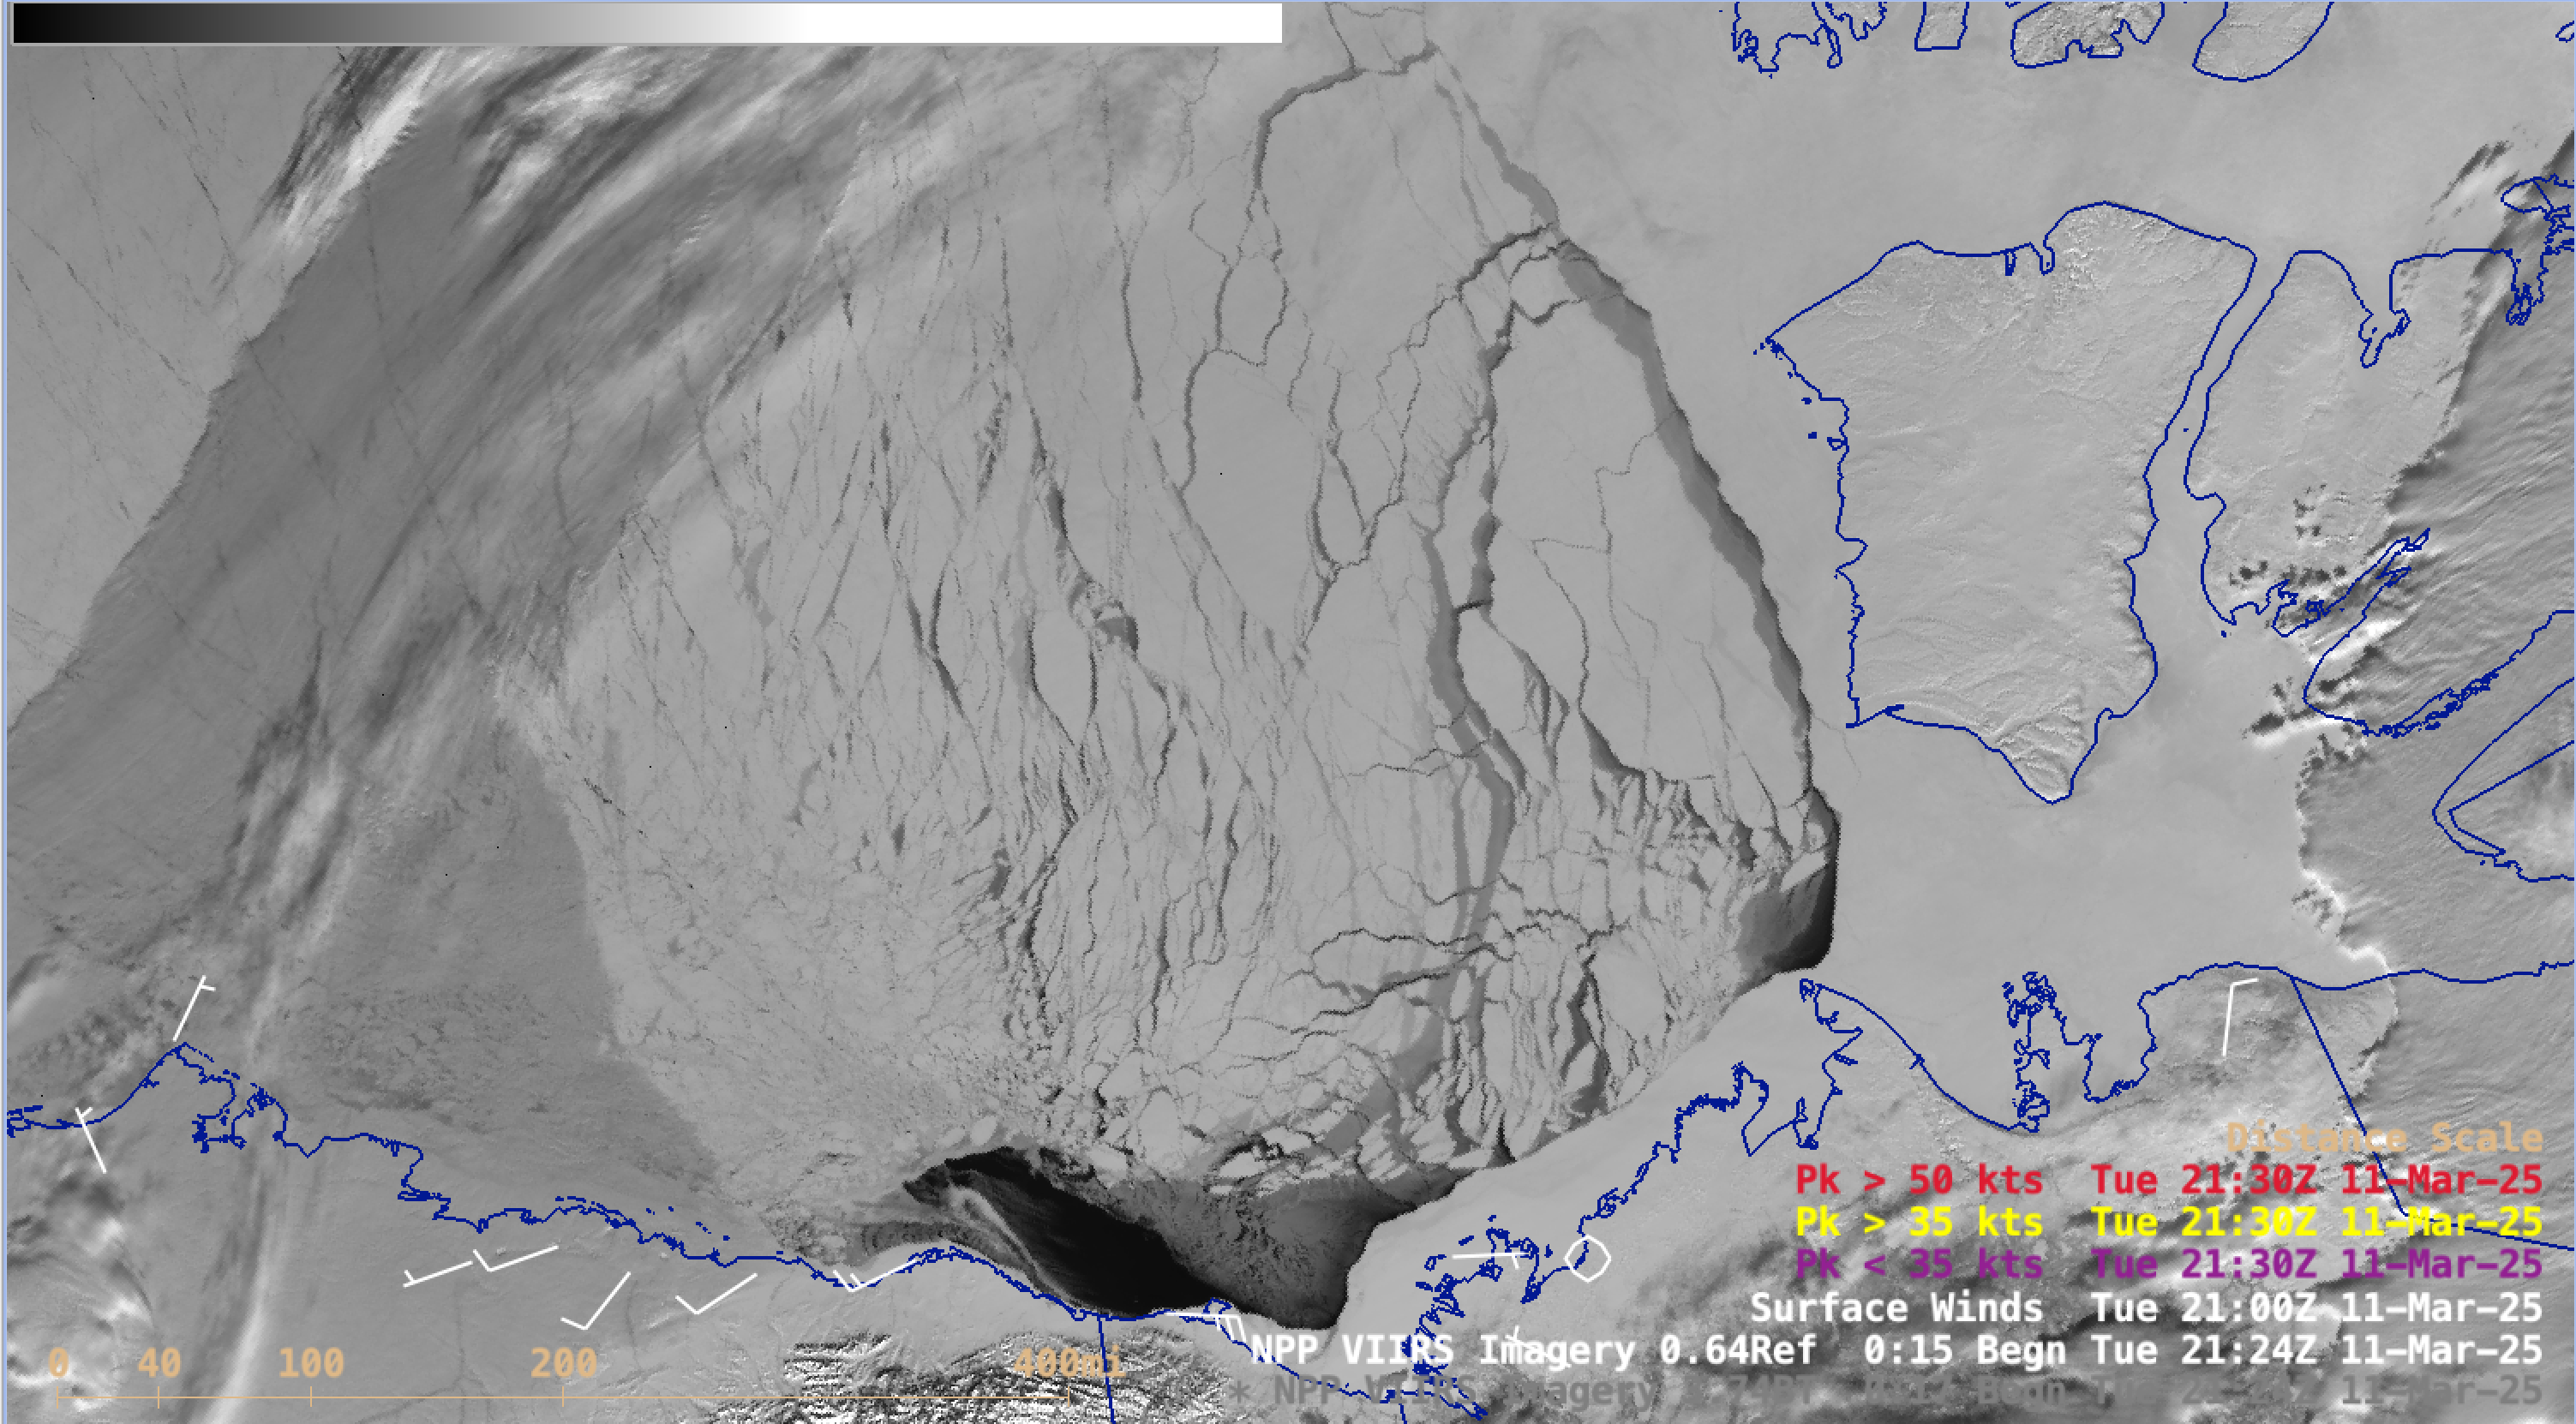
Suomi-NPP VIIRS Visible images from 07-11 March [click to play animated GIF | MP4]
A sequence of Suomi-NPP VIIRS Visible images
(above) showed the formation of large ice leads in the eastern Beaufort Sea — as well as the growth of a polynya adjacent to the coast near the Alaska/Yukon border — during the 5-day period from 07-11 March 2025.
Suomi-NPP VIIRS Shortwave Infrared images (below) provided a view of the ice leads and polynya during both the nighttime and daytime hours during the 07-11 March period.
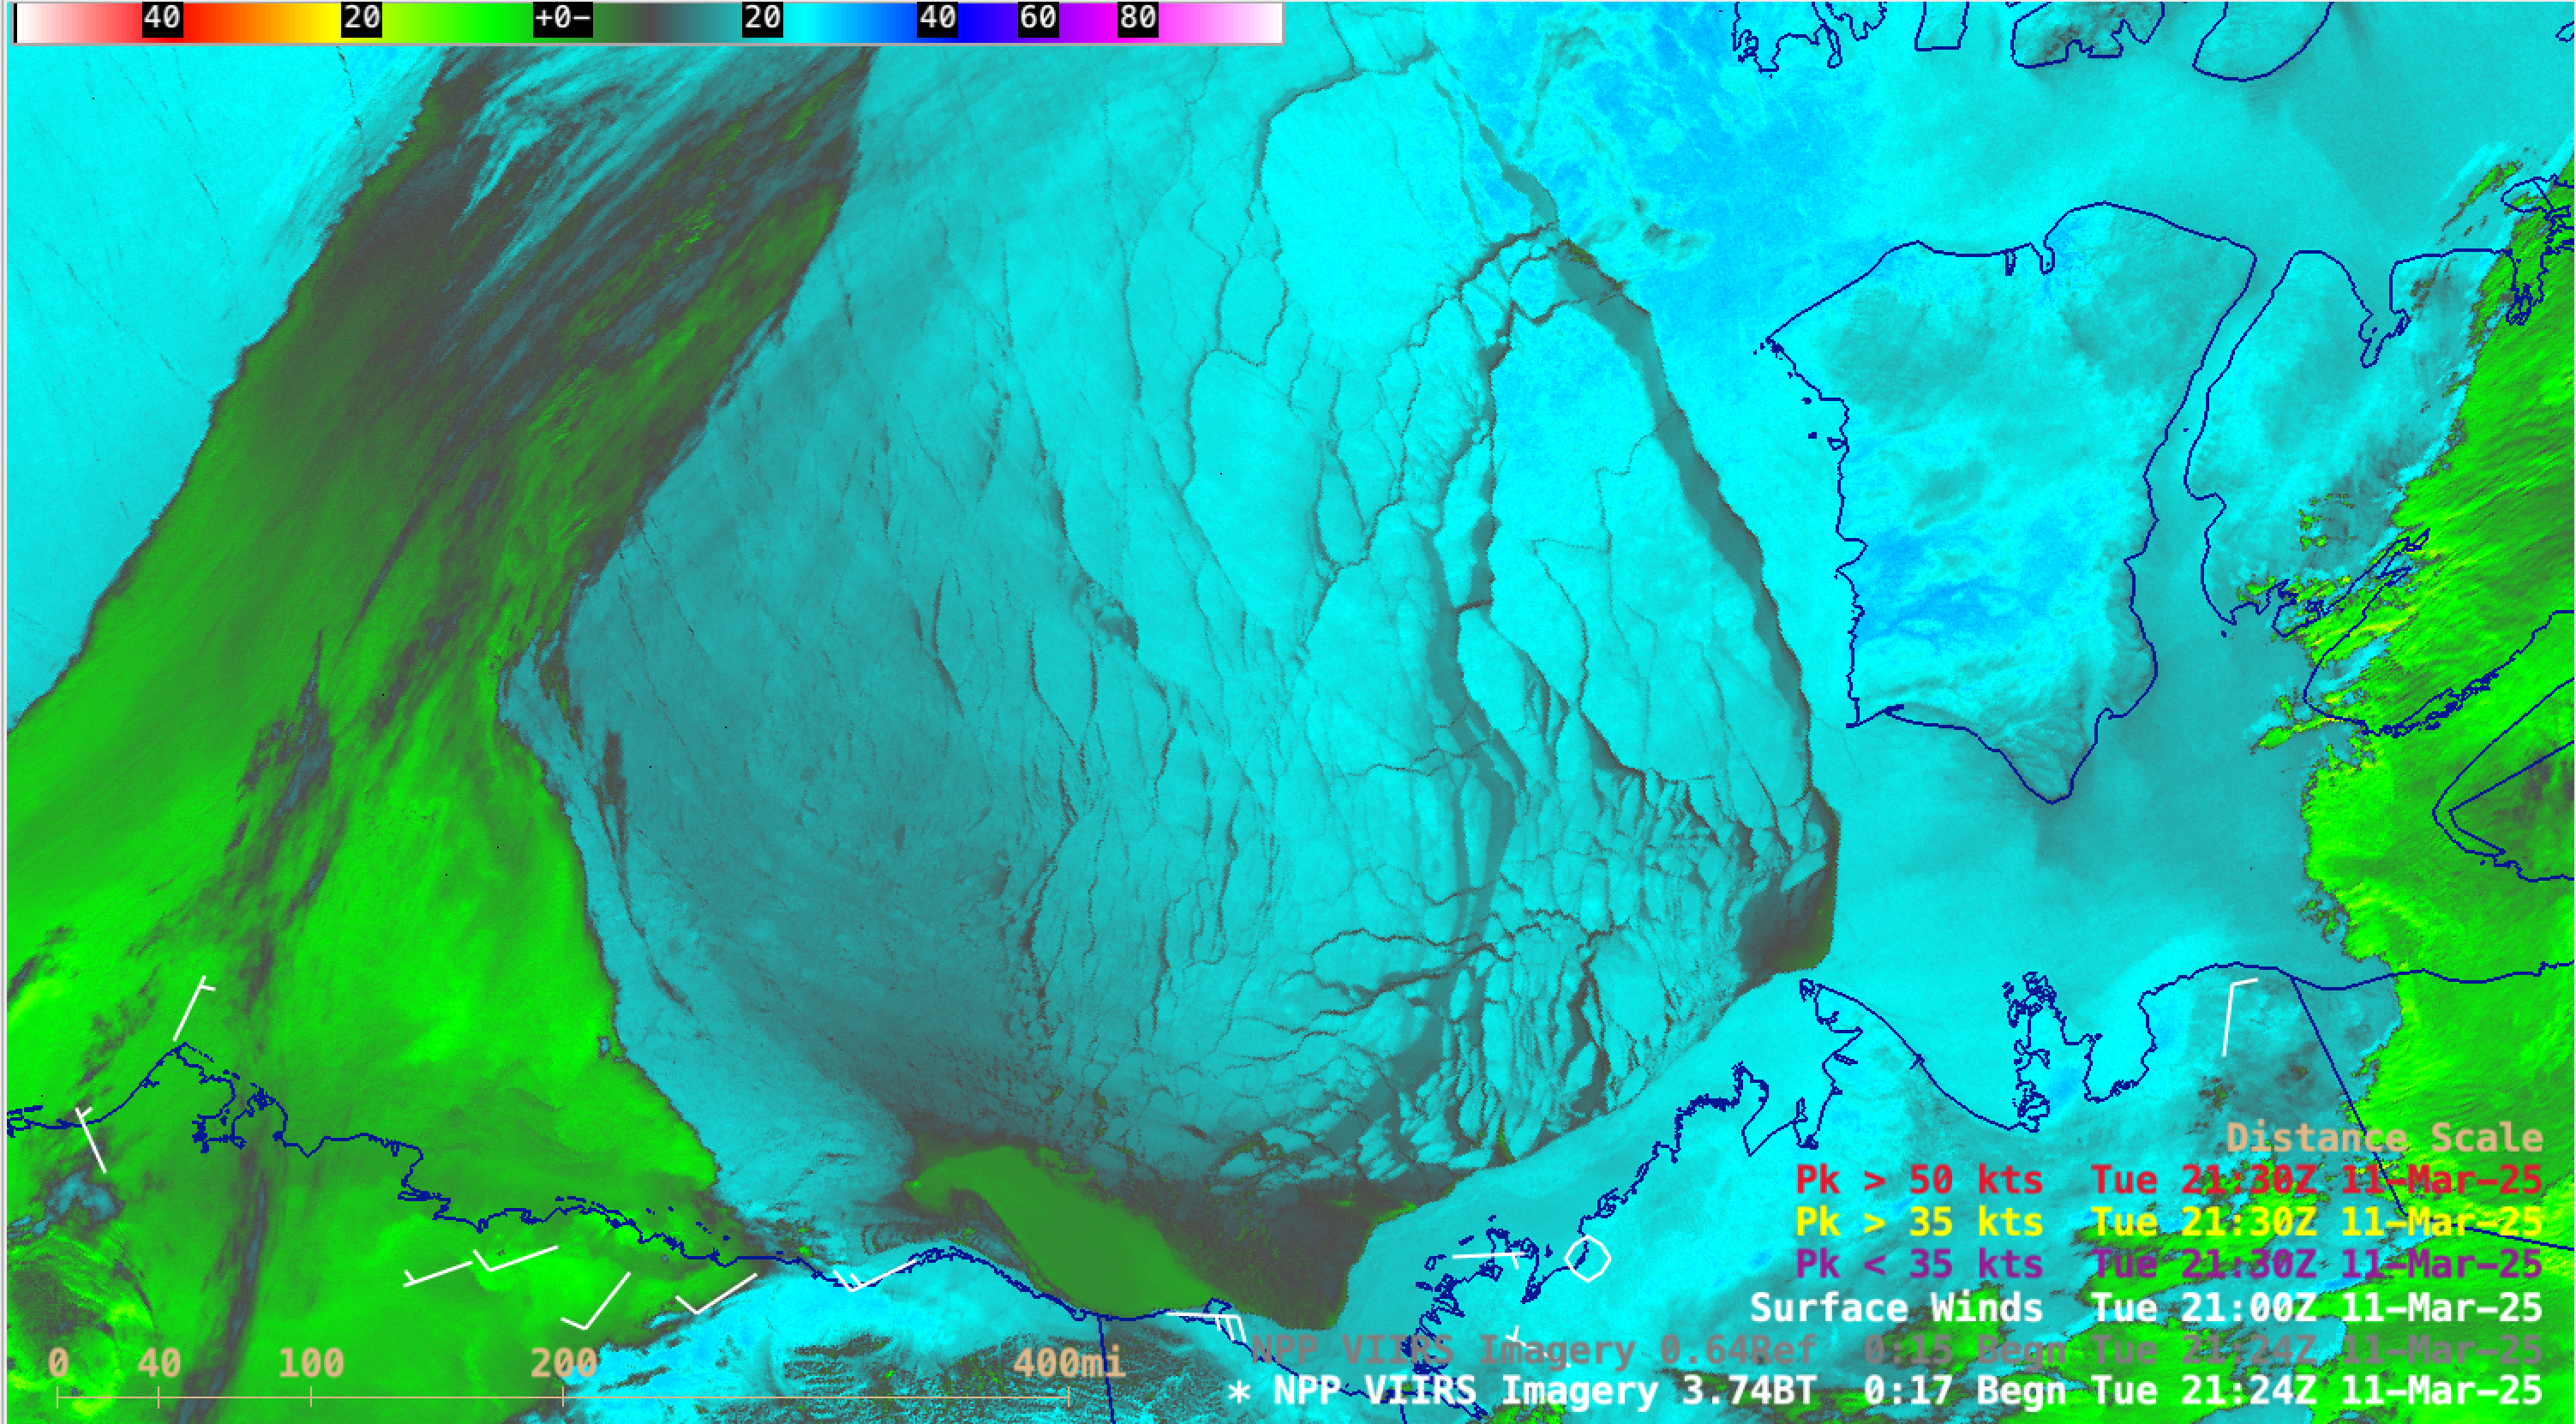
Suomi-NPP VIIRS Shortwave Infrared images from 07-11 March [click to play animated GIF | MP4]
Daily composites of Suomi-NPP VIIRS Sea Ice Temperature/Thickness/Age products (
source) indicated that the larger ice leads were developing near the gradient of temperature and thickness of old ice in the eastern Beaufort Sea
(below).
Daily Suomi-NPP VIIRS Composite Sea Ice Temperature product, from 07-10 March [click to enlarge]
Daily Suomi-NPP VIIRS Composite Sea Ice Thickness product, from 07-10 March [click to enlarge]
Suomi-NPP VIIRS Composite Sea Ice Age product, from 07-10 March [click to enlarge]
In spite of lower spatial resolution and a large satellite viewing angle, the more prominent ice leads (as well as the polynya adjacent to the Alaska/Yukon coast) were also apparent in GOES-18
(GOES-West) Visible images from the
CSPP GeoSphere site
(below).
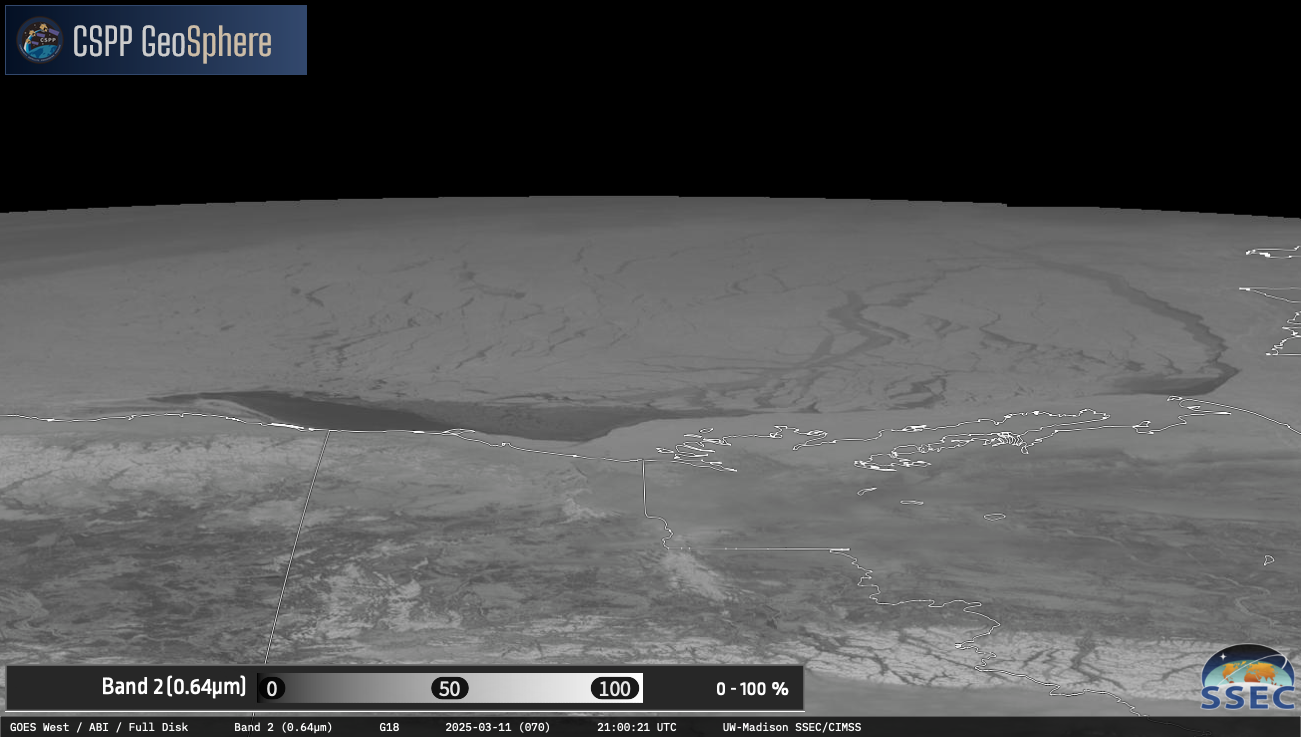
GOES-18 Visible images from 07-11 March [click to play MP4 animation]
Comparisons of Ice Stage and Ice Analysis (
source) shown below indicated that the 2 largest ice leads and the polynya formed during the 7-day period between 03 March and 10 March.

Ice Stage on 03 March and 10 March [click to enlarge]
Ice analysis on 03 March and 10 March [click to enlarge]
View only this post
Read Less


