Forecasts have been consistent in the past days for a storm of historic proportions over parts of southern New England. What conditions that are present now argue for the development of a strong winter storm? The image above is the GOES Sounder Land Surface Temperature (or “Skin Temperature”) product; cold... Read More
GOES-13 Sounder Skin Temperature derived product image
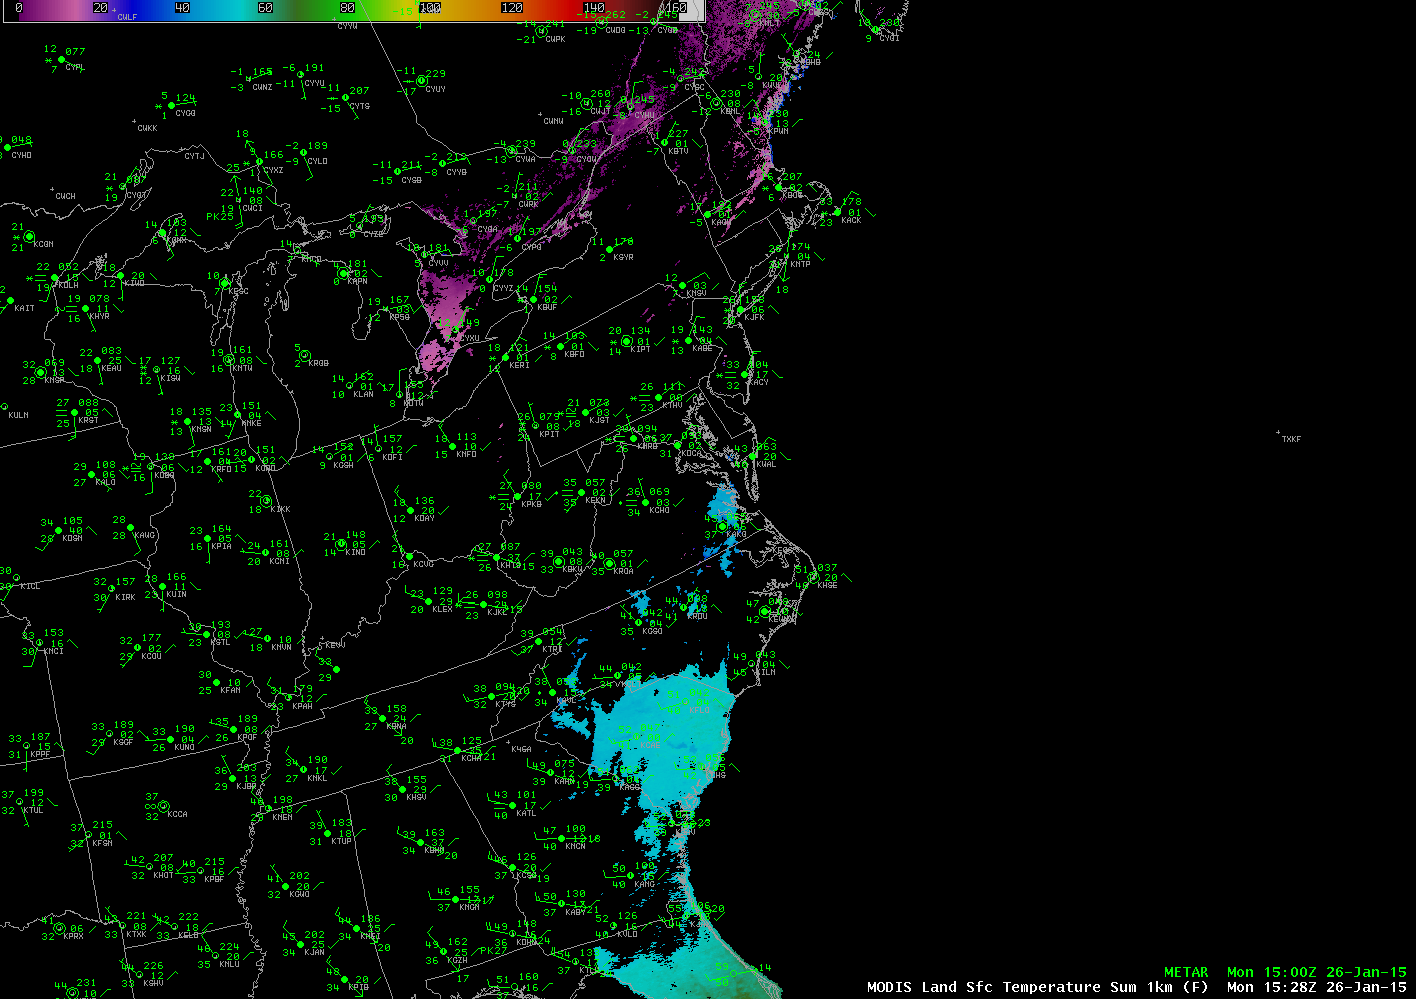
Forecasts have been consistent in the past days for a storm of historic proportions over parts of southern New England. What conditions that are present now argue for the development of a strong winter storm? The image above is the GOES Sounder Land Surface Temperature (or “Skin Temperature”) product; cold air is present over southeastern Canada, with surface temperatures near -30 C, associated with a surface high pressure system. The high pressure will act to reinforce the cold air at the surface, preventing or delaying any changeover to liquid or mixed precipitation (a MODIS Land Surface Temperature product at 1500 UTC on 26 January similarly shows cold air banked over southern Canada).
GOES Sounder estimate of Skin Temperature, 1400 UTC 26 January 2015 (Click to enlarge)
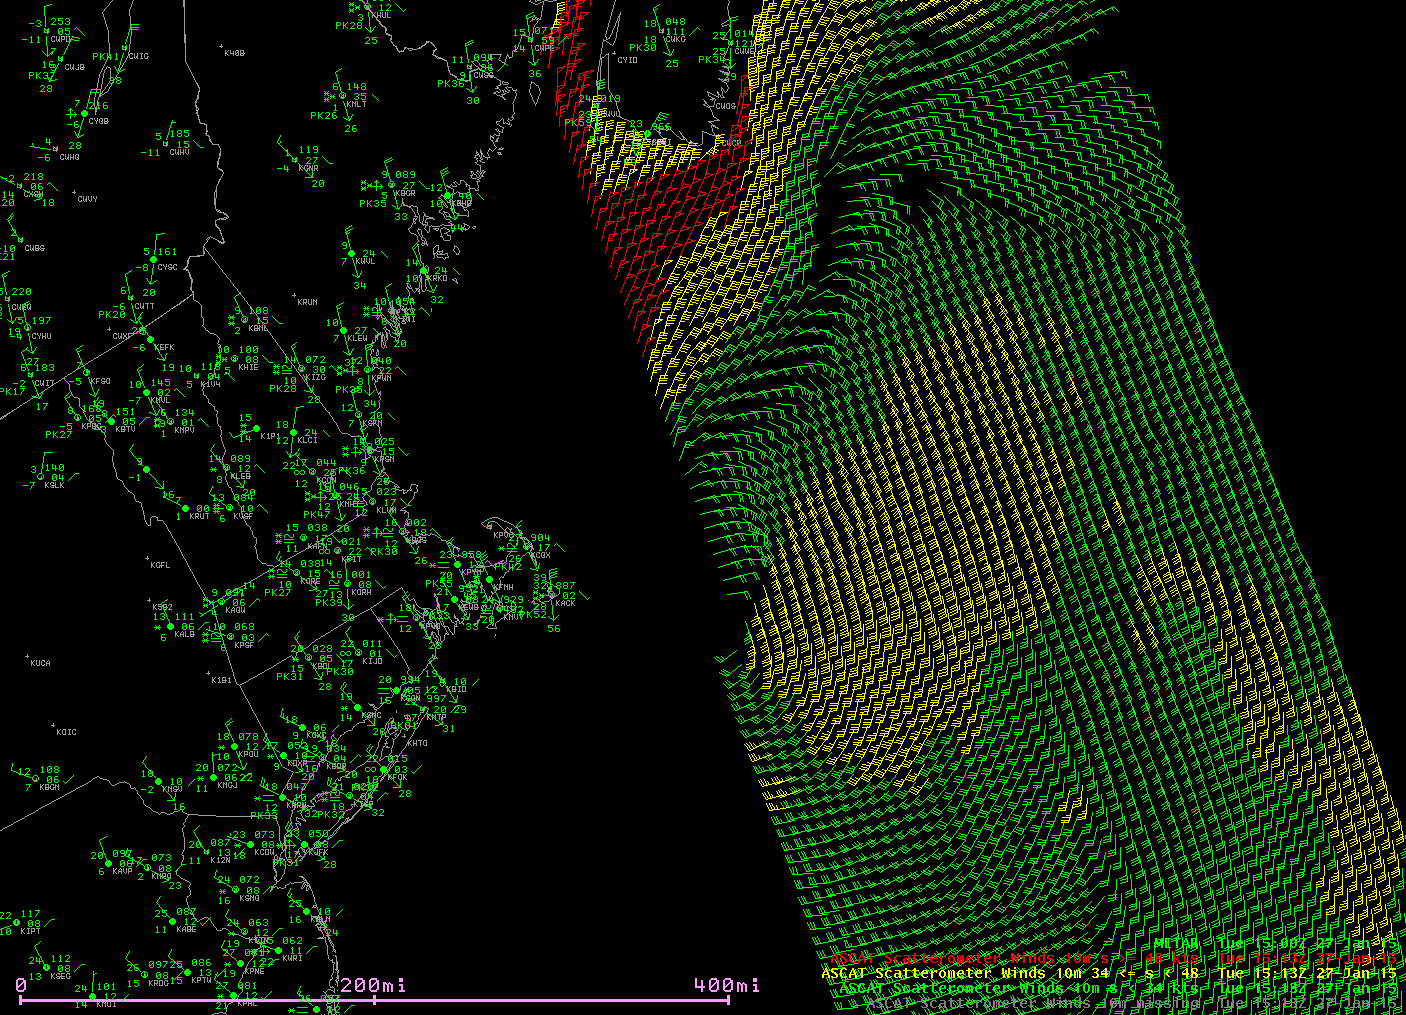
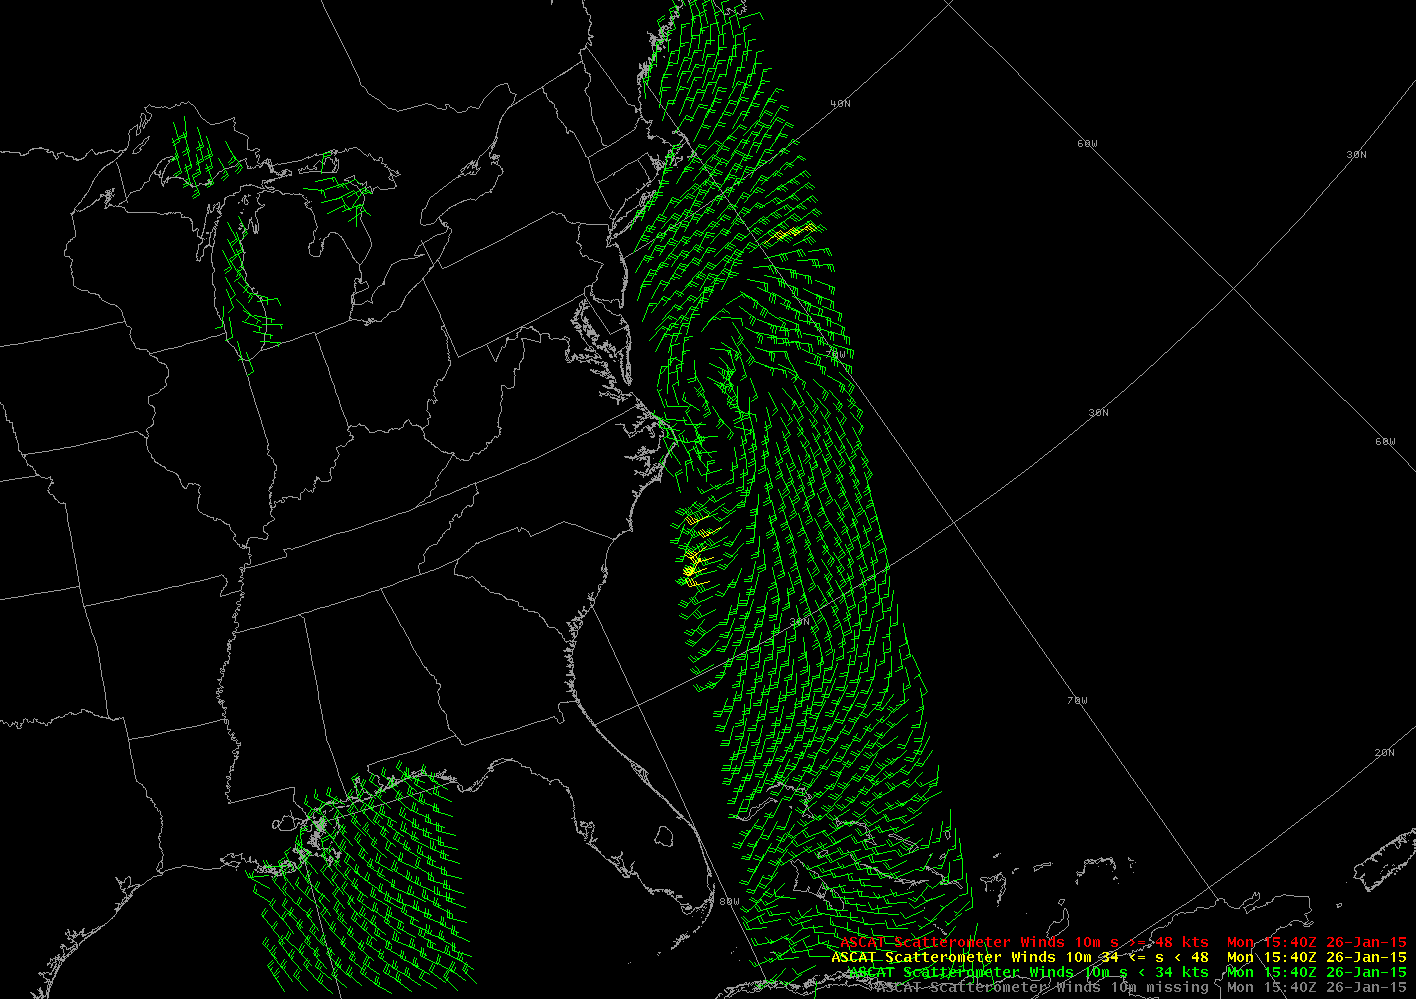
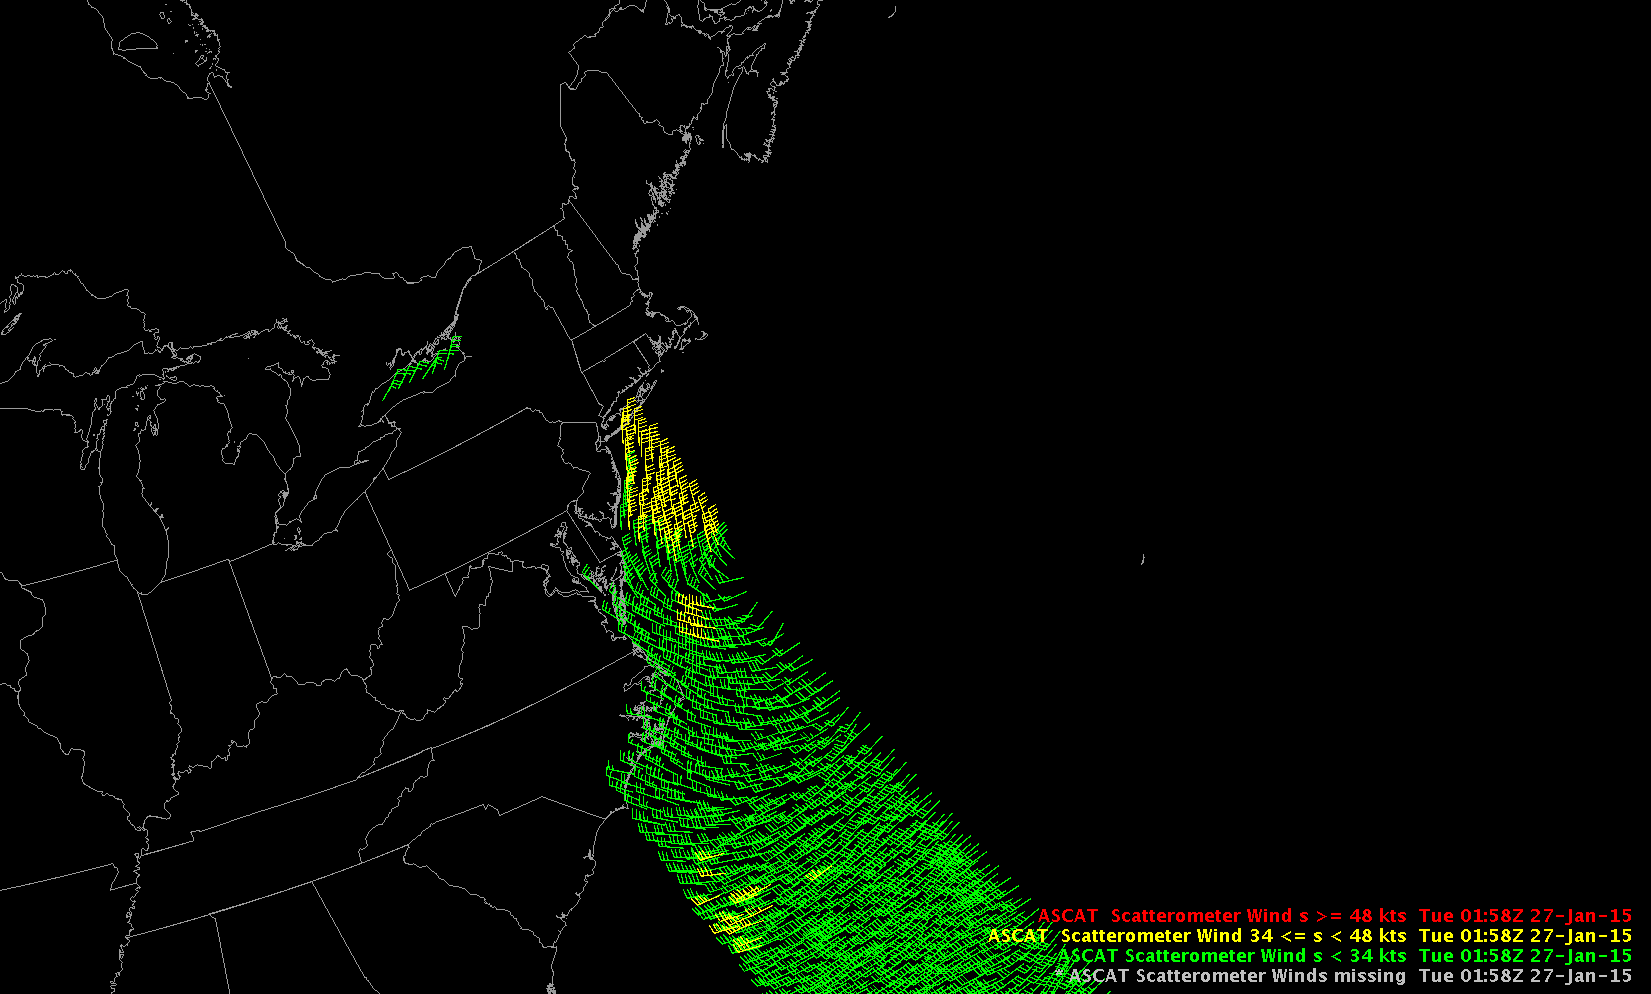
Winds over southern New England early on the 26th continued out of the north and northwest, maintaining cold air at the surface. The ASCAT (from METOP-A) imagery above shows brisk northwesterly winds south of southern New England just before 0100 UTC, with southwesterlies east of Georgia and South Carolina just before 0300 UTC. Those southwesterlies are helping moisten the atmosphere, and heavy snows require abundant moisture. MIMIC Total Precipitation (below; click image to play animation) testifies to the moistening that is occurring off the southeast coast as this system develops; the storm appeared to tap moisture from both the Gulf of Mexico and a pre-existing atmospheric river over the Atlantic Ocean.
[Added: The 1540 UTC ASCAT winds show the surface circulation east of Hatteras and the mouth of the Chesapeake Bay! Winds south of New England have shifted to northeasterly. The location of the circulation well off the coast suggests cold air can be maintained over land.]
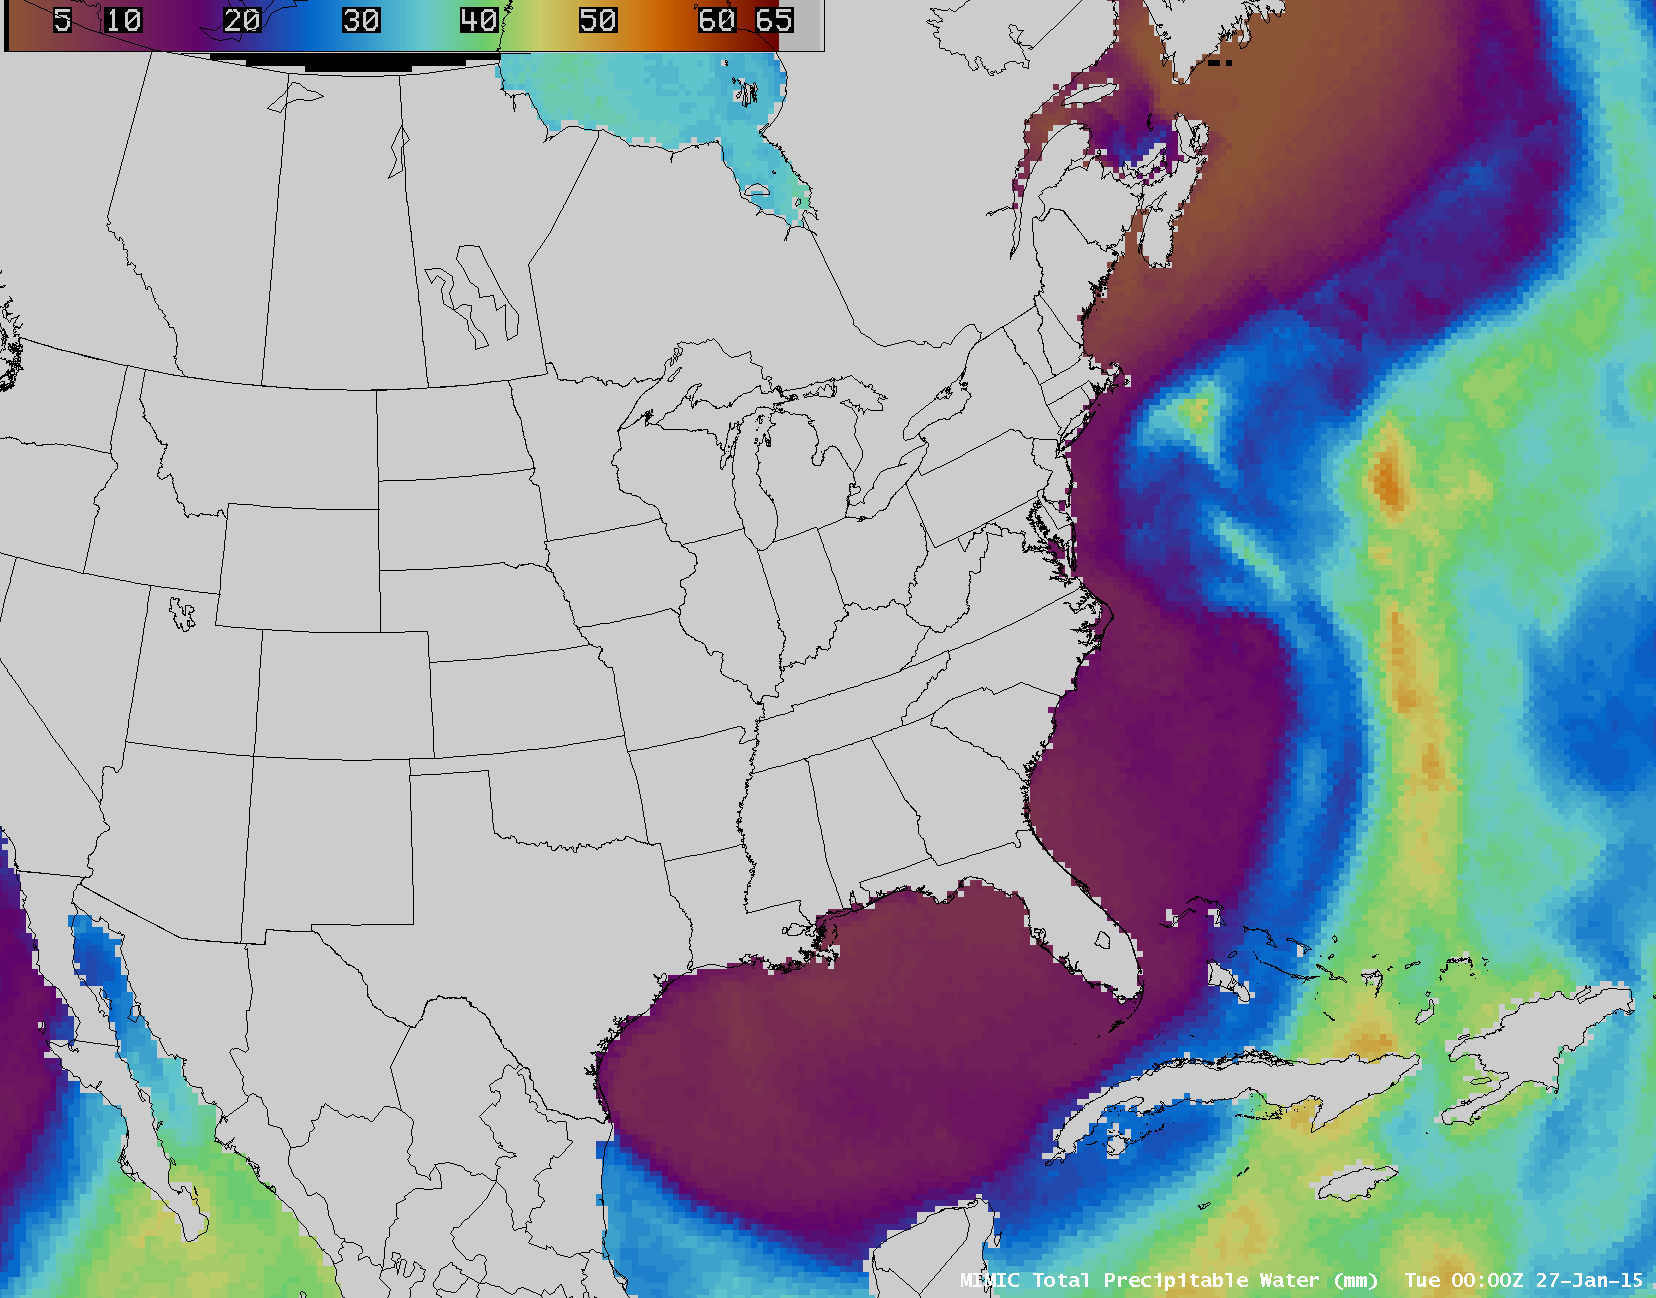
MIMIC total Precipitable Water (click to play animation)
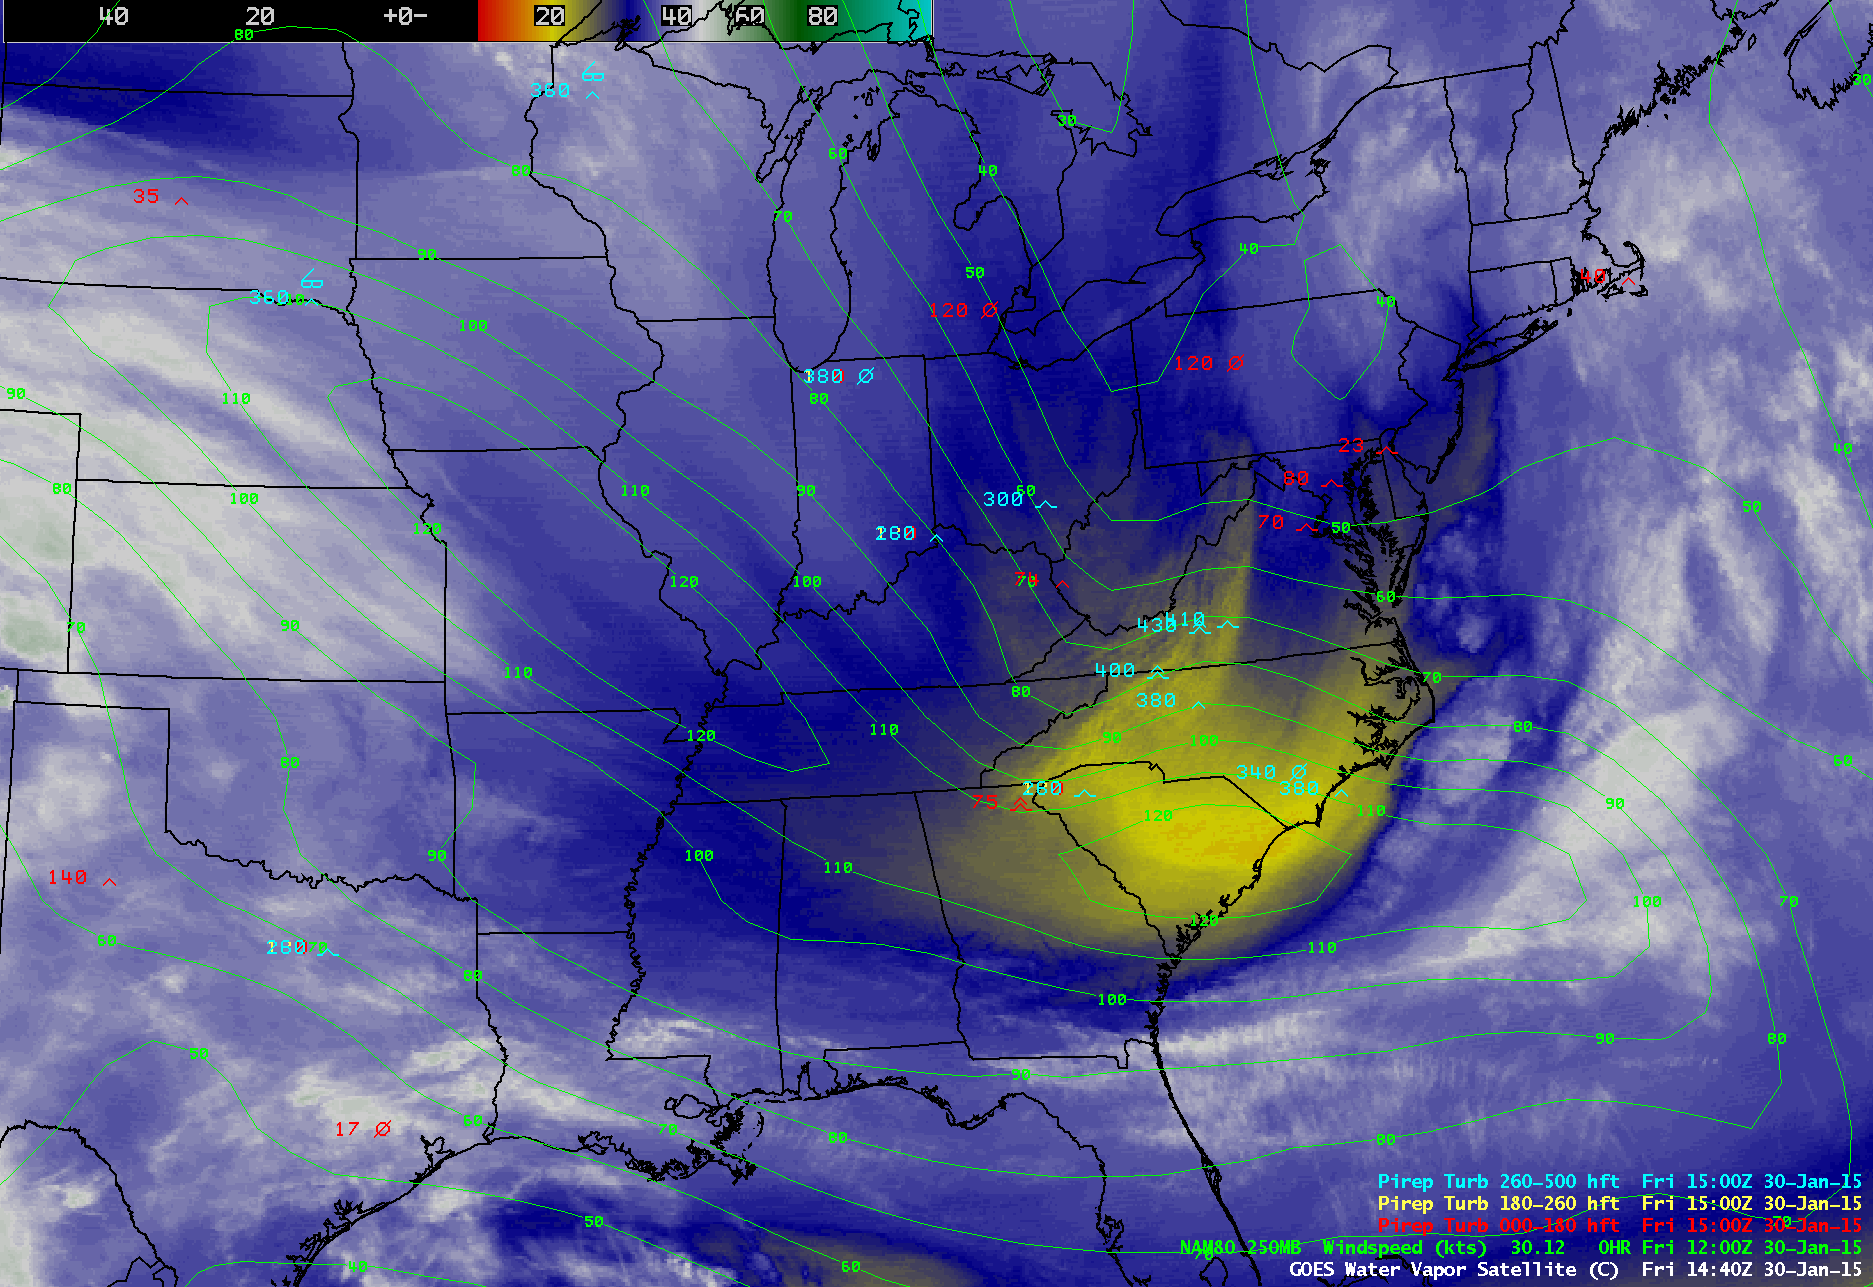
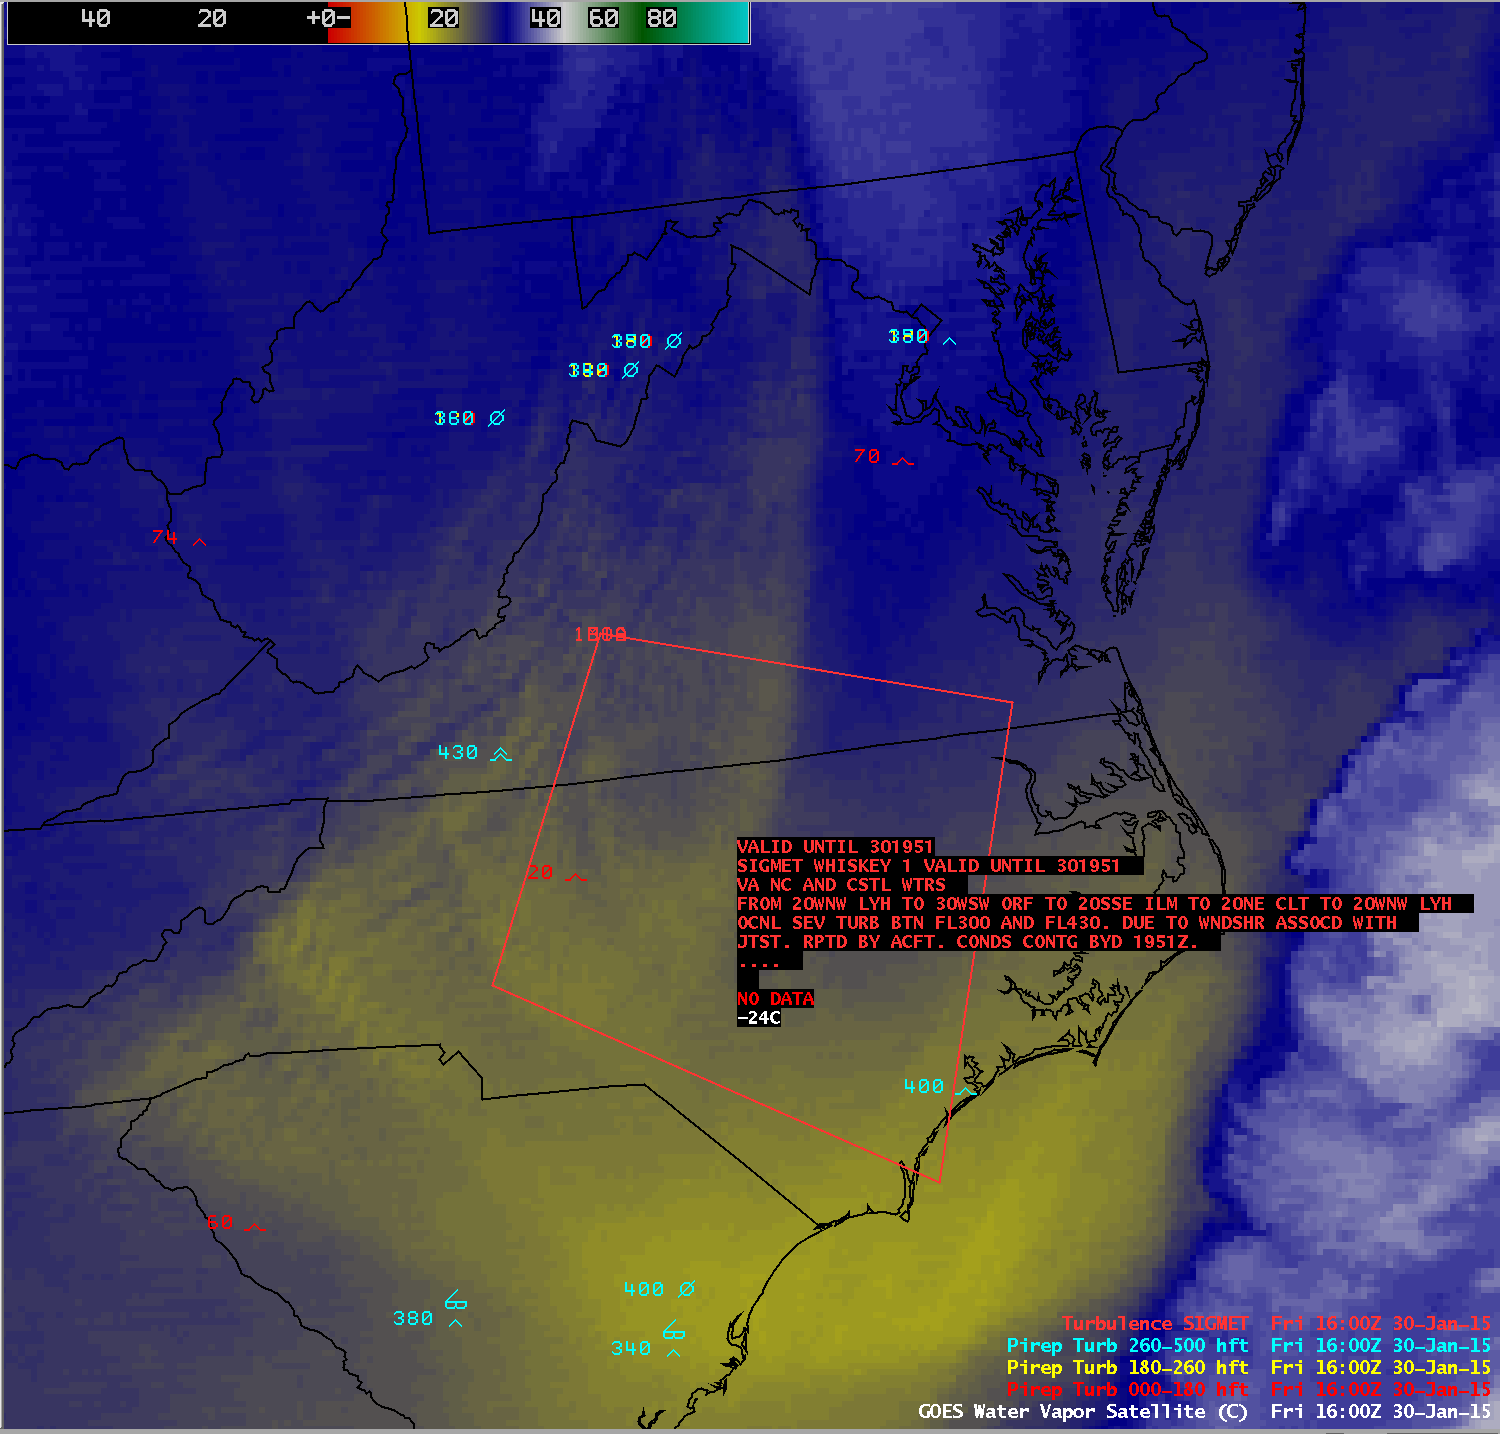
Given that moisture and cold air are present, what features argue for the development of a strong storm? The GOES-13 water vapor images (below; click image to play animation; also available as an MP4 movie file) with cloud-to-ground lightning strikes superimposed show the potent system developing off the US East Coast and blossoming over the Gulf Stream as a secondary warm conveyor belt forms (a water vapor image with lightning animation from 25-26 January is available here). Strong sinking motion behind the system is indicated by the development of warm water vapor channel brightness temperatures (yellow color enhancement), and strong rising motion ahead of the system helps to generate widespread, strong convection. Convection also occurred over the Deep South late on 25 January in response to solar heating. The system depicted in the Water Vapor imagery is obviously quite vigorous.
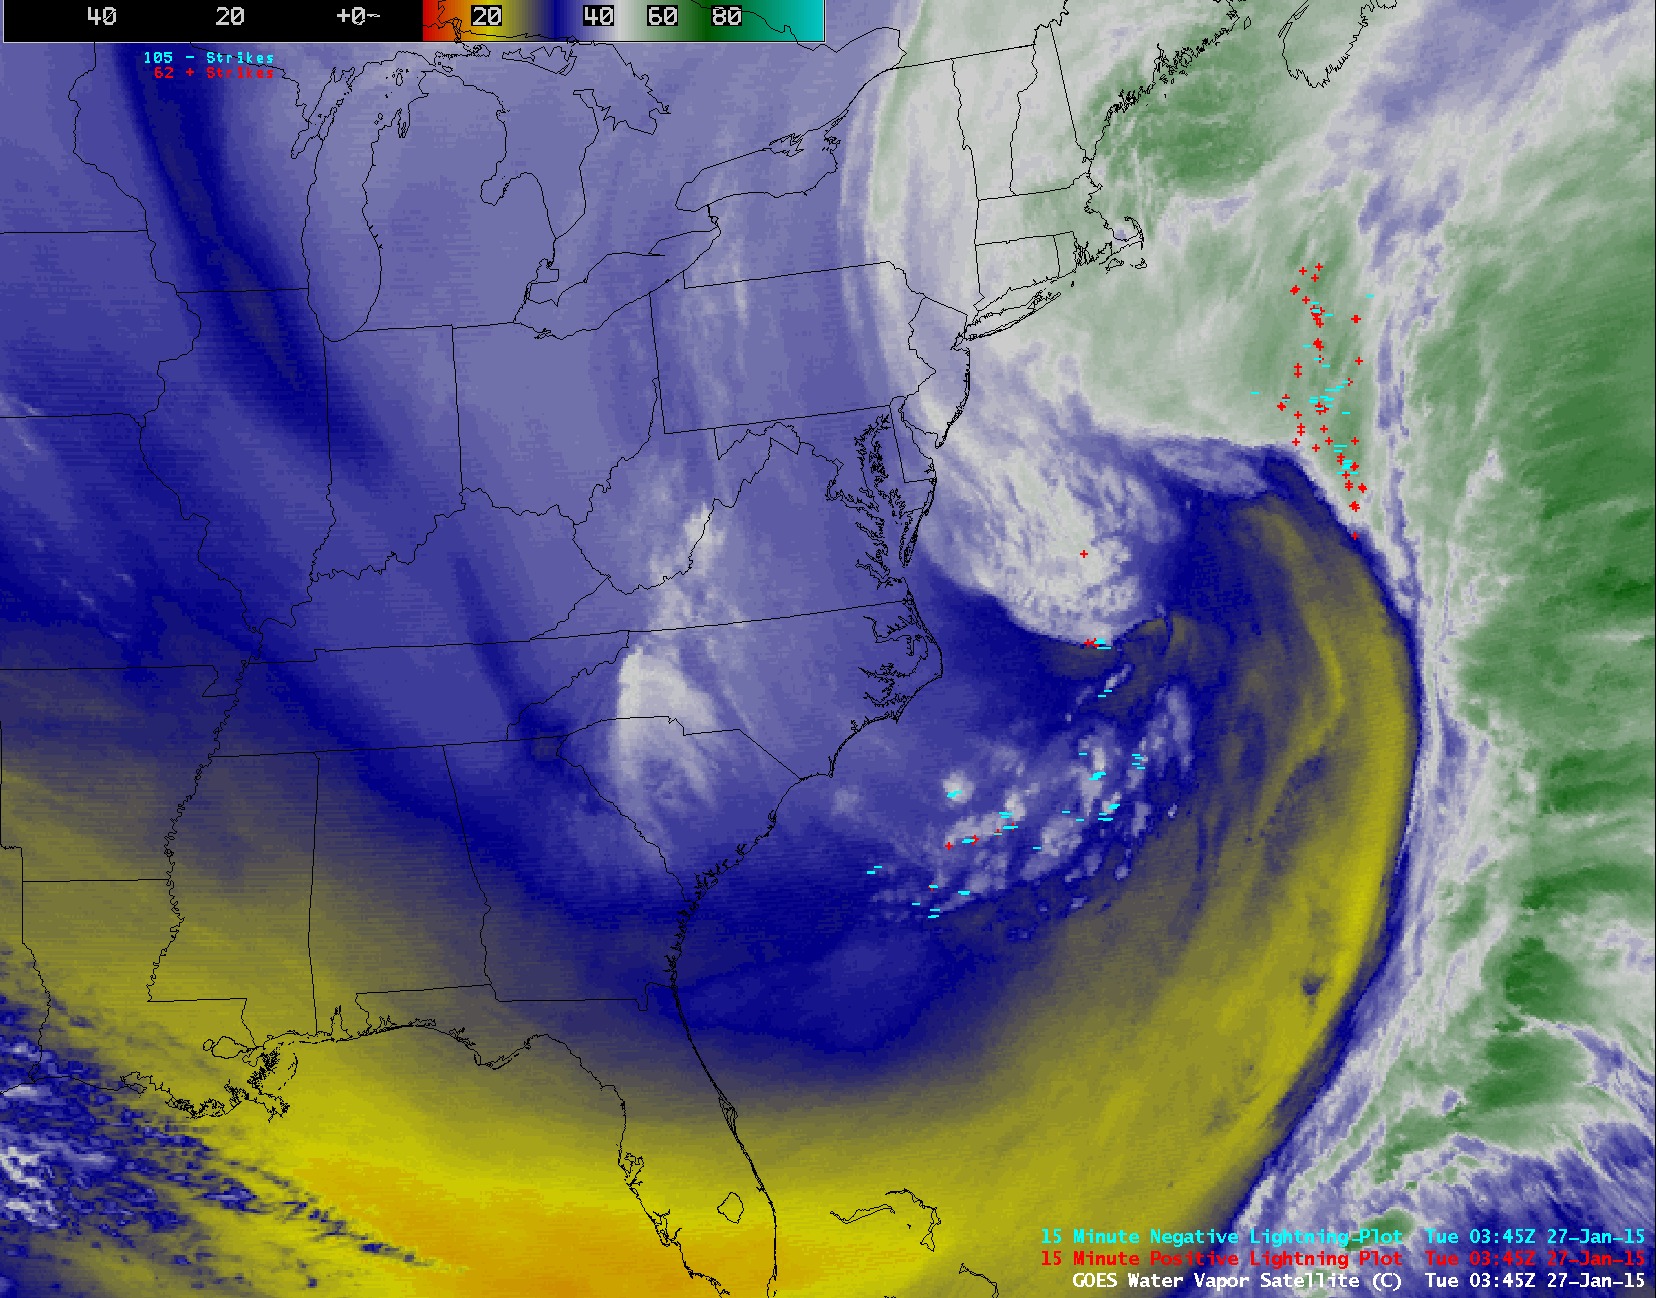
GOES-13 6.5 µm water vapor channel images (click to play animation)]
Suomi NPP VIIRS 11.45 µm IR channel and 0.64 µm visible channel images (below) showed that there was a great deal of convective banding within the secondary warm conveyor belt.
Suomi NPP VIIRS 11.45 µm IR channel and 0.64 µm channel images, with lightning, surface fronts and METAR reports
Total Column Ozone is frequently used as a proxy of tropopause folding; tropopause folds accompany very strong storm development and the vertical circulation associated with the potential vorticity anomaly (maximum) associated with the folding draws stratospheric ozone down into the troposphere. GOES Sounder Total Column Ozone derived product images (below; click to play animation; also available as an MP4 movie file) show that the dynamic tropopause — taken to be the pressure of the PV1.5 surface, red contours — descends below the 400-450 hPa level along the southern gradient of the higher ozone values (green to red color enhancement) as the potential vorticity anomaly pivots eastward along the Gulf Coast states and then northeastward toward the intensifying storm. The presence of clouds prevented ozone retrievals over many areas, but some ozone values over 400 Dobson Units (red color enhancement) could be seen, which is characteristic of stratospheric air.
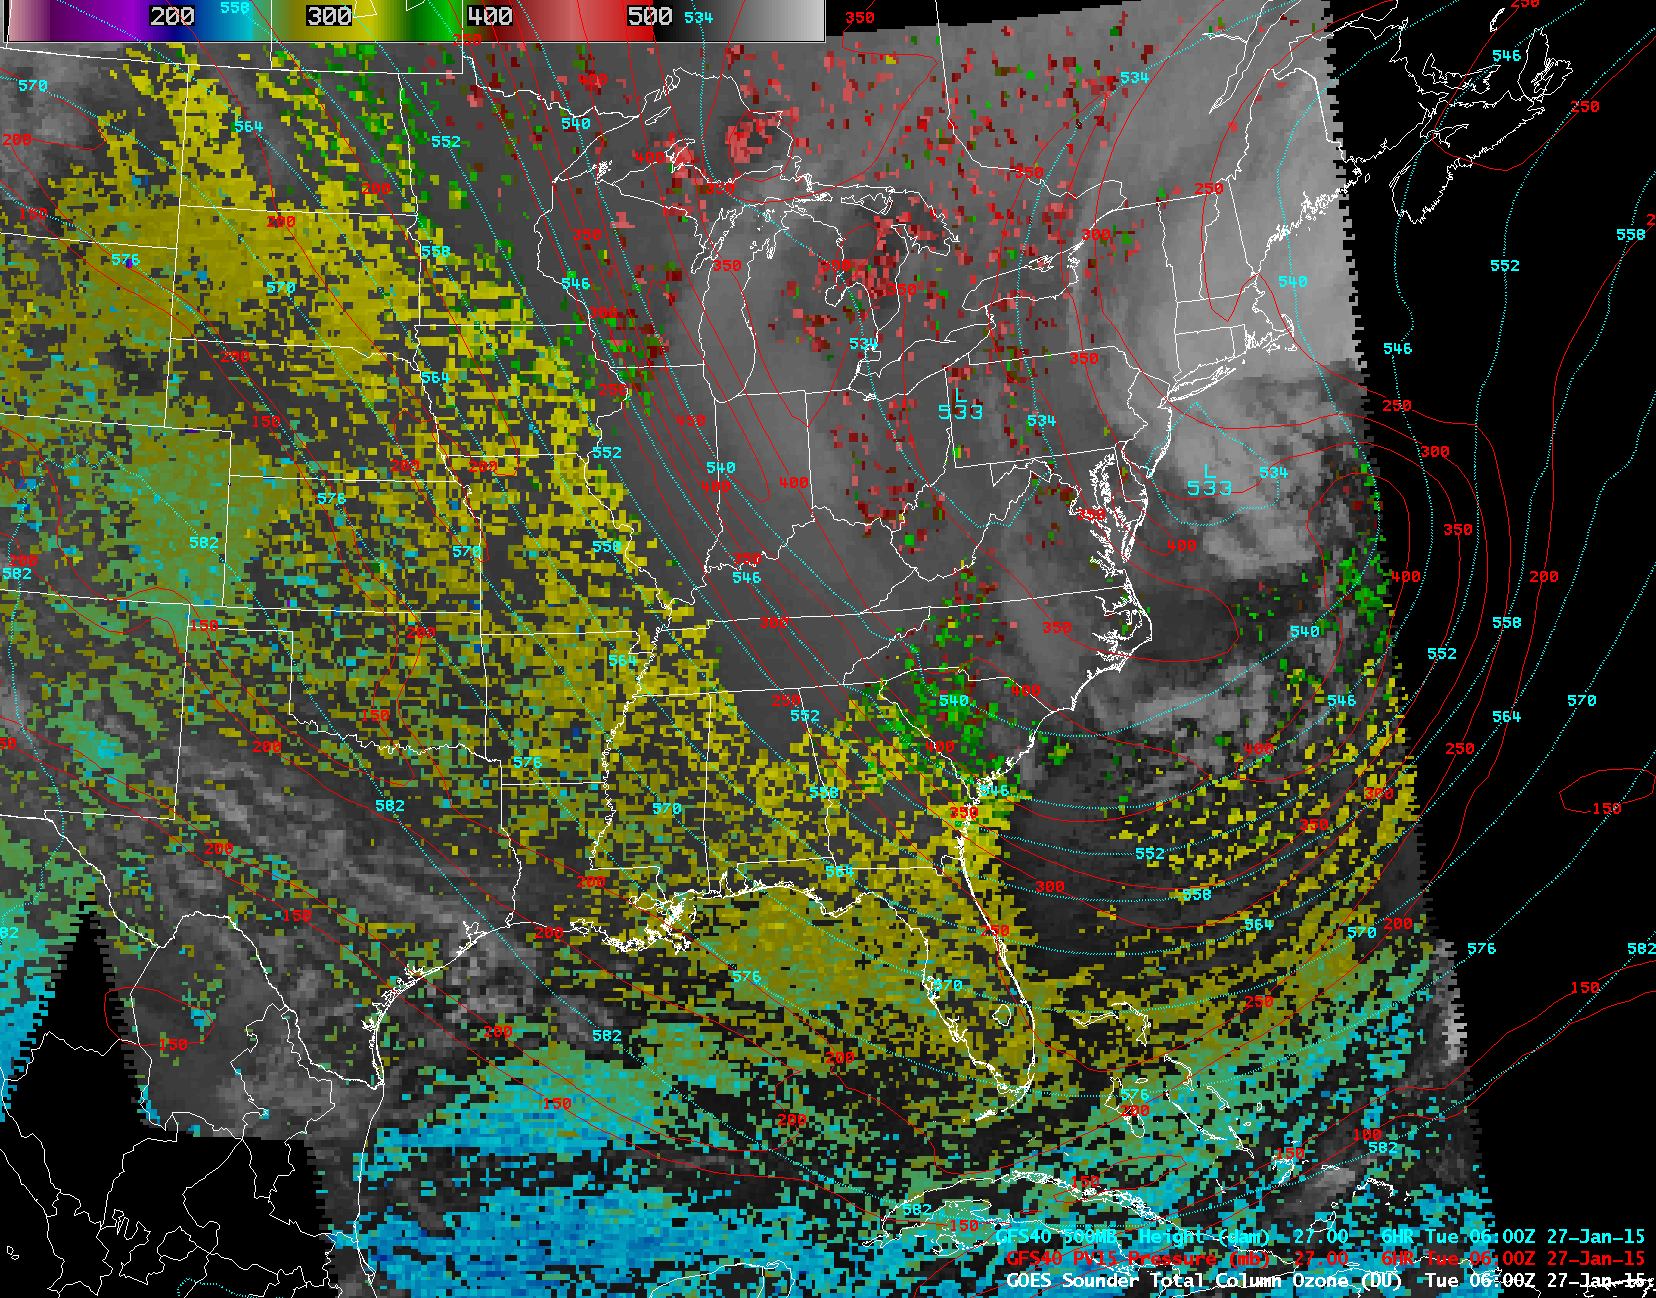
GOES Sounder Total Column Ozone derived product images (click to play animation)
As the storm approached New England, a MODIS 11.0 µmIR channel image (below) revealed the presence of widespread embedded convective elements within the broad cloud shied, with some cloud-top IR brightness temperatures as cold as -65ºC (darker red color enhancement). These pockets of convection could enhance snowfall rates once they moved inland.
MODIS 11.0 µm IR channel image, with lighting strikes, METAR surface reports, and fixed buoy reports
An overlay of the RTMA surface winds (below) helped to locate the position of the surface low east of the Delmarva Peninsula. That position agrees well with ASCAT winds from 0158 UTC on 27 January.

MODIS 11.0 µm IR channel image, with RTMA surface winds
A comparison of Suomi NPP VIIRS 0.7 µm Day/Night Band (DNB) and 11.45 µm IR channel images at 06:39 UTC or 1:39 AM Eastern time is shown below. With illumination from the Moon in the Waxing Gibbous phase (at about 60% of Full), the DNB provided a “visible image at night” which showed the expansive offshore “comma cloud” of the storm, along with the locations of bright cloud illumination from dense lightning activity (note the bright lightning signature east of Cape Cod, which corresponded well with a cluster of positive cloud-to-ground lightning strokes). Numerous pockets of convective development were seen well off the coast of North and South Carolina, due to strong cold air advection over the warm waters of the Gulf Stream.
Suomi NPP VIIRS 0.7 µm Day/Night Band and 11.45 µm IR channel images (with cloud-to-ground lightning strikes)
View only this post
Read Less


