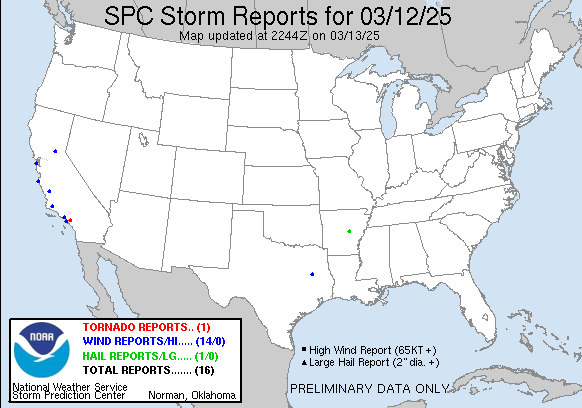
Early this morning at around 3:15 AM local time, an EF-0 tornado touched down in Pico Rivera, a community in Los Angeles County, California. It damaged several homes and knocked down numerous trees over the course of its mile-long path. Numerous instances of damaging winds were also reported, as seen on the NOAA SPC Storm Reports page. Fortunately, there were no reports of injuries.
Tornadoes in Los Angeles County are comparatively rare, but not unheard of. This is the 50th recorded tornado in the county since 1950, and every month of the year has had at least one tornado report. The peak season for LA County tornadoes is winter and spring with more tornadoes recorded in January than any other month; with today’s event, March is now tied for second on that list. The NOAA NCEI Storm Events Database is an invaluable tool for analyses like these.
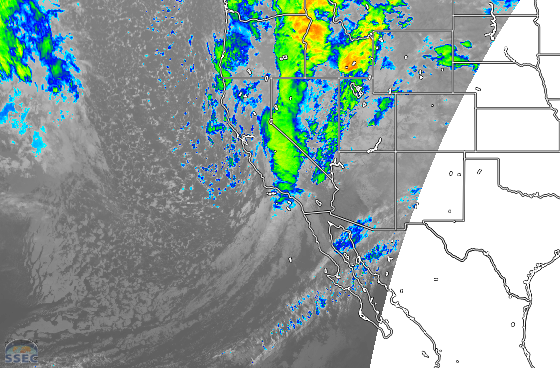
This particular storm event was driven by an advancing cold front linked to a low pressure system offshore. A steady stream of moist air from the Pacific ensured sufficient moisture to support convection. That is evident in the GOES-18 Band 8 upper level water vapor imagery, which shows a plume of moisture pointed directly at the greater Los Angeles area.
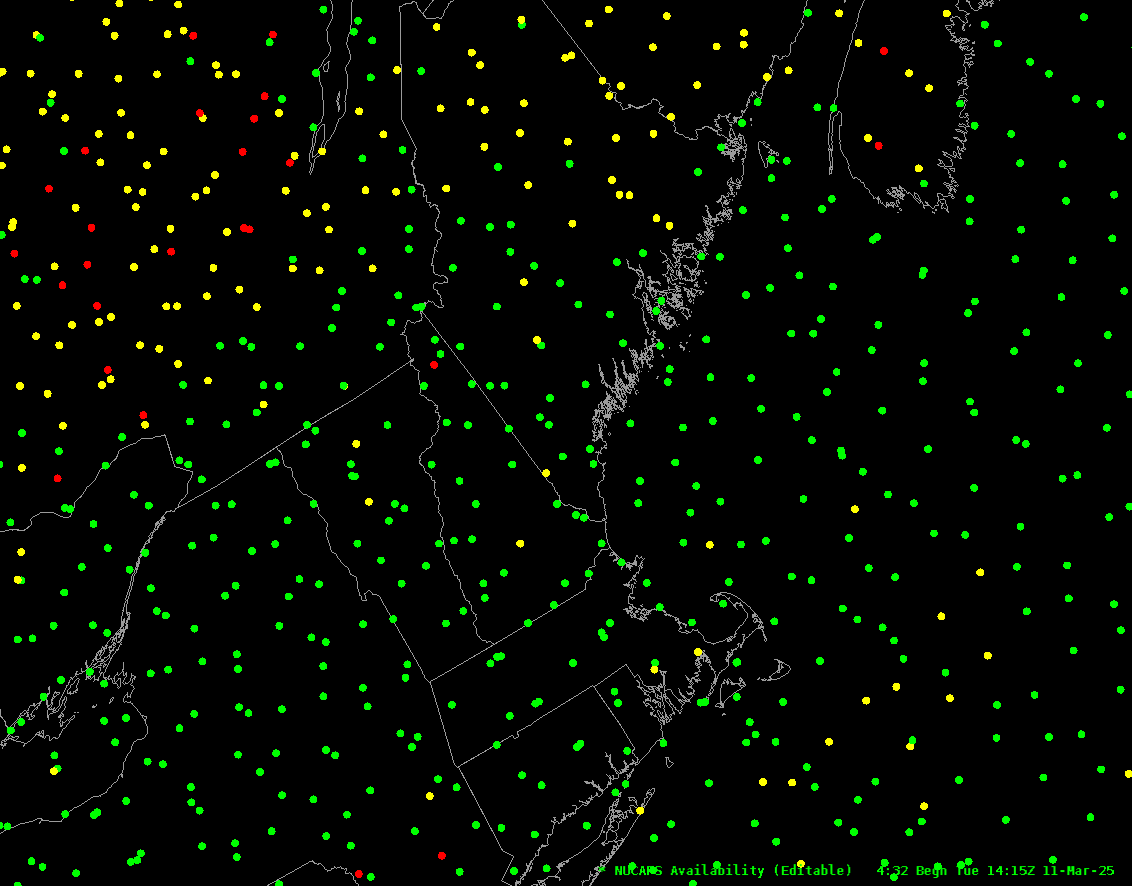
A polar-orbiting overpass at 0930 UTC (2:30 AM local time, approximately 45 minutes before tornadogenesis) provided Gridded NUCAPS observations. The 700-500 mb lapse rate product from Gridded NUCAPS shows lapse rates over LA County to be close to the critical conditionally unstable value of 6.0 C/km, with more unstable air aloft coming onshore from the south. The elevated lifting from the advancing front coupled with the elevated instability was enough to support deep convection.

Forecasters anticipated the potential weather overnight and the GOES-18 mesoscale sector was active for this event, providing images every minute. Since it was nighttime, none of the products that depend on shortwave channels were available, but many interesting things can be discerned from the longwave imagery. The Channel 13 IR window view shows the cold cloud top temperatures associated with the deep, moist convection, while the speckled orange portions of the Night Microphysics RGB help to confirm that the clouds over LA are deep, thick, and moisture-laden. Mesoscale sectors are available in AWIPS, or are freely available to everyone at SSEC RealEarth.
View only this post Read Less