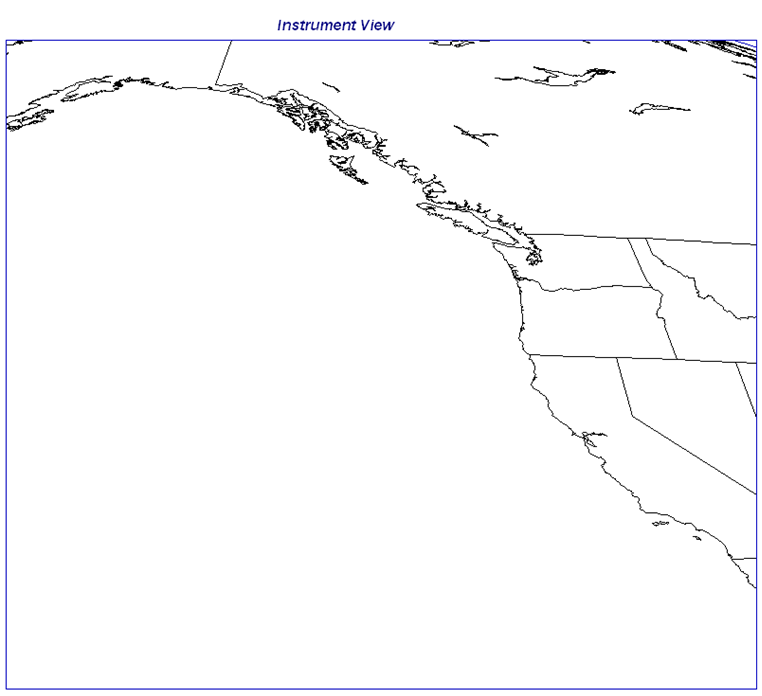
GOES-15 “Sitka” RSO Sector
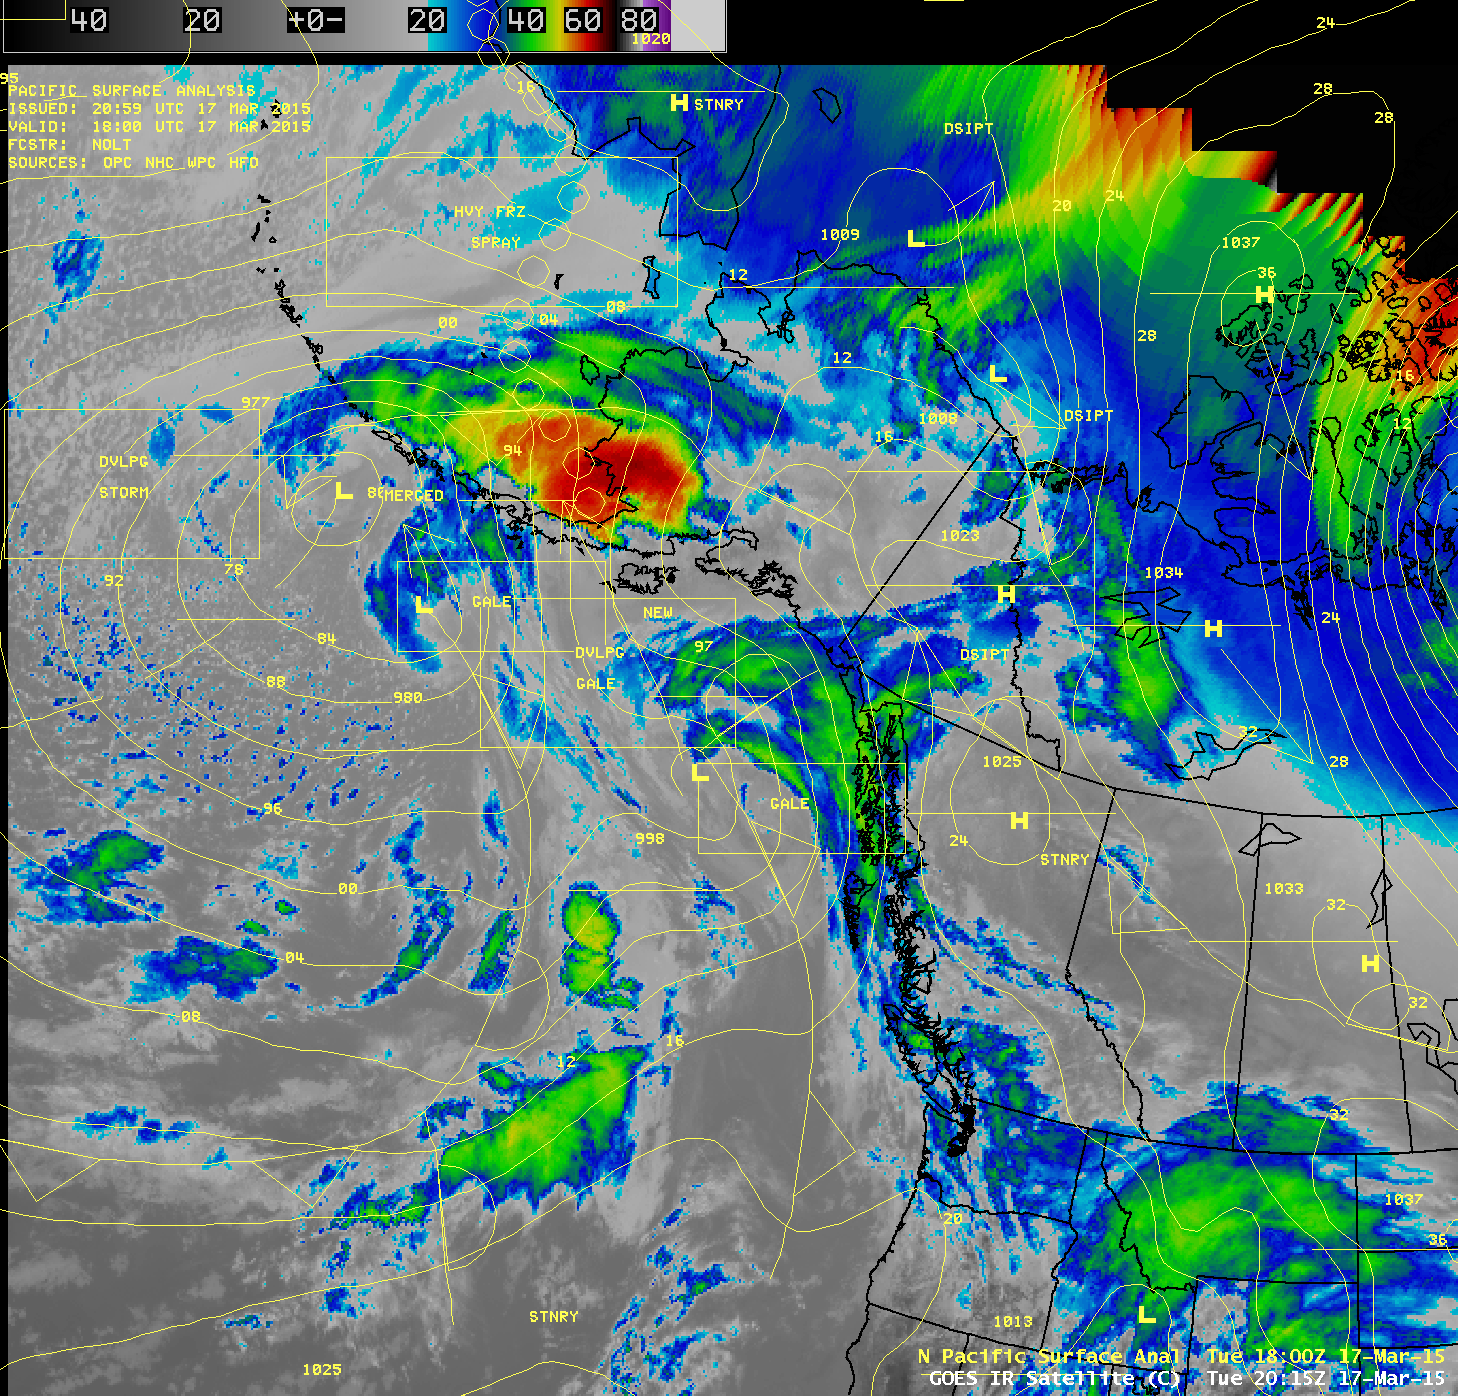
During a 4-hour period on 17 March 2015, NOAA/NESDIS conducted a test of two special GOES-15 (GOES-West) Rapid Scan Operations (RSO) sectors for the Alaska Region. From 16:00 to 18:00 UTC, the test was conducted for the “Sitka” sector (above) — and GOES-15 0.63 µm visible channel images over a portion of that sector (below; click image to play animation) showed the circulation of a mid-latitude cyclone that was producing gale force winds in the eastern portion of the Gulf of Alaska (IR image with surface analysis), as well as clusters of deep convection which were forming along an occluded front approaching from the south.
GOES-15 0.63 µm visible images – “Sitka” sector (click to play animation)
———————————————————————————————————————–
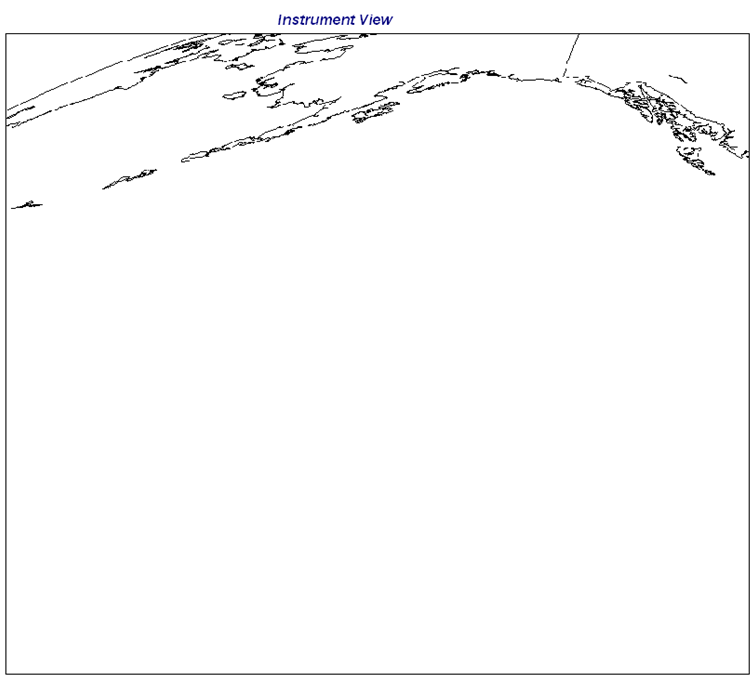
GOES-15 “TPARC” RSO sector
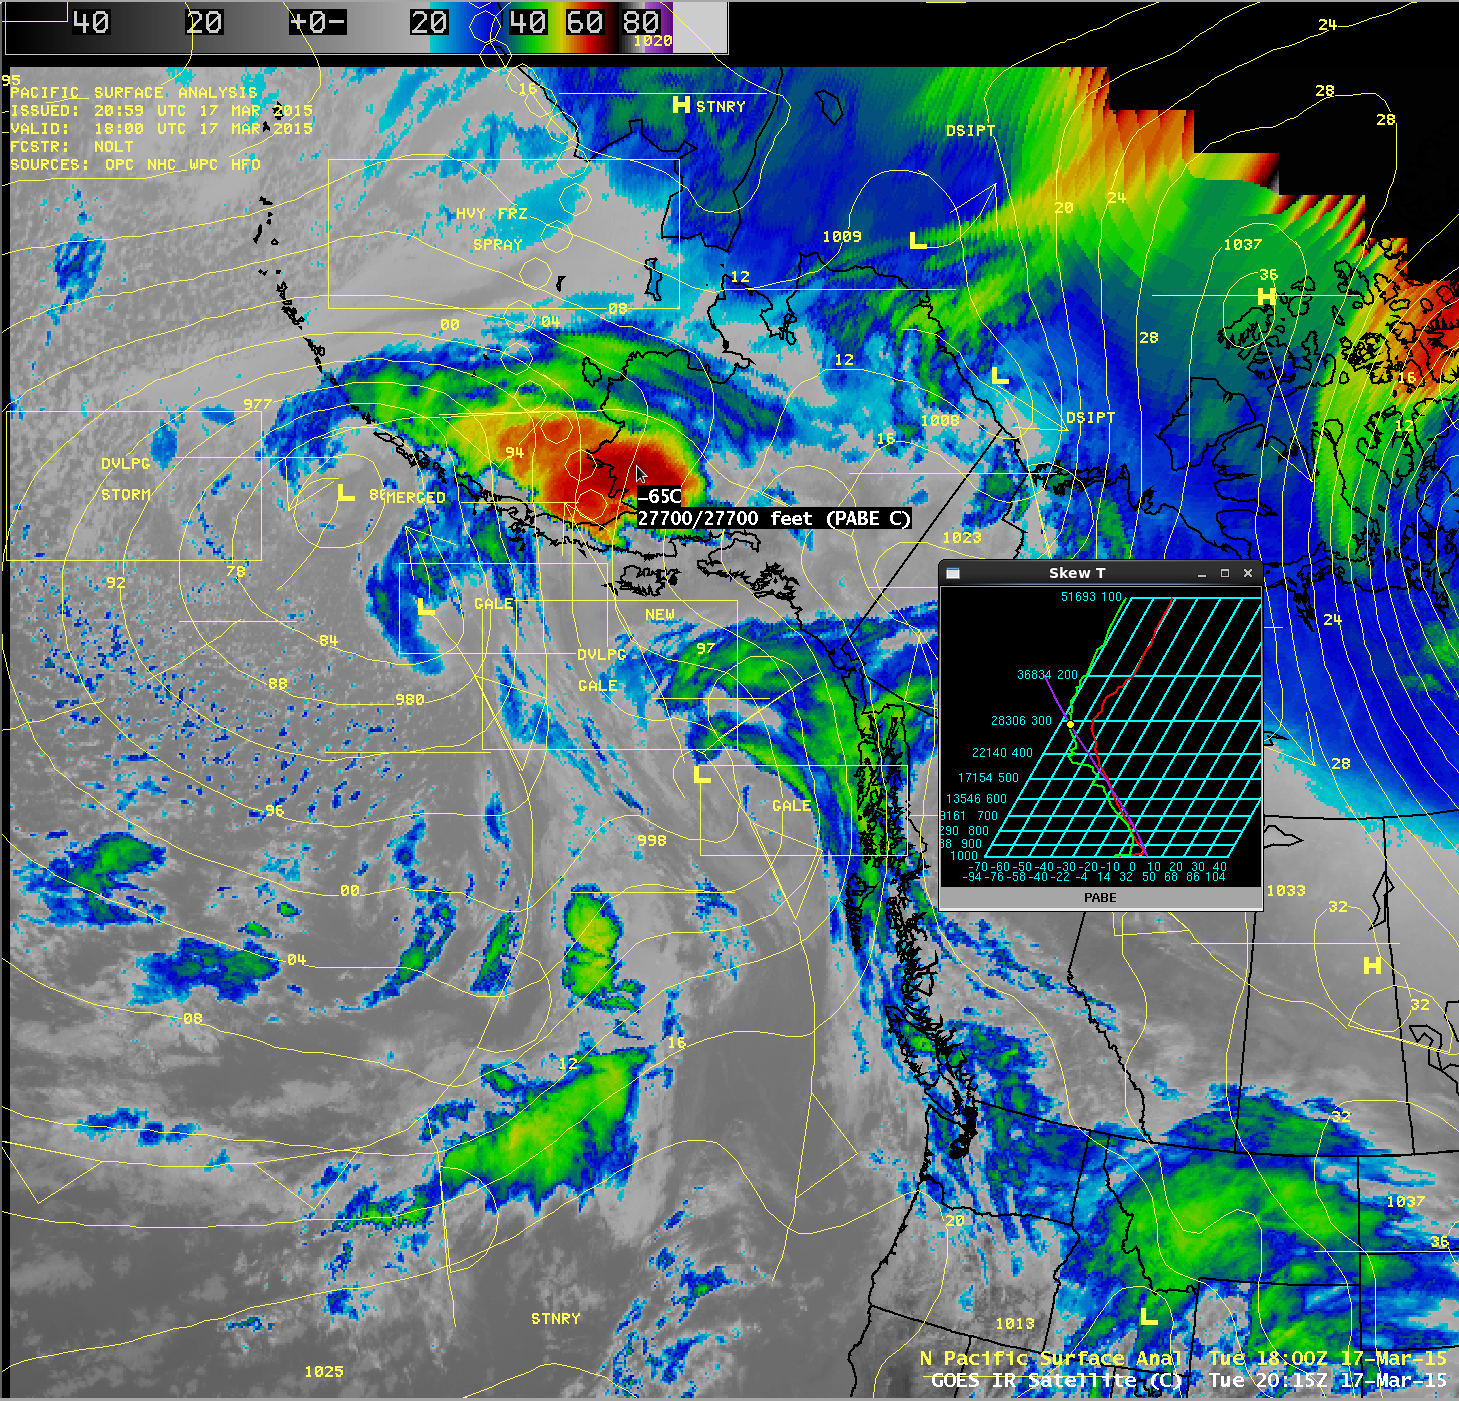
Then from 18:00 to 20:00 UTC, the RSO test was conducted for the “TPARC” sector (above) — and GOES-15 0.63 µm visible channel images (below; click image to play animation) showed the circulation of two cyclones south of the Aleutian Islands, in addition to a large “banner cloud” and a few mountain waves which had formed downwind (to the north) of the rugged terrain of the Alaska Peninsula and the Aleutian Islands. GOES-15 IR brightness temperatures associated with the banner cloud were as cold as -65 C, which according to the nearby Bethel, Alaska rawinsonde data at 12 UTC corresponded to an altitude of around 27,700 feet (IR image with Bethel Skew-T and surface analysis).
GOES-15 0.63 µm visible channel images – “TPARC” sector (click to play animation)
Regarding the Alaska Peninsula banner cloud seen on the GOES-15 visible images, a sequence of Terra/Aqua MODIS 11.0 µm and Suomi NPP VIIRS 11.45 µm IR images (below; click image to play animation) showed the evolution of this feature several hours before and after the RSO test. There were a few pilot reports of moderate turbulence, at altitudes as high as 36,000 feet – and some of these pilot reports specifically mentioned “MNT WAVE” in their remarks.
Suomi NPP VIIRS 11.45 µm IR image (click to play animation of VIIRS and MODIS IR images)
The CLAVR-x POES AVHRR Cloud Top Height product (below; click image to play animation) indicated that the banner cloud reached heights of 9 km (darker green color enhancement).
POES AVHRR Cloud Top Height product (click to play animation)
View only this post Read Less

