Severe thunderstorms developed in the vicinity of a quasi-stationary frontal boundary which stretched from northeastern Oklahoma into northern Arkansas and southern Missouri late in the day on 25 March 2015. A plot of the SPC... Read More
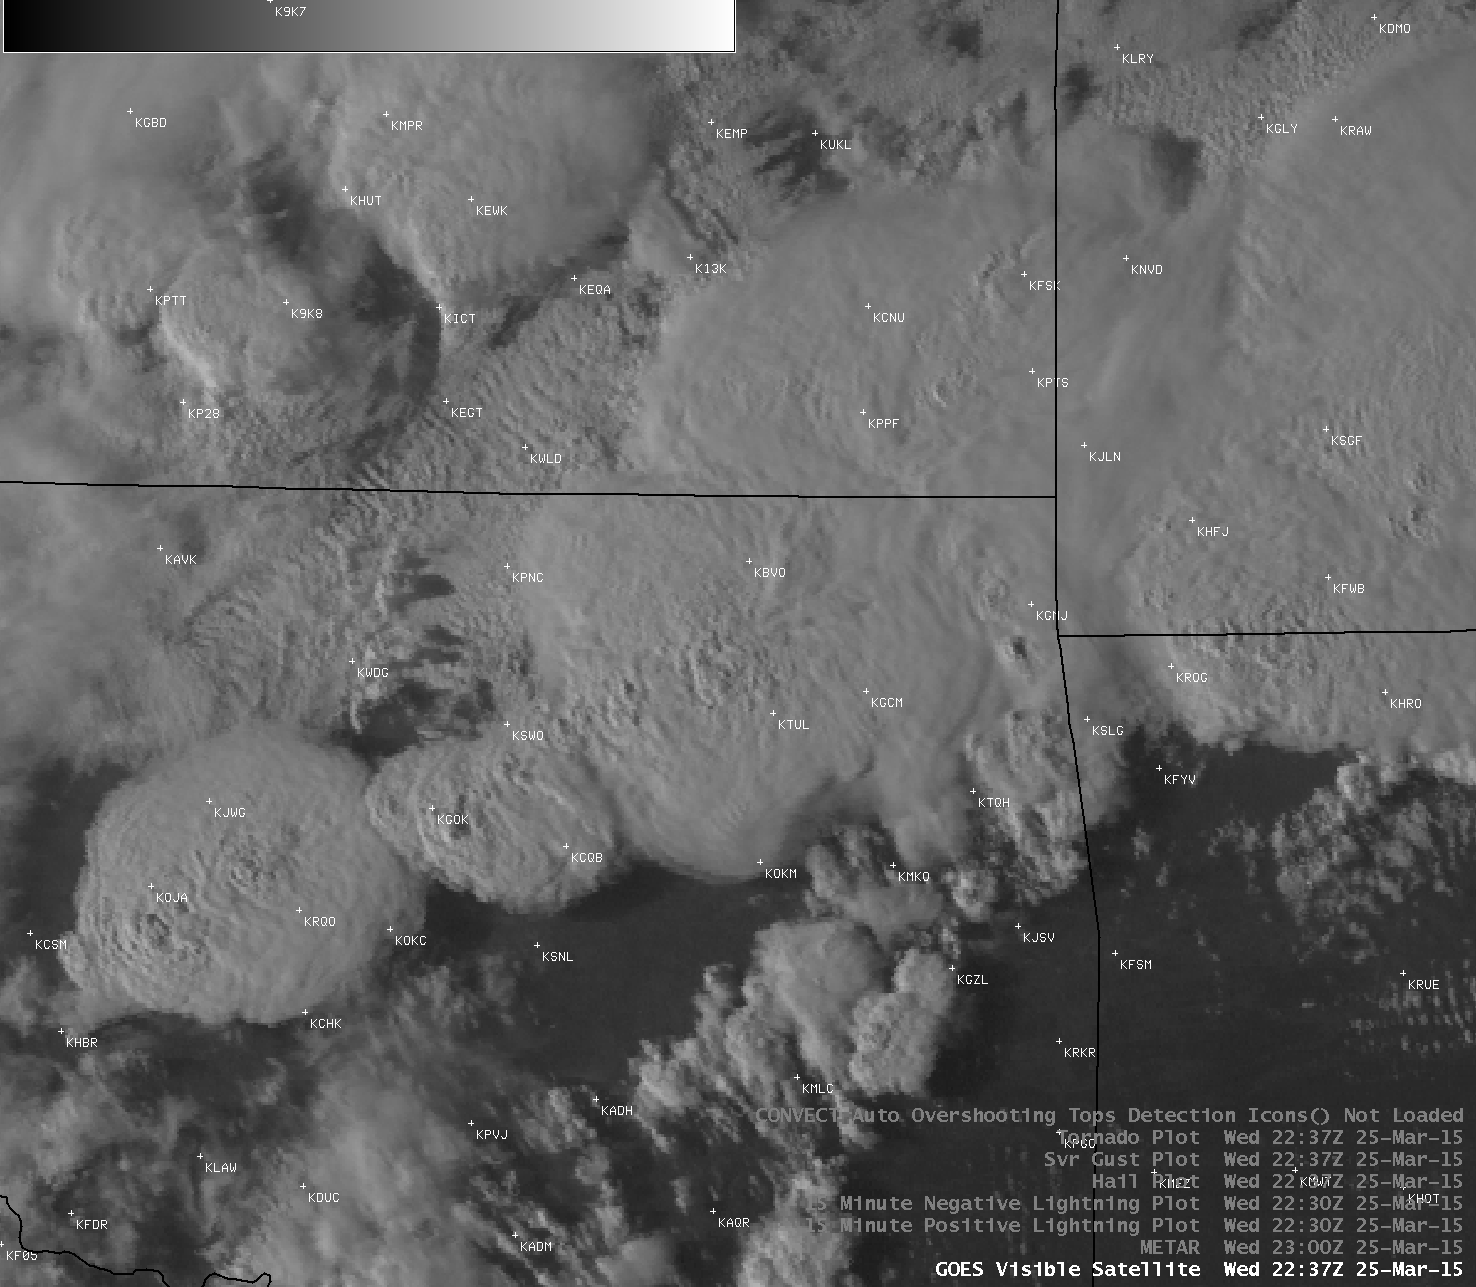
GOES-13 0.63 µm visible channel images (click to play animation)
Severe thunderstorms developed in the vicinity of a quasi-stationary frontal boundary which stretched from northeastern Oklahoma into northern Arkansas and southern Missouri late in the day on 25 March 2015. A plot of the SPC storm reports shows that these storms produced widespread large hail, damaging winds, and tornadoes — including the first tornado-related fatality of 2015 at a trailer home park near Sand Springs, Oklahoma (just west/southwest of Tulsa). Storm reports also included hail as large as 4.25 inches in diameter, and wind gusts as high as 80 mph. 1-km resolution GOES-13 (GOES-East) 0.63 µm visible channel images (above; click image to play animation) showed the development of numerous thunderstorms across the region, some of which grew to be very large discrete supercells late in the afternoon and toward sunset. The tell-tale signature of cloud-top shadows from small-scale “overshooting tops” could be seen with many of these storms, indicating the presence of vigorous updrafts which penetrated the thunderstorm top (and likely the tropopause). Also note the presence of parallel bands of stable wave clouds over parts of northeastern Kansas and northwestern Arkansas: these clouds highlighted areas where boundary layer warm air advection was over-running shallow pockets of cool, stable air north frontal boundary.
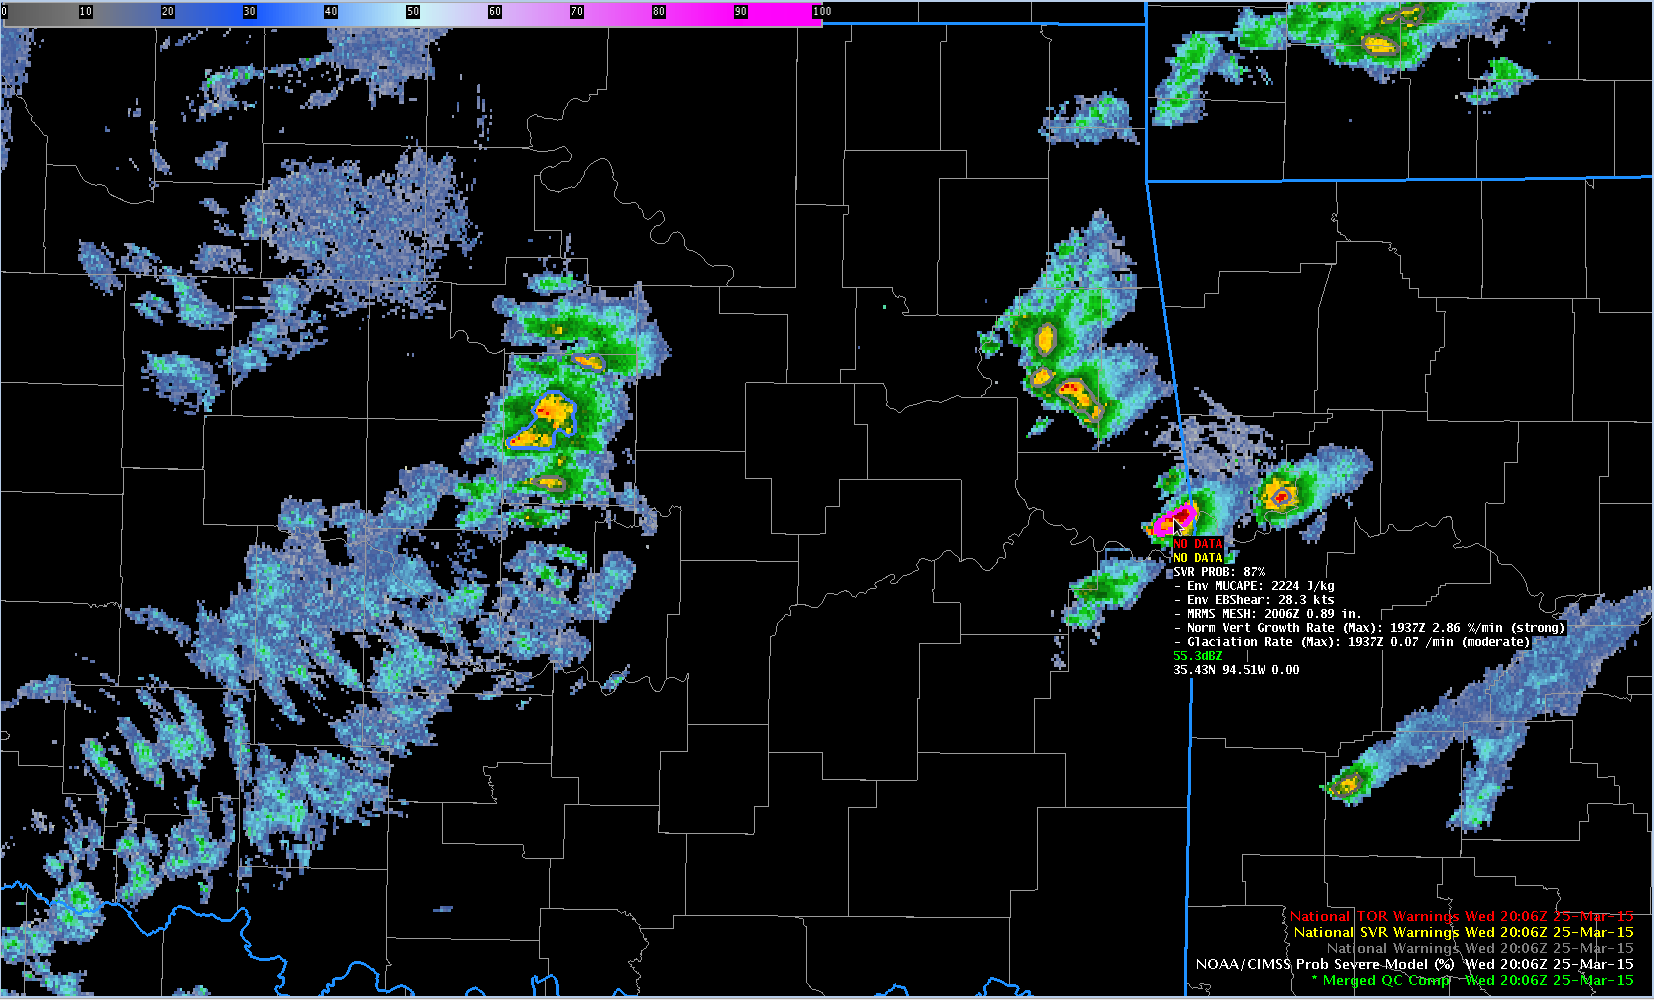
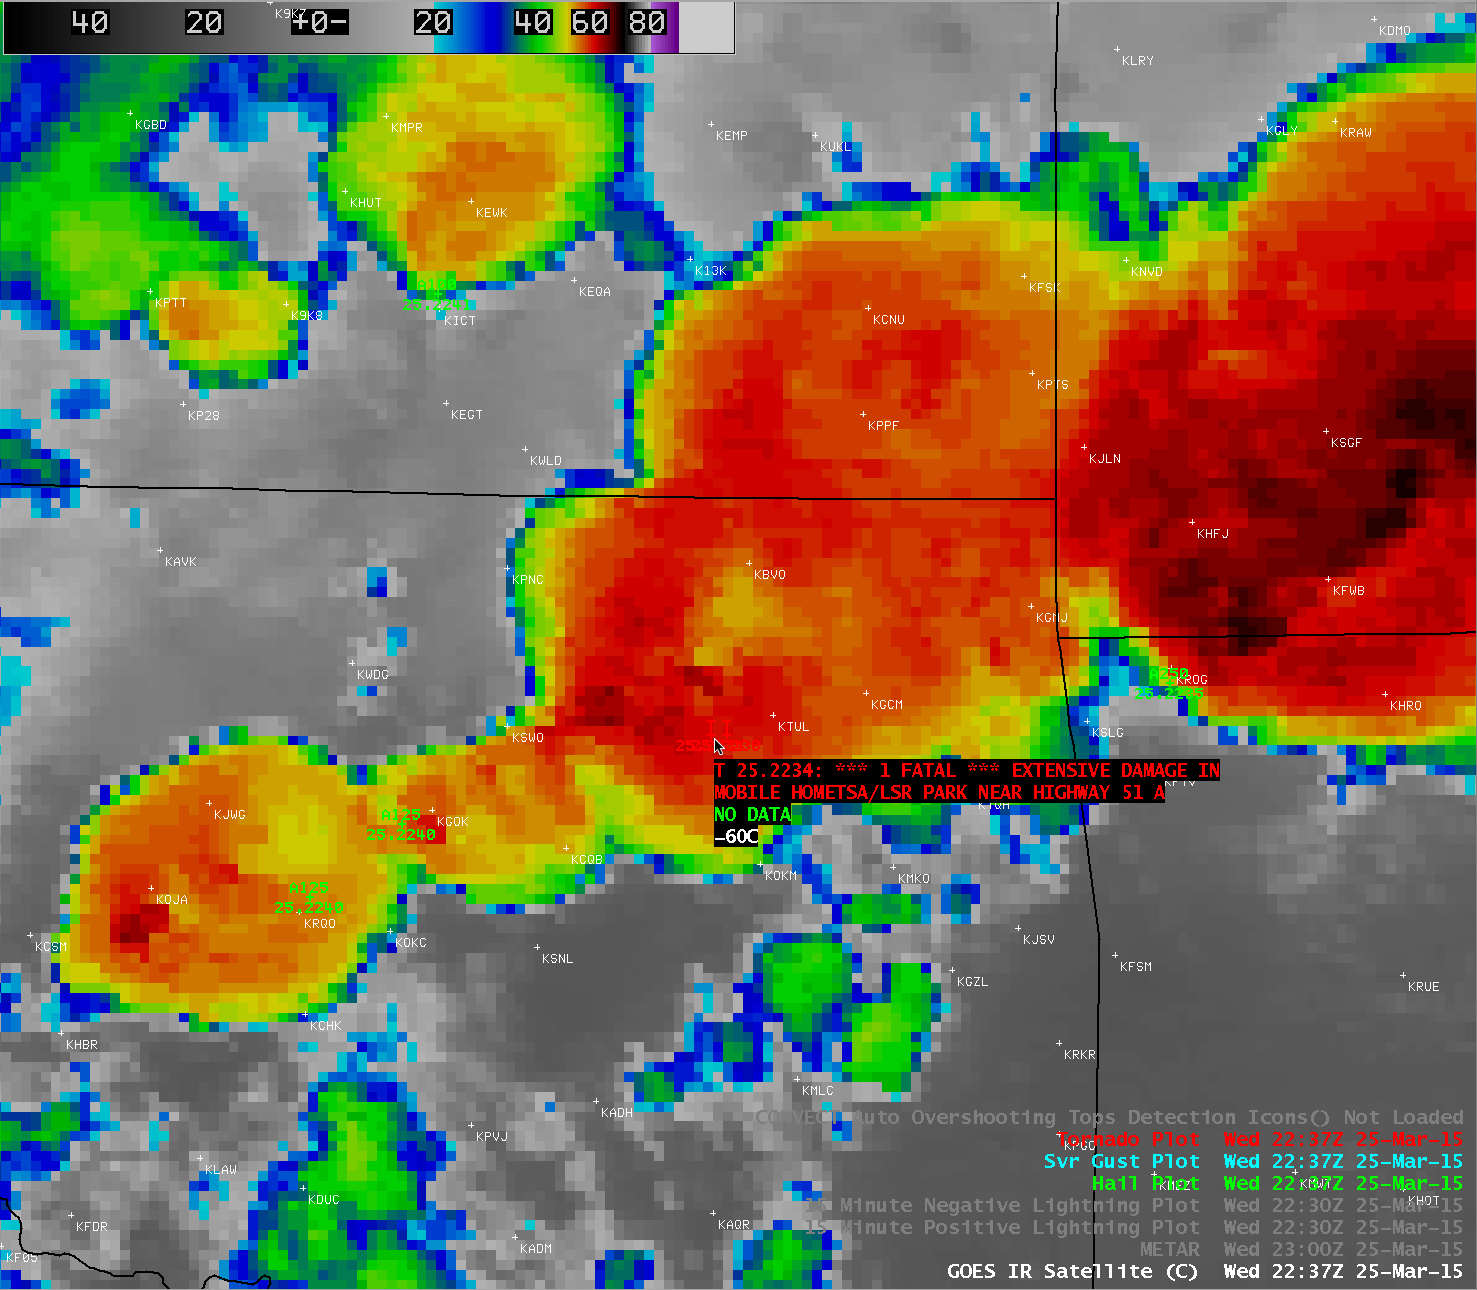
The corresponding 4-km resolution GOES-13 10.7 µm IR channel images (below; click image to play animation) revealed very cold cloud-top IR brightness temperatures (as cold as -71º C, dark black color enhancement), along with the formation of a well-defined Enhanced-V/Thermal Couplet (EV/TC) signature with the storm that produced large hail, damaging winds, and the fatal tornado southwest of Tulsa (station identifier KTUL). The EV/TC signature was first evident on the 22:00 UTC IR image, with cold/warm thermal couplet values of -65º/-53º C; the maximum thermal couplet spread was at 22:25 UTC, with -71º/-52º C, after which time the minimum IR brightness temperatures of the overshooting tops then began a warming trend: -67º C at 22:30 UTC, and -64º C at 22:37 UTC (suggesting a collapse of the vigorous updraft and overshooting top). Note that the storm-top EV/TC signature was displaced to the northwest of the surface hail/wind/tornado storm reports just west of Tulsa, due to parallax resulting from the large satellite viewing angle of GOES-East (which is positioned over the Equator at 75º W longitude). In addition, see the bottom of this blog post for examples of the NOAA/CIMSS ProbSevere product applied to these storms.
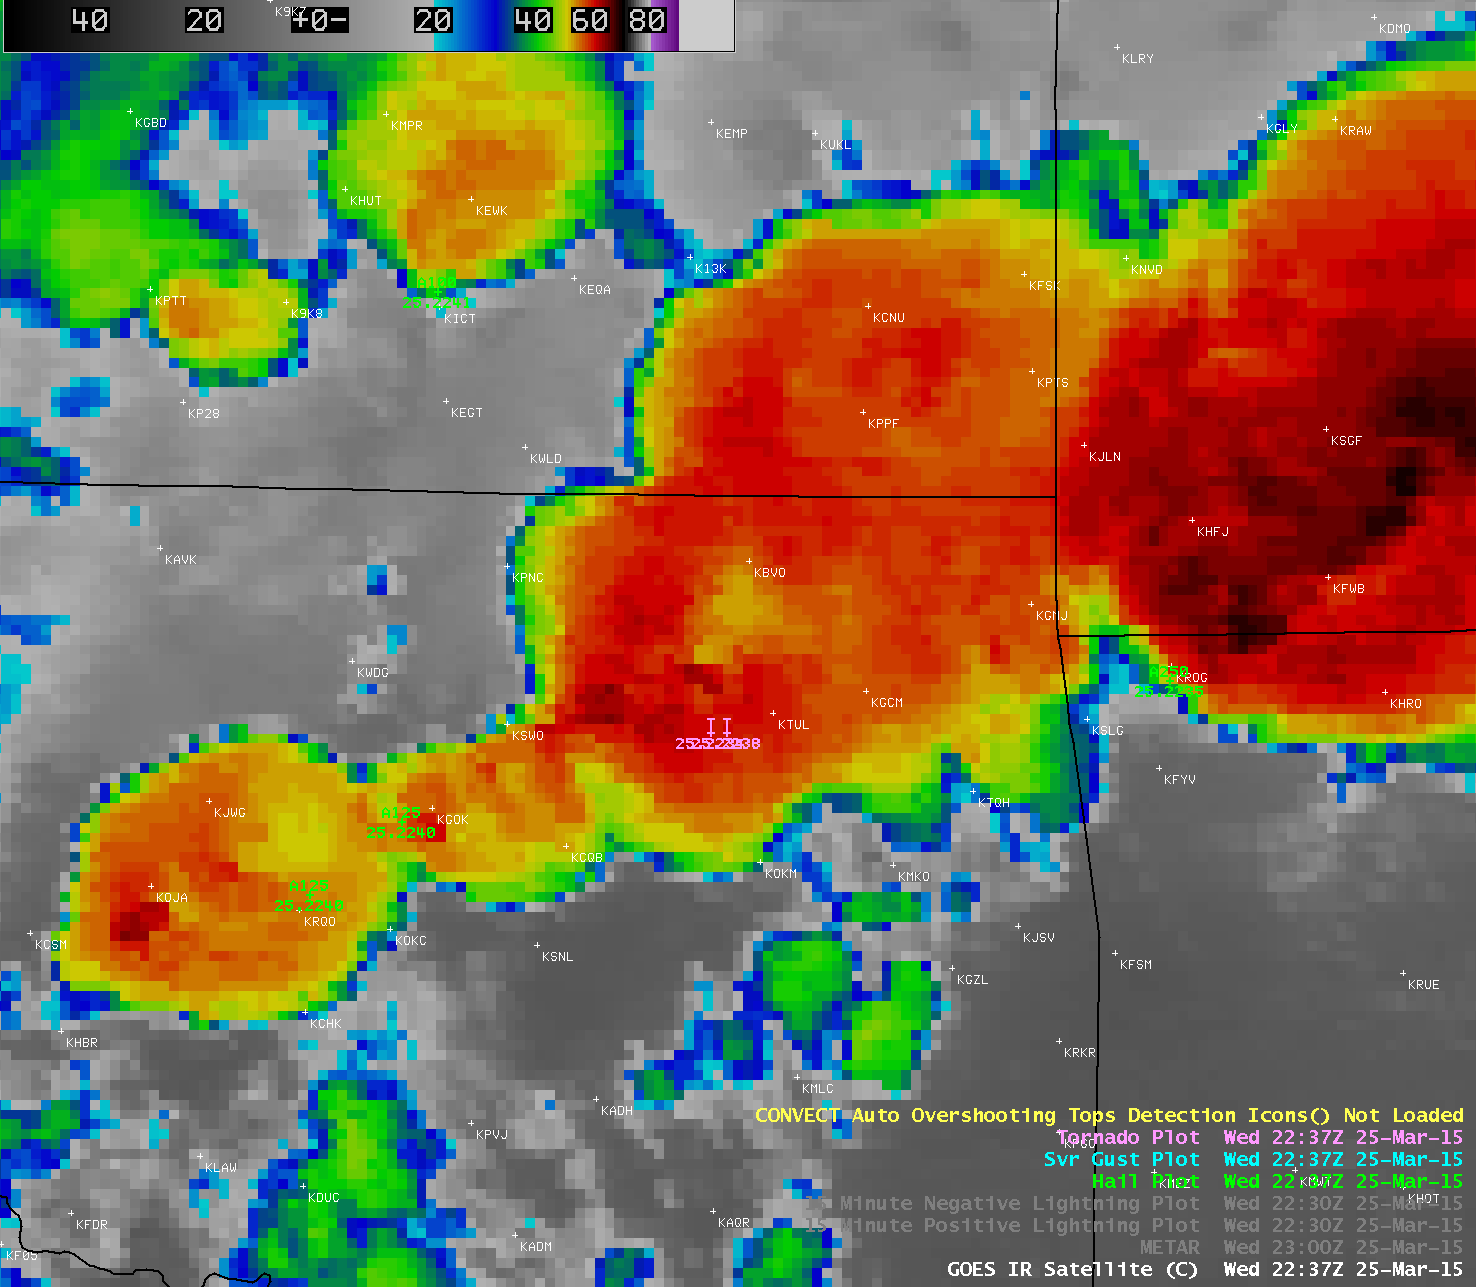
GOES-13 10.7 µm IR channel images (click to play animation)
Automated overshooting top (OT) detection icons (small yellow thunderstorm symbols) are also plotted on the GOES-13 IR images. The initial OT detections began at 20:15 UTC, over the general area where there was later a report of 1.0-inch diameter hail at 20:40 UTC. A comparison of the 4-km resolution GOES-13 10.7 µm IR image at 20:15 UTC with a 375-meter (projected onto a 1-km AWIPS grid) Suomi NPP VIIRS 11.45 µm IR image at 20:16 UTC (below) demonstrates (1) the advantage of improved spatial resolution for detecting the minimum cloud-top IR brightness temperature of thunderstorm overshooting tops (-60º C with GOES, vs -75º C with VIIRS), and (2) minimal parallax effect with polar-orbiting satellite imagery such as that from Suomi NPP, for more accurate geolocation of such potentially important storm features.
GOES-13 10.7 µm IR and Suomi NPP VIIRS 11.45 µm IR channel images
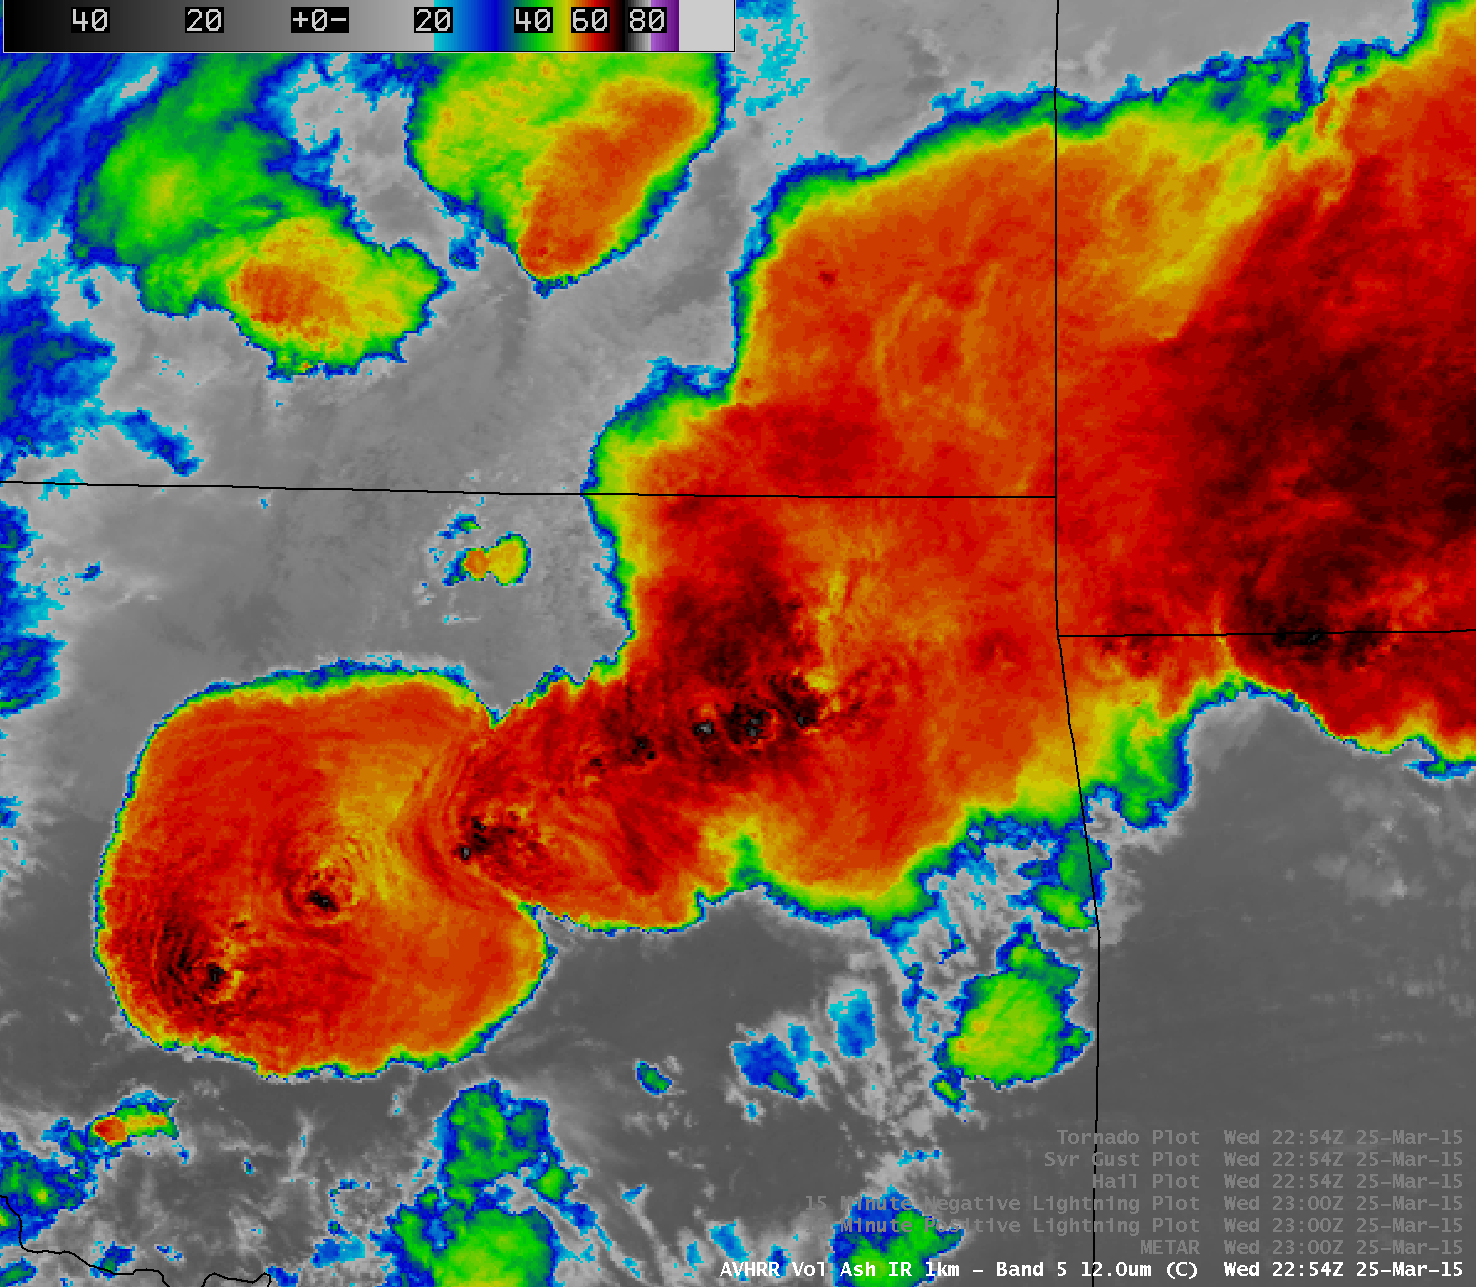
A comparison of 1-km resolution POES AVHRR 0.86 µm visible channel and 12.0 µm IR channel images (below) provided a detailed view of the storms at 22:54 UTC, which were electrically very active at that time (producing over 1900 cloud-to-ground lightning strikes in a 15-minute period). The coldest cloud-top IR brightness temperature was -77º C, located just southwest of Tulsa — this was likely the overshooting top associated with the supercell thunderstorm that produced the fatal tornado.

POES AVHRR 12.0 µm IR channel and 0.86 µm visible channel images, with METAR surface reports, lightning, and SPC storm reports
10-km resolution GOES-13 sounder Convective Available Potential Energy (CAPE) derived product images (below; click image to play animation) showed the rapid trend in destabilization of the air mass along and south of the frontal boundary, with CAPE values eventually exceeding 4300 J/kg (purple color enhancement).
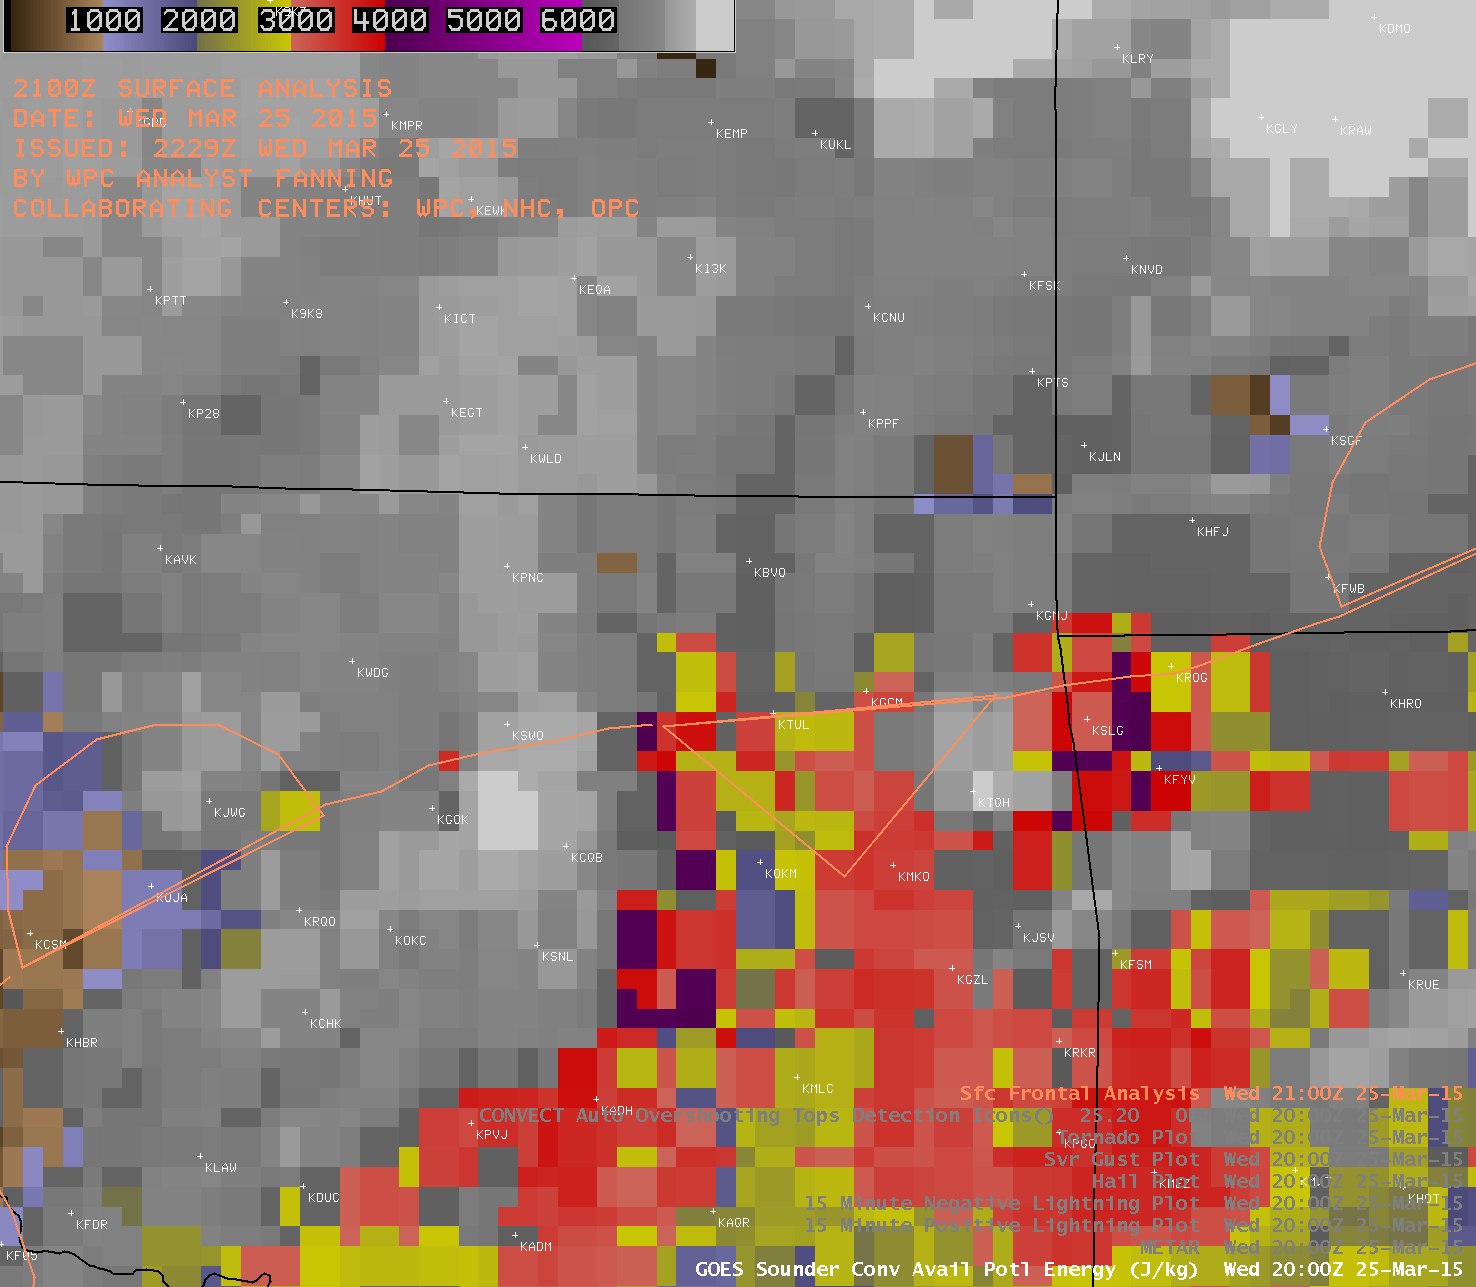
GOES-13 sounder Convective Available Potential Energy (CAPE) derived product images (click to play animaton)
10-km resolution GOES-13 sounder Total Precipitable Water (TPW) derived product images (below; click image to play animation) indicated that TPW values of 30 mm or 1.18 inch and greater (yellow enhancement) were present along and south the frontal boundary in northeastern Oklahoma.
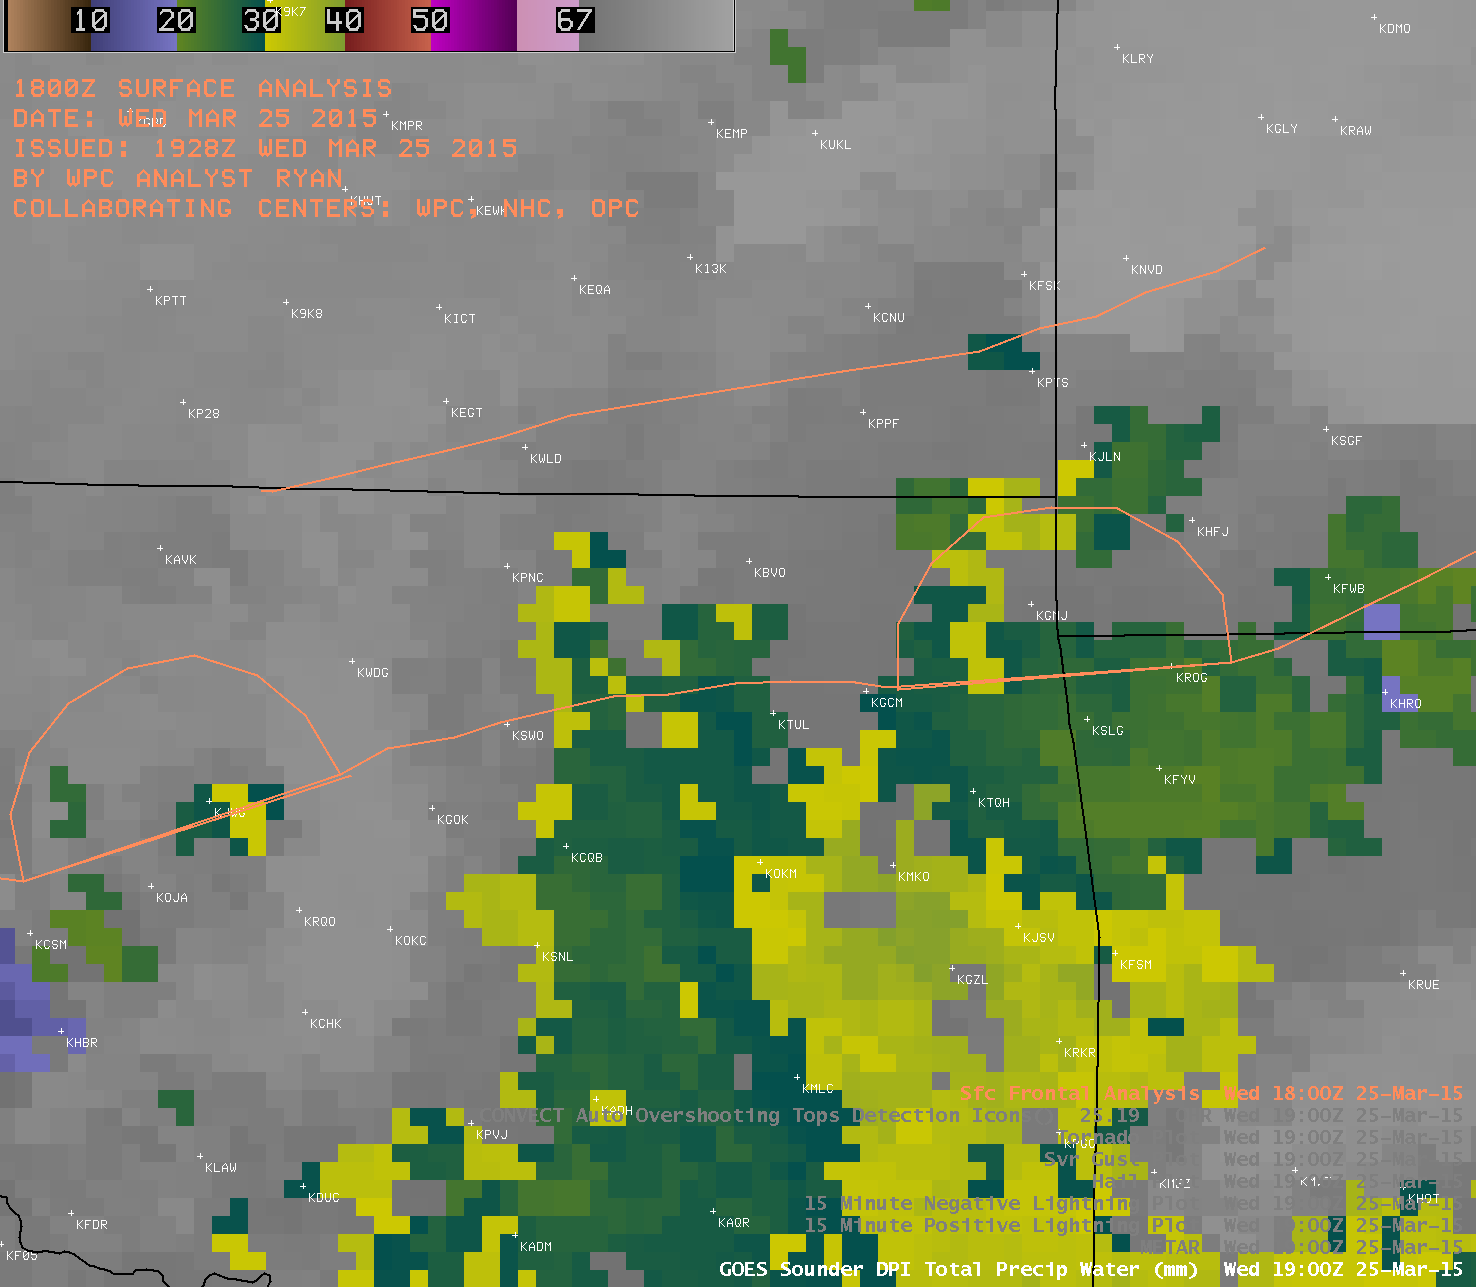
GOES-13 sounder Total Precipitable Water derived product imagery (click to play animation)
At 19:19 UTC, the 4-km resolution MODIS Total Precipitable Water derived product image (below) showed a plume of moisture with TPW values as high as 41.7 mm or 1.64 inches (red enhancement) moving toward the Tulsa area.
MODIS 0.65 um visible channel and Total Precipitable Water derived product images
Additional information about this event can be found at the NWS Tulsa and United States Tornadoes sites.
View only this post
Read Less

