
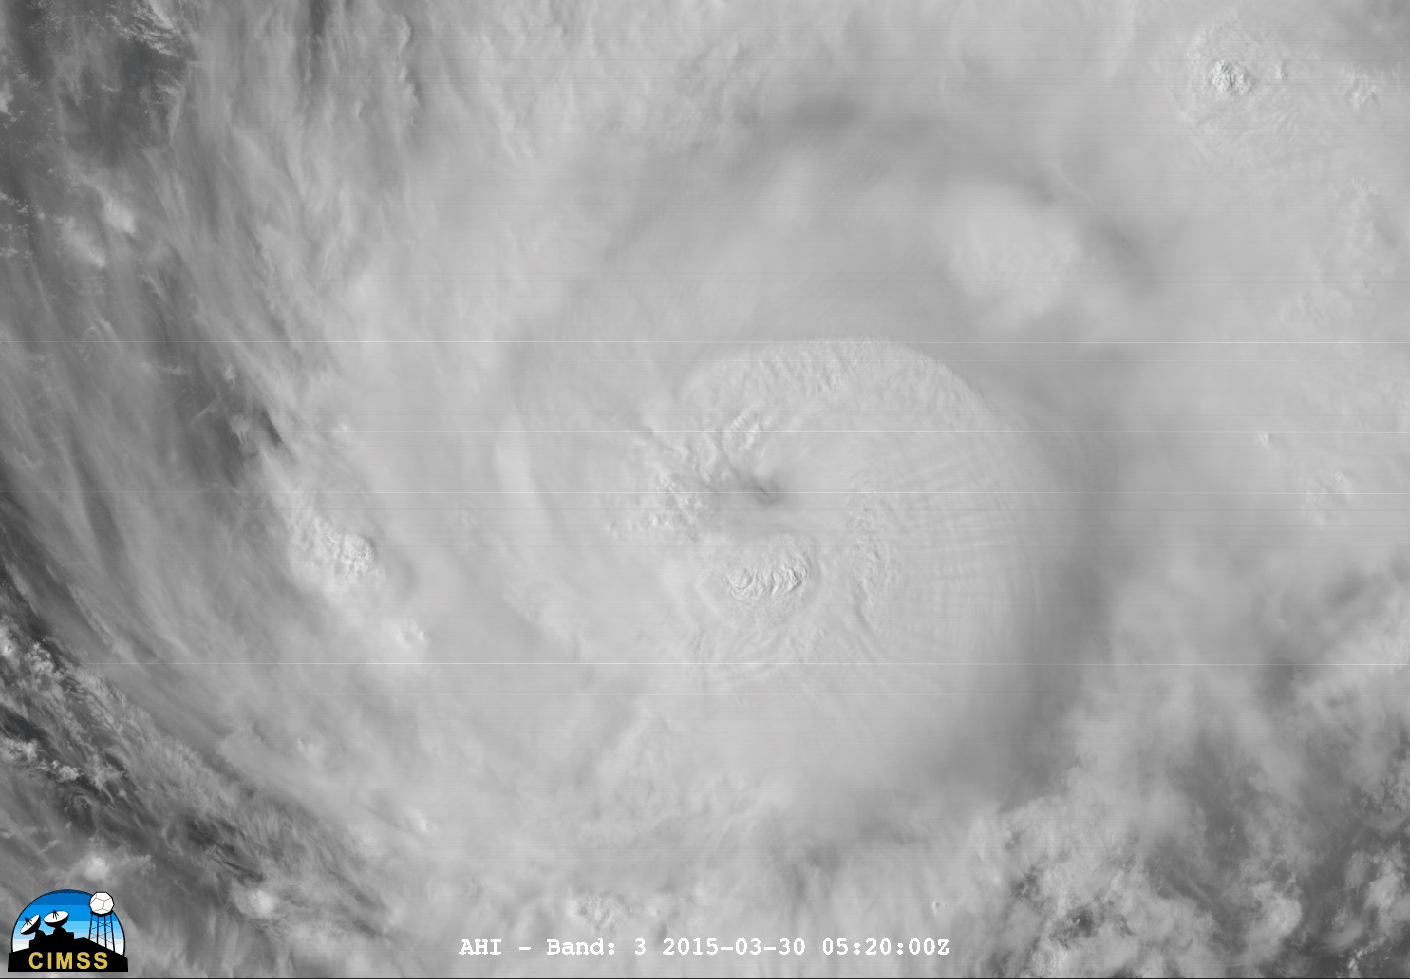
McIDAS-V images of Himawari-8 AHI 0.64 µm visible channel data (above; click image to play animation; images courtesy of William Straka, SSEC) showed the evolution of Category 2 Typhoon Maysak over the West Pacific Ocean on 30 March 2015. A number of large convective bursts can be seen surrounding the... Read More
Himawari-8 AHI 0.64 µm visible channel images (click to play animation)
McIDAS-V images of Himawari-8 AHI 0.64 µm visible channel data (above; click image to play animation; images courtesy of William Straka, SSEC) showed the evolution of Category 2 Typhoon Maysak over the West Pacific Ocean on 30 March 2015. A number of large convective bursts can be seen surrounding the eye, along with more subtle features such as transverse banding.
An 11:01 UTC MTSAT-2 10.8 µm IR image with an overlay of 11:11 UTC Metop ASCAT surface scatterometer winds from the CIMSS Tropical Cyclones site (below) revealed the wind field in the eastern semicircle of the tropical cyclone.
MTSAT-2 10.8 µm IR image with Metop ASCAT surface scatterometer winds
Several hours later, a comparison of a 19:01 UTC MTSAT-2 10.8 µm IR image with a 19:00 UTC DMSP SSMIS 85 GHz microwave image (below) showed that the microwave instrument was able to “see” through the clouds surrounding the eye to depict the larger size of the eyewall structure.
MTSAT-2 10.8 µm IR image + DMSP SSMIS 85 GHz microwave image
During the later hours of 30 March, Typhoon Maysak underwent a period of rapid intensification from a Category 2 to a Category 4 storm, as depicted on a plot of the Advanced Dvorak Technique (ADT) intensity estimate (below). Rapid intensification occurred as the tropical cyclone was moving over an area of relatively high ocean heat content.
Advanced Dvorak Technique (ADT) intensity estimate plot for Typhoon Maysak
MTSAT-2 10.8 µm IR channel images during this period of rapid intensification are shown below (click image to play animation).
MTSAT-2 10.8 µm IR images (click to play animation)
The MIMIC Total Precipitable Water (TPW) product (below; click image to play animation) depicted TPW values in excess of 60 mm or 2.36 inches (darker red color enhancement) associated with Maysak as the tropical cyclone moved between the islands of Guam (PGUM) and Yap (PTYA). Yap recorded over 4 inches of rainfall.
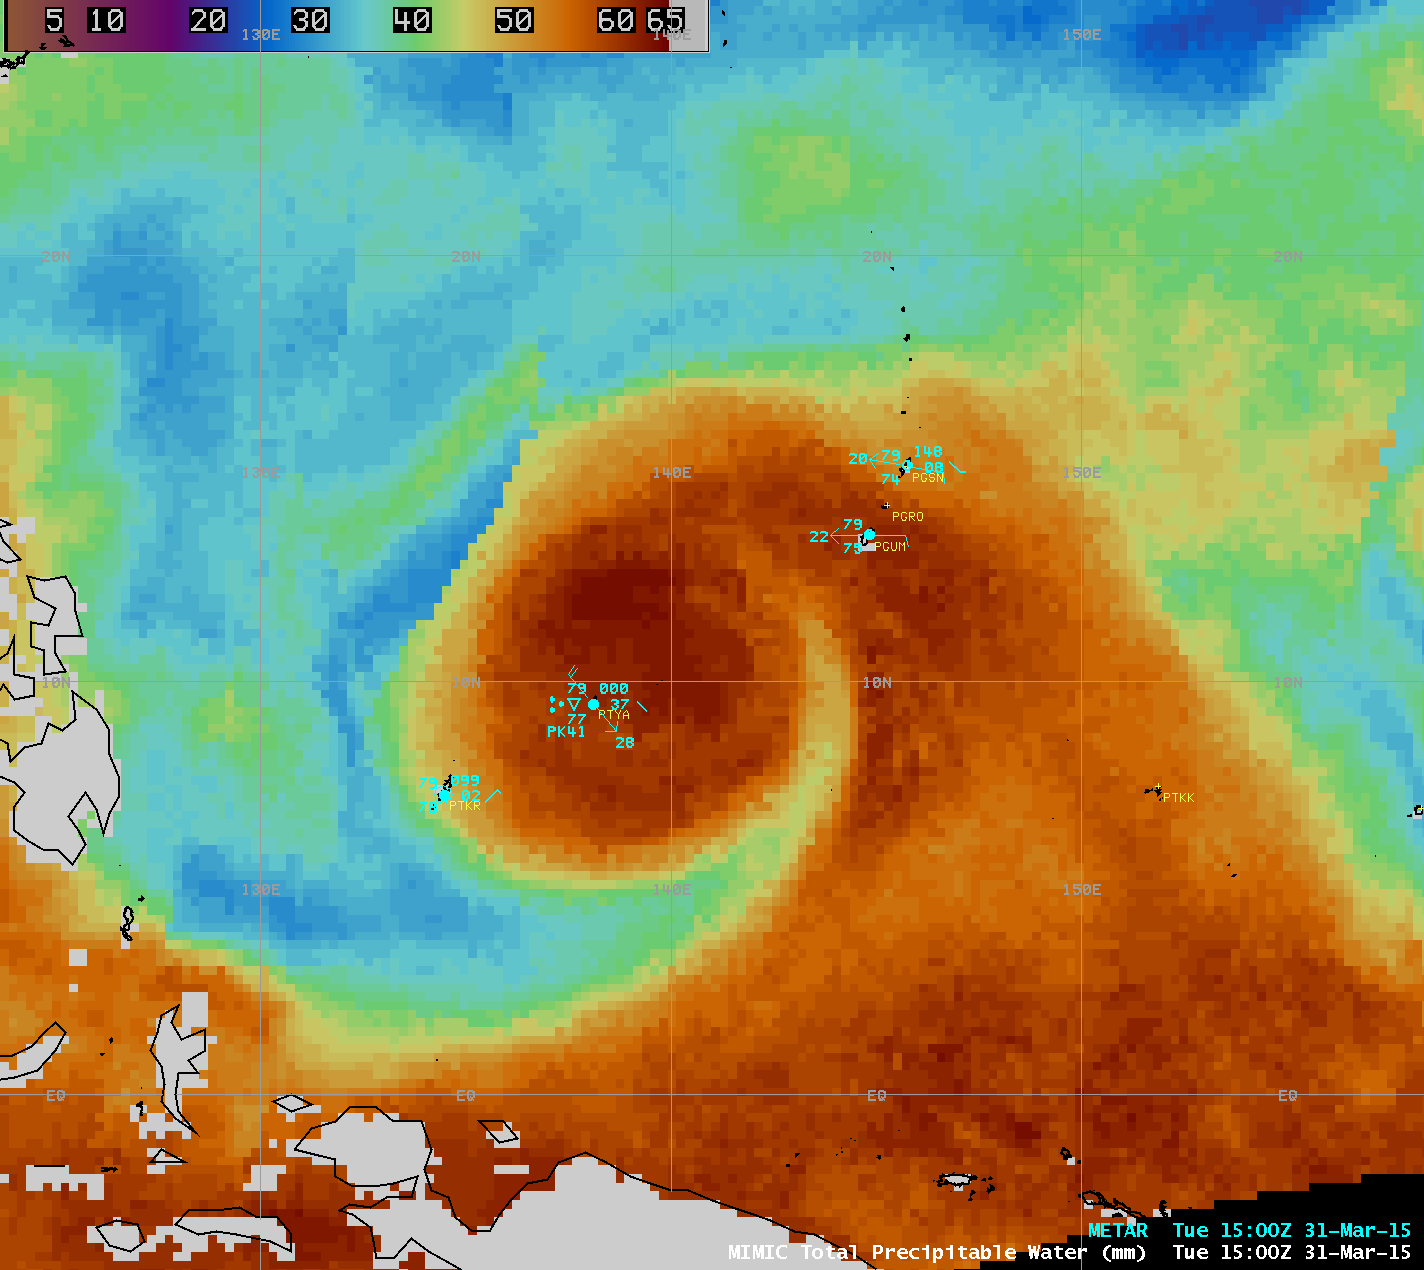
MIMIC Total Precipitable Water product (click to play animation)
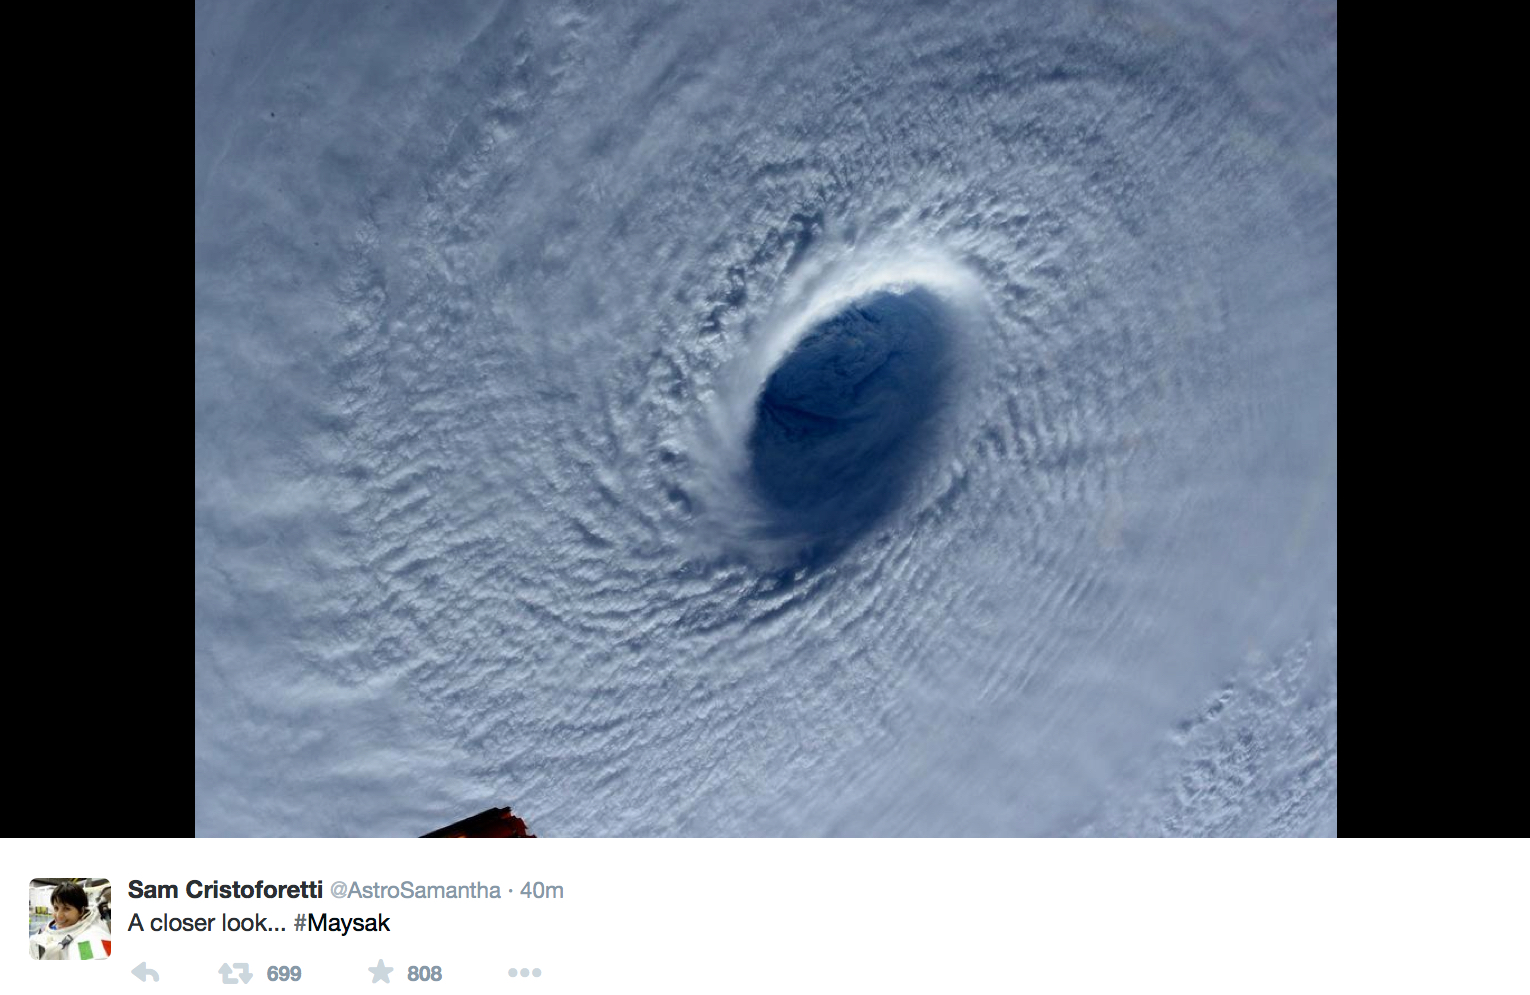
31 March 2015 Update: Maysak intensified to a Category 5 Super Typhoon (ADT plot). Full-resolution visible imagery from Himawari-8 AHI is shown below; a faster animation is available here. A number of mesovortices could be seen within the eye of Maysak; these mesovortices were also evident in photos of the eye of the typhoon taken by an astronaut on the International Space Station, as posted on Twitter here and here.
Himawari-8 AHI 0.64 µm visible channel images (click to play animation)
Images from all 16 channels from the Himawari-8 AHI can be combined into one animation, showing the different information provided by each of the spectral bands — such an animation is shown below, using data from 0600 UTC on 31 March 2015. The Infrared data is shown at full (2-km) resolution; Visible/near Infrared imagery is scaled down by a factor of 2 (0.46 µm, 0.51 µm, 0.85 µm) or by a factor of 4 (0.64 µm). A similar animation, but without annotation or color enhancement, is available here.
Himawari-8 AHI images for all 16 channels at 0600 UTC (click to enlarge)
Maysak had remained in an environment of relatively low deep-layer wind shear (below; click image to play animation), which was favorable for its trend of continued intensification.
MTSAT-2 10.8 µm IR channel images, with deep-layer wind shear (click to play animation)
However, in a comparison of MTSAT-2 10.8 µm IR channel and TRMM TMI 85 GHz microwave images around 14 UTC (below), it can be seen that the microwave image indicated that an eyewall replacement cycle might be underway (which would suggest a subsequent decrease in the typhoon’s intensity within the coming hours). This was supported by the ADT intensity estimate plot, which dropped the intensity of Maysak just below 140 knots after 18 UTC on 31 March.
MTSAT-2 10.7 µm IR image and TRMM TMI 85 GHz microwave image
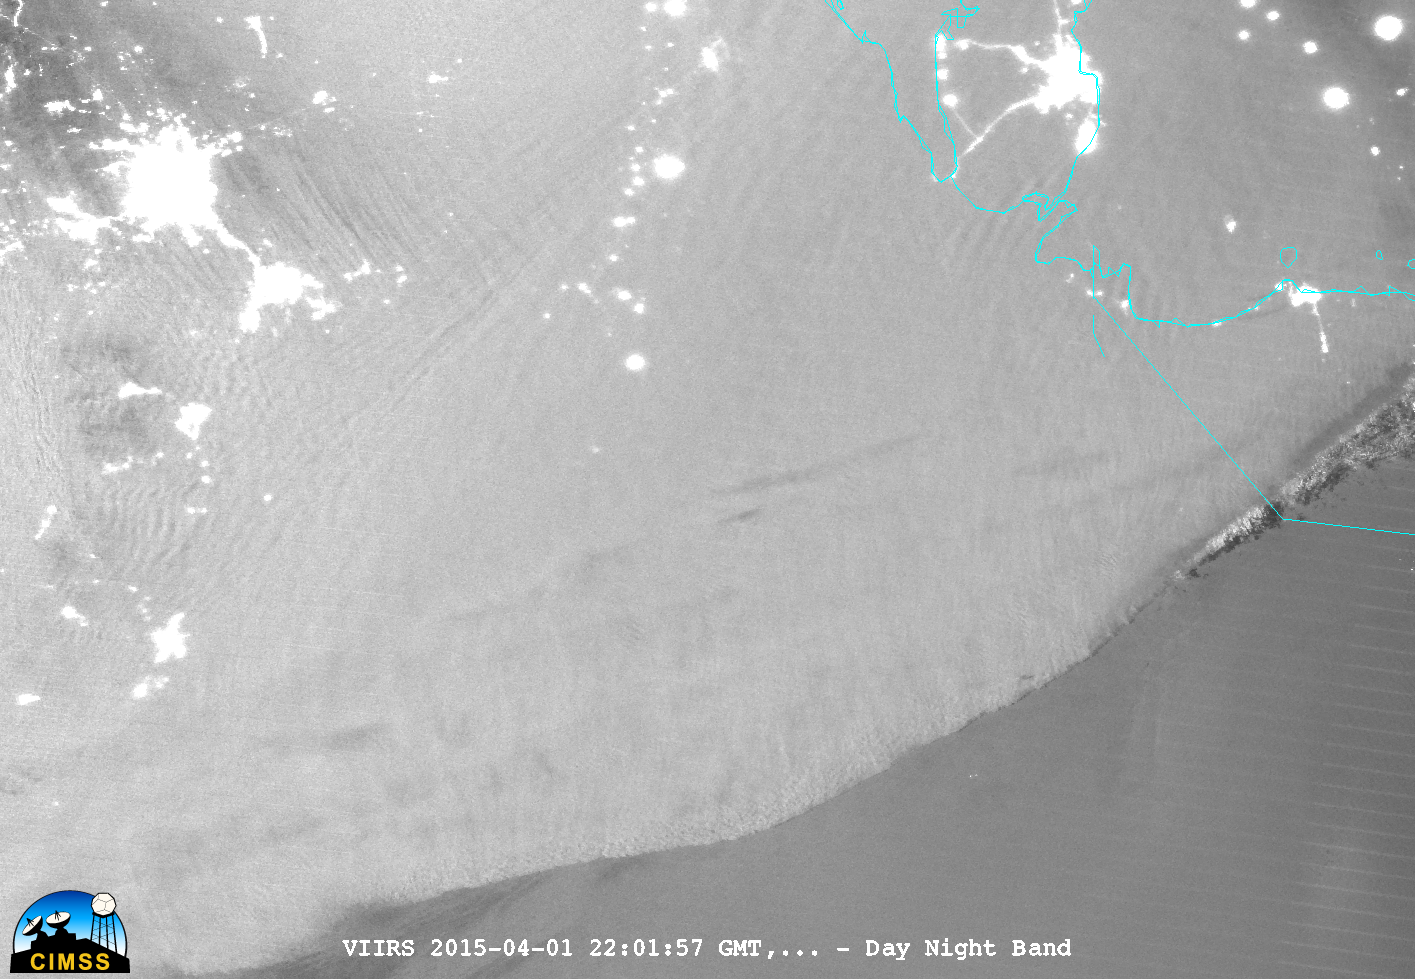
01 April Update: A nighttime comparison of Suomi NPP VIIRS 0.7 µm Day/Night Band and 11.45 µm IR images at 16:58 UTC on 01 April (below; images courtesy of William Straka, SSEC) showed the eye of Typhoon Maysak after it had weakened to a Category 4 storm.
Suomi NPP VIIRS 0.7 µm Day/Night Band and 11.45 µm IR channel images
View only this post
Read Less


