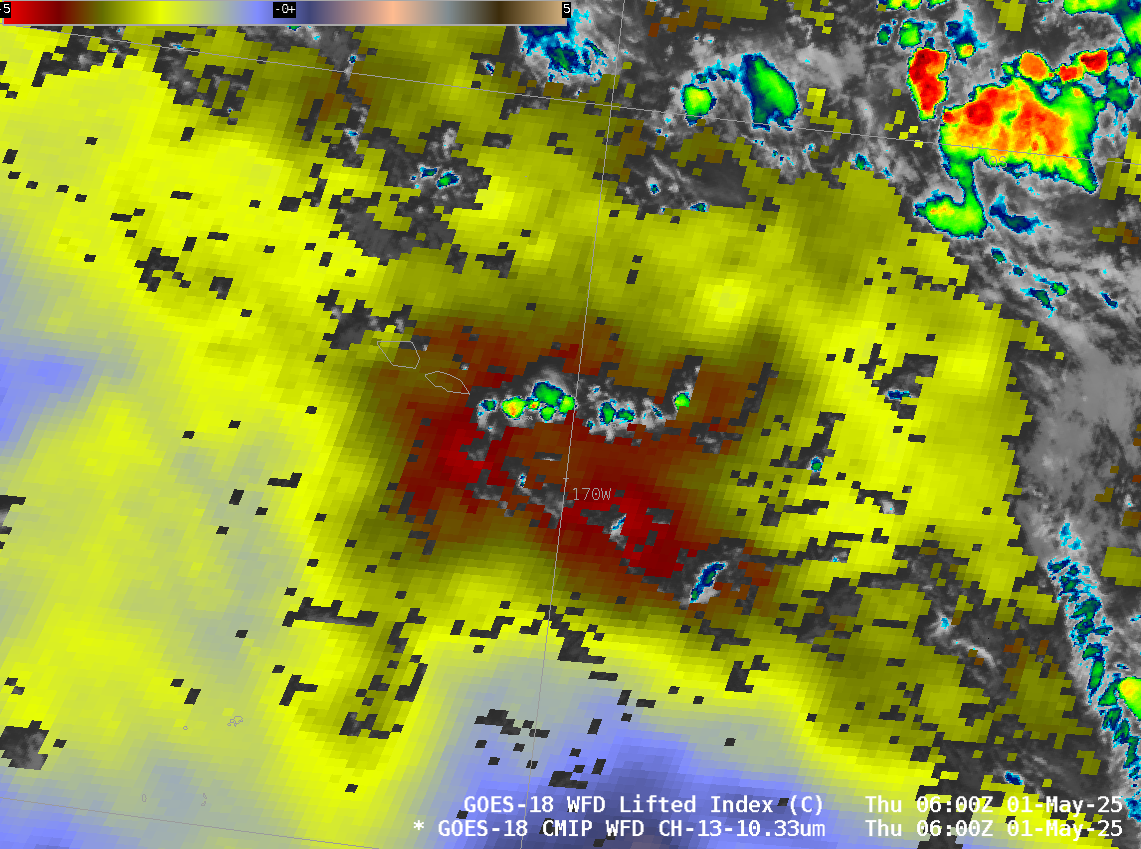
GOES-18 imagery/products, shown below, depict an area of enhanced instability and moisture centered on American Samoa, and convection develops and persists over/around the main island of American Samoa, Tutuila. The convection appears to form along an east-west line that drifts over the island between 0400 and 0800 UTC.
Total Precipitable Water fields, below, suggest the convection was at the leading edge of a somewhat more moist airmass: TPWs increased from 1.8″ (reddish in the enhancement) to 2.0+” (lilac/purple in the enhancement) as the convection developed on the leading edge of the enhanced moisture.
CSPP Geosphere visible/night microphysics RGB imagery, below, (click here for a faster animation, also from 0010 – 1210 UTC on 1 May 2025) shows the progression of the convection from low-level clouds to strong showers. The low-level outflow boundaries show up nicely as light blue/white/pink arcs that become progressively more dark red as the convection develops.
What other products are useful in diagnosing the atmosphere? The SSEC/CIMSS Tropical Weather page includes wind diagnostics over the South Pacific, and they can be retrieved from the data archive at that page. The vorticity analysis from 21 UTC/30 April 2025 to 120 UTC/1 May 2025, below, shows an increase in low-level vorticity over Samoa, reflecting the convective development that is occurring there. The center of the vorticity slowly drifts north as well during the animation. The vorticity fields have a structure that is in agreement with the observed convection; however, upper-level divergence and low-level convergence fields (not shown) do not.
MIMIC Total Precipitable Water fields (source), below, also show the subtle increase in TPW that accompanied the convection over Samoa.
Scatterometry data for this event was sparse. The toggle below — images that were taken from the manati website (https://manati.star.nesdis.noaa.gov/) — shows OSCAT imagery at 1128 UTC and MetopC imagery at 2013 UTC (both on 30 April 2025). There is speed convergence to the southeast of American Samoa.
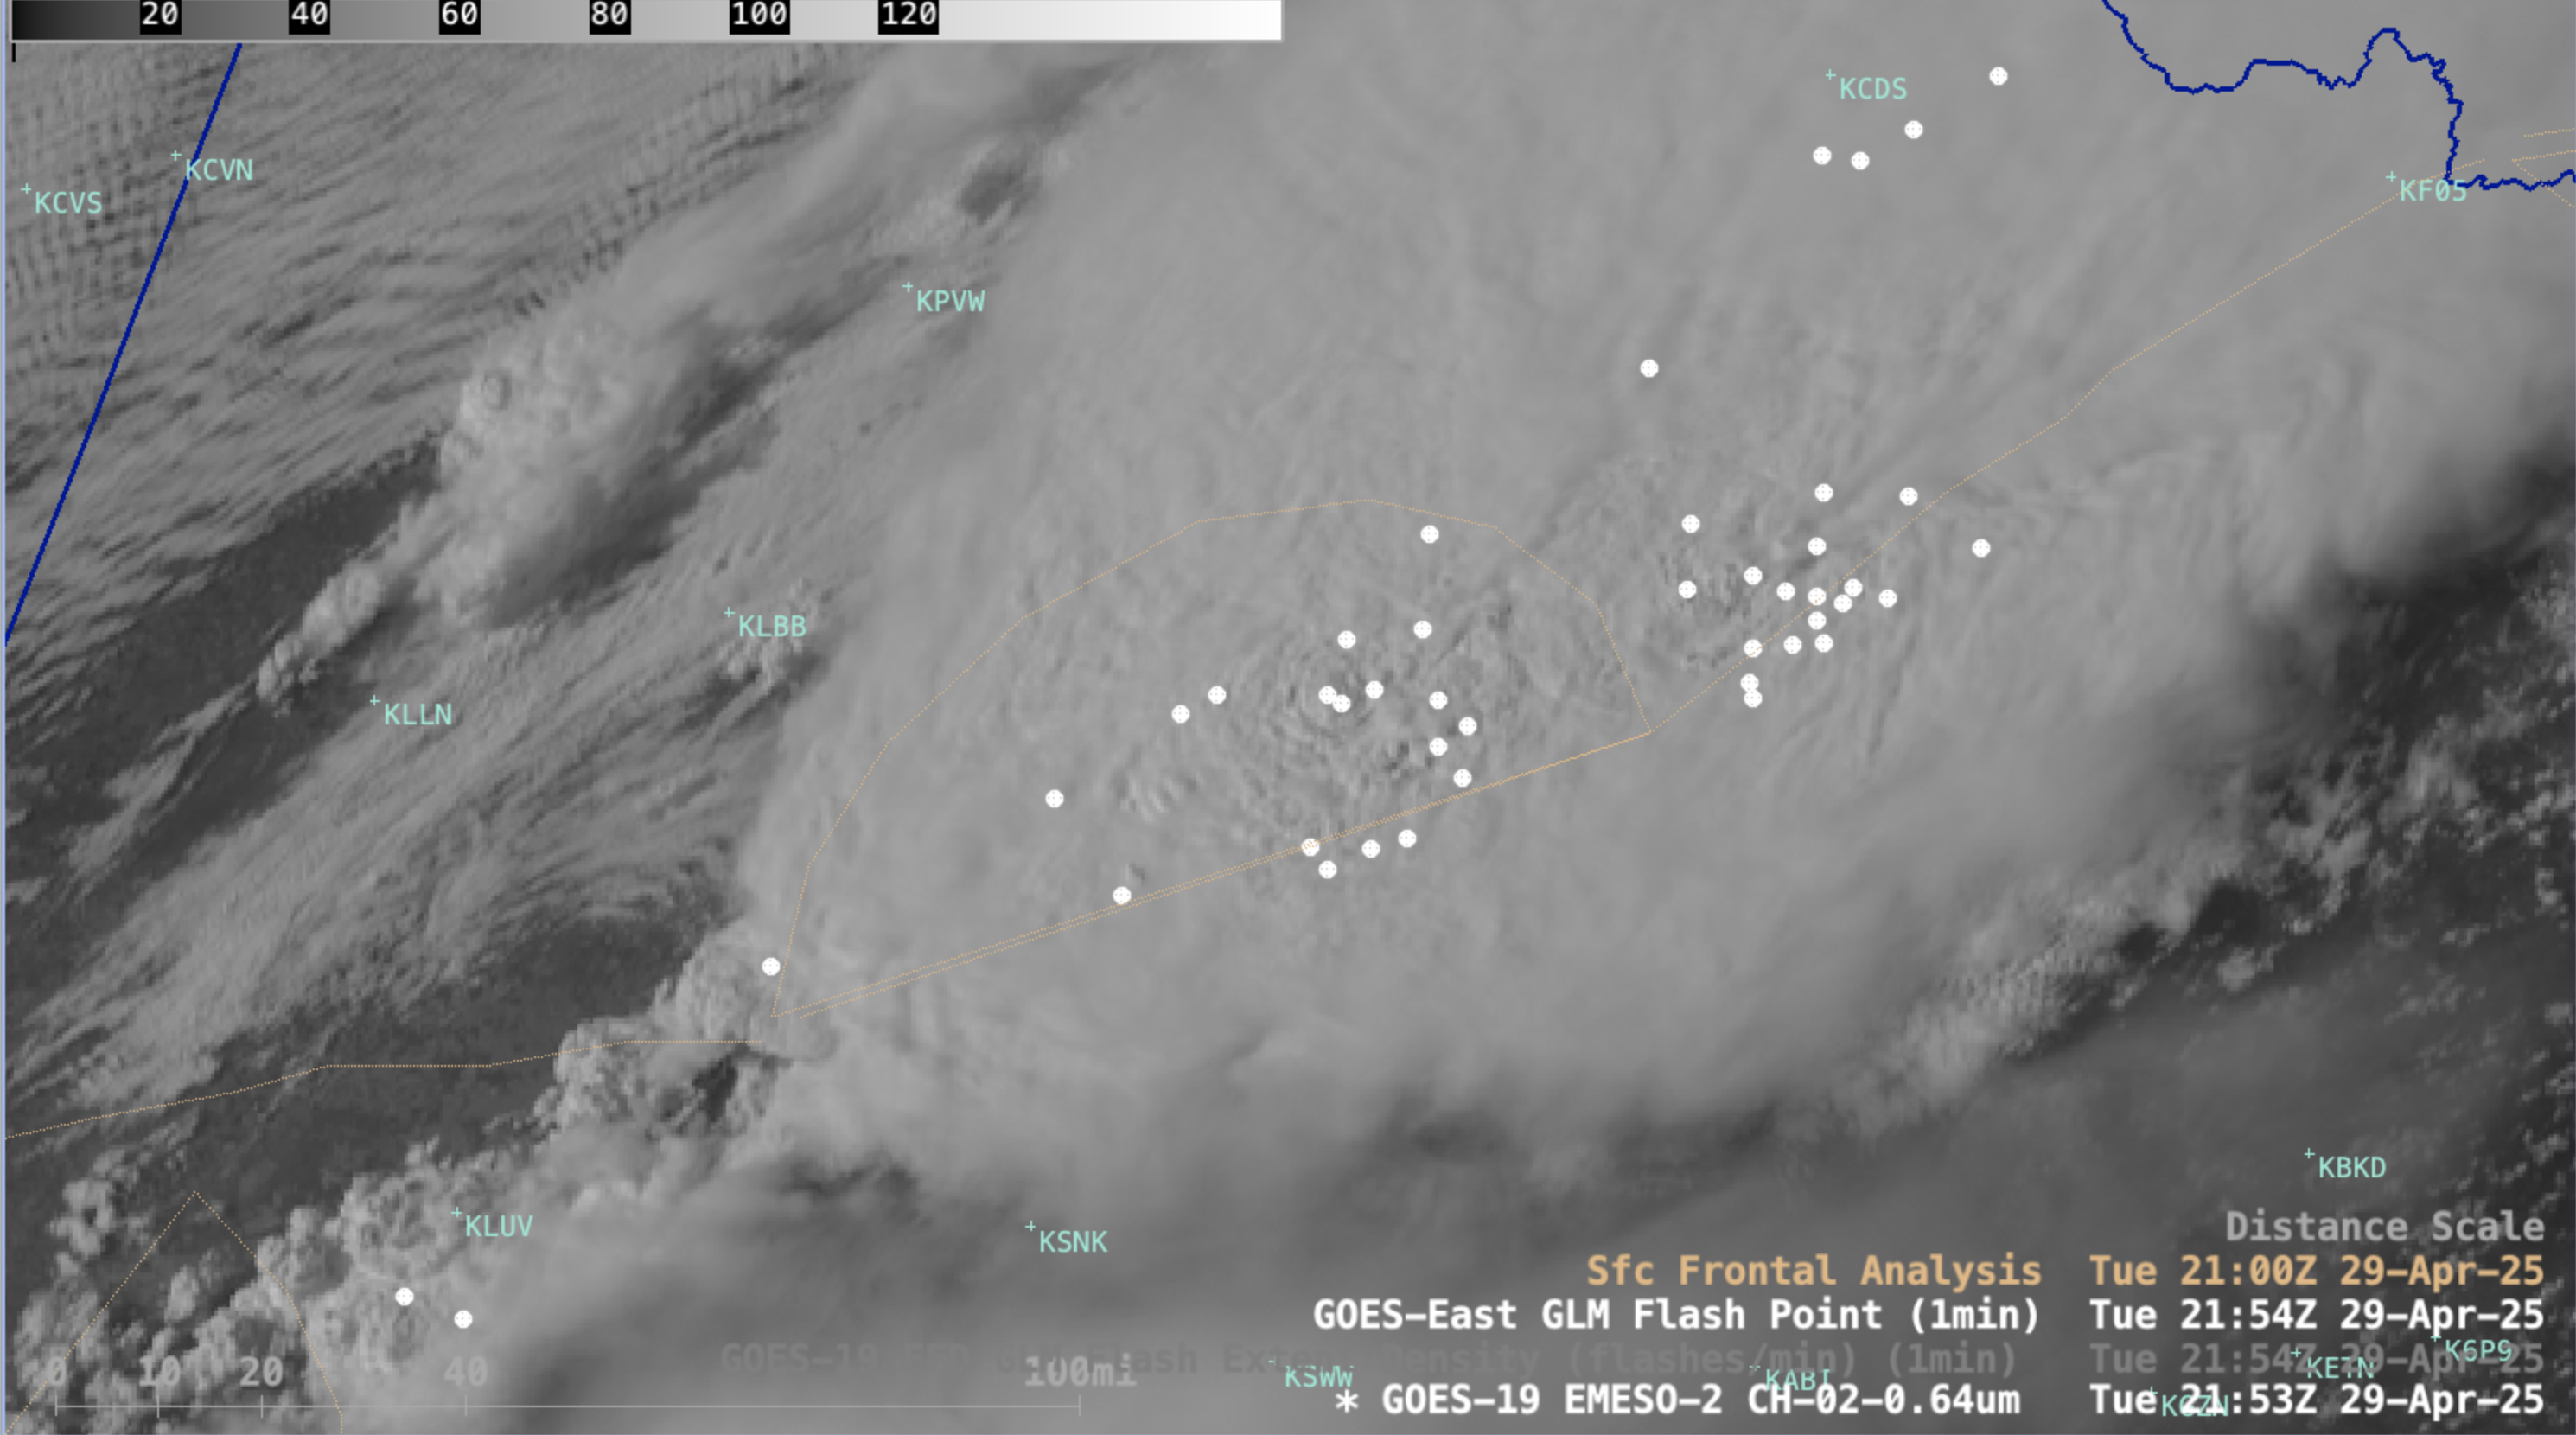
LightningCast probabilities (available from an American Samoa Sector at this website) shows increasing probabilities from 0300 UTC to 0600 UTC, with GLM lightning observations starting at 0440 UTC.
LightningCast probabilities can also be calculated with CSPP Geo software, and the output for a longer period is shown below.
NUCAPS profiles can give a good estimate of the thermodynamic state of the atmosphere. Gridded NUCAPS fields, not shown here, are very useful because they show horizontal fields that allow for a quicker diagnostic of thermodynamics than via the tedious clicking of multiple sounding points. These profiles can be compared to the 0000 UTC/1200 UTC 1 May 2025upper-air sounding from the balloon launched from the Pago Pago airport, shown below. These plots were retrieved from the University of Wyoming sounding site.
What did the NUCAPS profiles show? NUCAPS Sounding availability at 0008 UTC (NOAA-20) and 0059 UTC (NOAA-21) are shown below.
The four closest profiles to Tutuila, shown in the animation below, all have similar thermodynamic characteristics. Moisture is more abundant in the easternmost points.
The information from NOAA-21, at 0058 UTC, below, along a north-south line that passes north-south through the diagnosed maximum in instability, shows CAPE values are greatest just north of the American Samoa islands, and Total Precipitable Water is greatest over the islands.
View only this post Read Less


