Tropical Storm Ela began as Tropical Depression 4E about 900 miles east of Hilo, Hawai’i around 03 UTC on 08 July 2015. A comparison of daytime images of Suomi NPP VIIRS 0.64 µm Visible channel and 11.45 µm Infrared channel images (above) showed the somewhat disorganized appearance of TD 4E... Read More
Suomi NPP VIIRS visible (0.64 µm) and Infrared (11.45 µm) images of Tropical Depression 4E at 2224 UTC on 08 July
Tropical Storm Ela began as Tropical Depression 4E about 900 miles east of Hilo, Hawai’i around 03 UTC on 08 July 2015. A comparison of daytime images of Suomi NPP VIIRS 0.64 µm Visible channel and 11.45 µm Infrared channel images (above) showed the somewhat disorganized appearance of TD 4E at 2224 UTC on 08 July — the low-level circulation center (LLCC) was located to the southwest of the clusters of deep convection associated with the system.
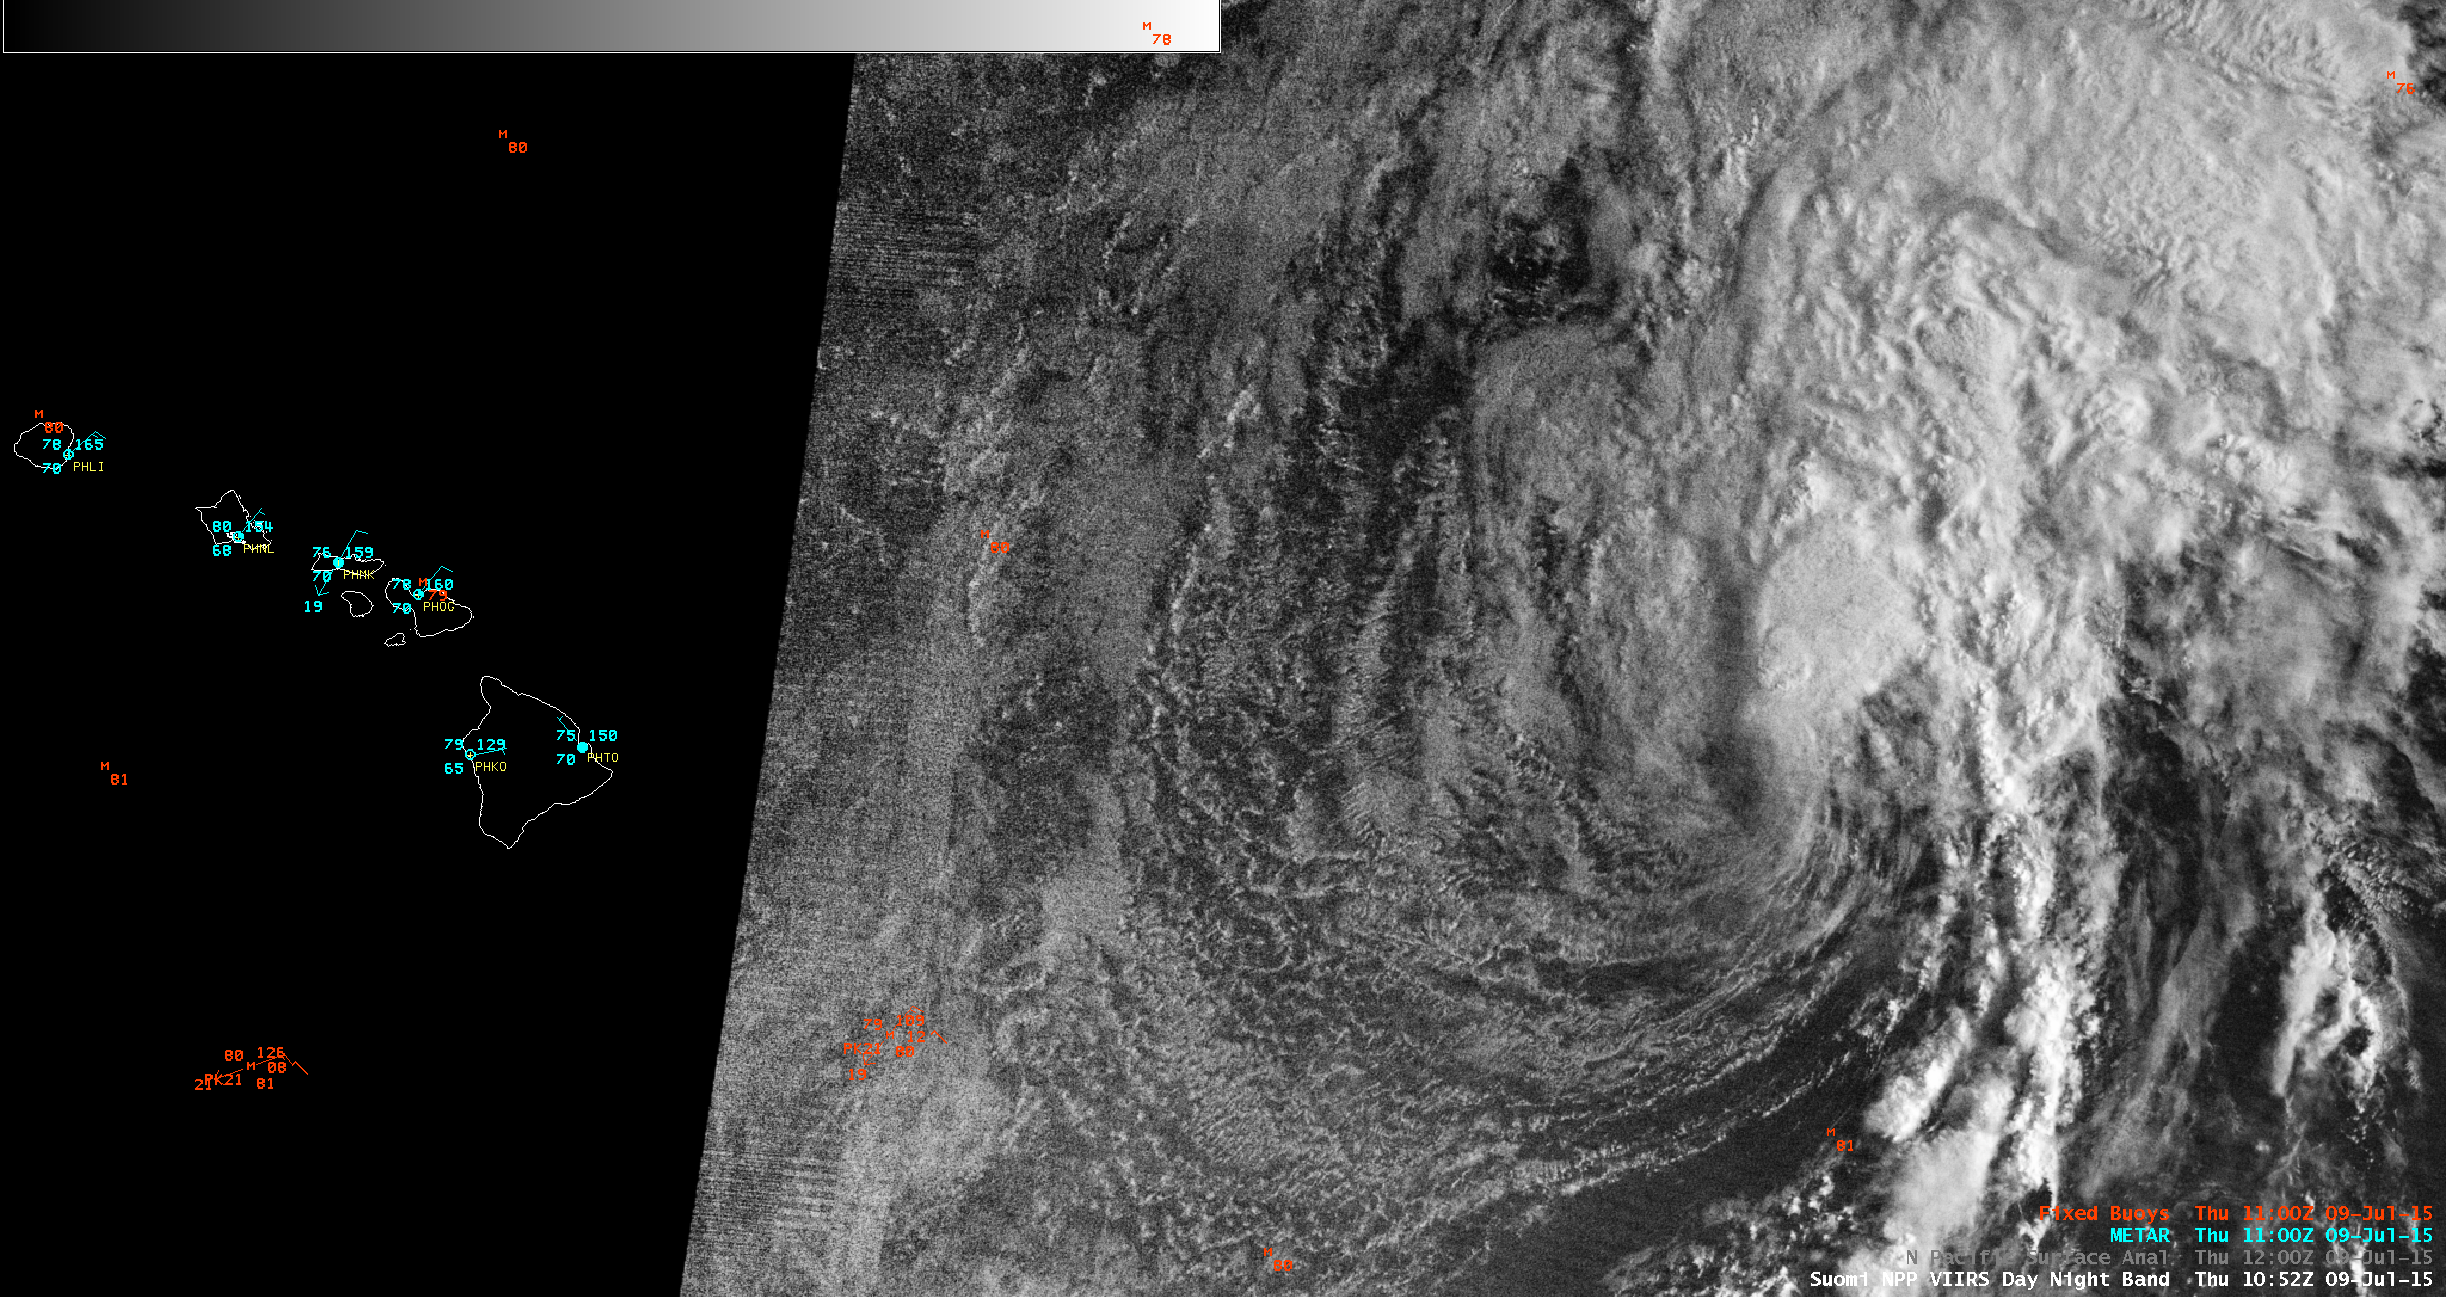
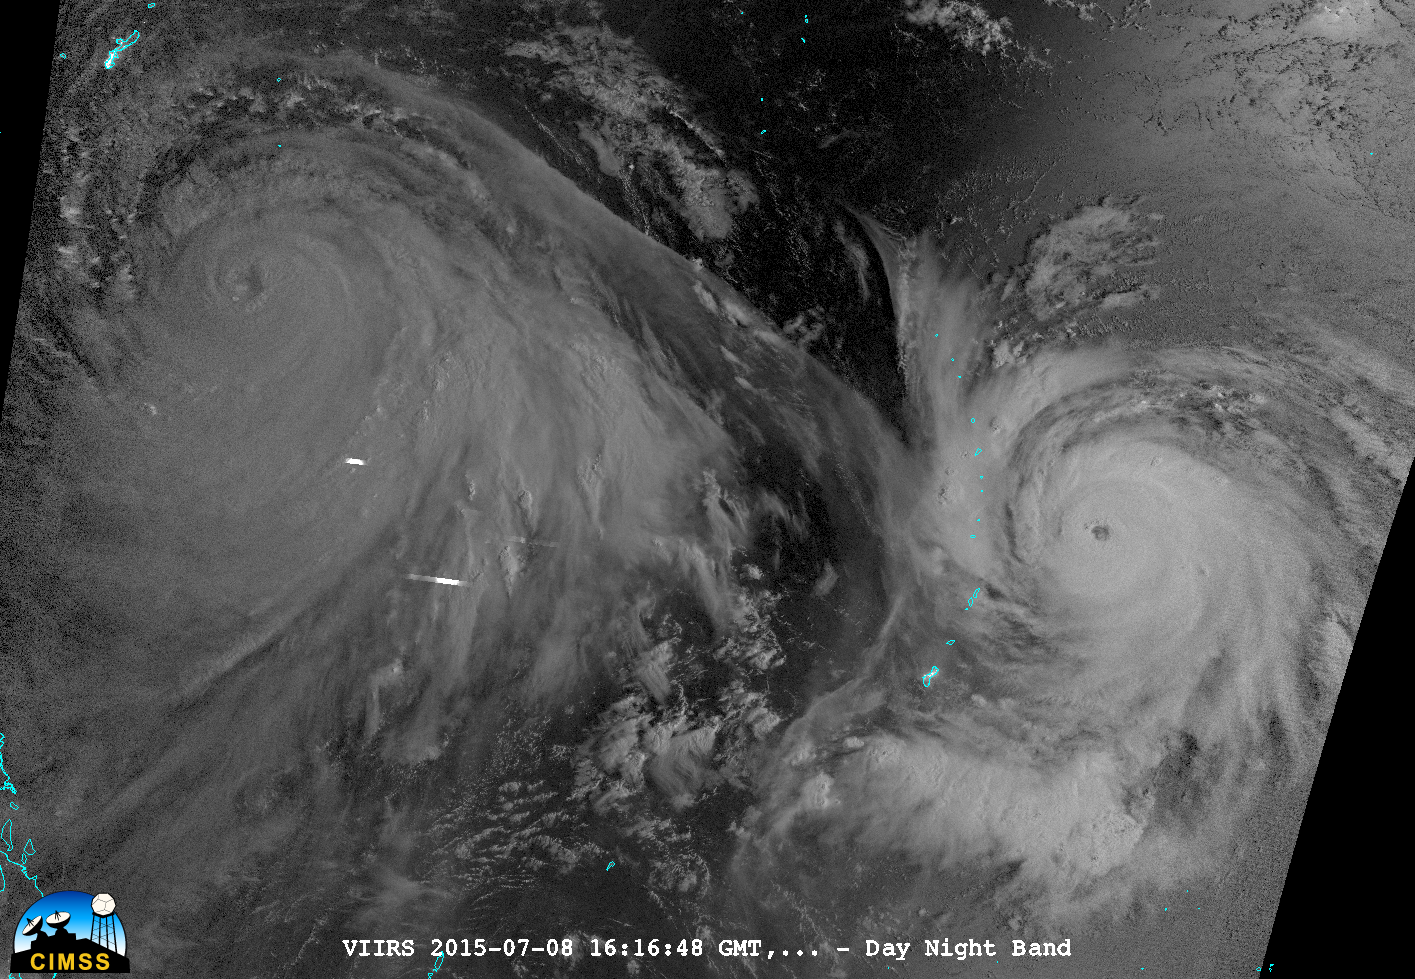
About 12 hours later, a nighttime comparison of VIIRS 0.7 µm Day/Night Band (DNB) and 11.45 µm Infrared channel images at 1052 UTC on 09 July (below) continued to show a similar disconnect between the LLCC and clusters of deep convection in the eastern semicircle of recently-upgraded Tropical Storm Ela. The coldest cloud-top IR brightness temperature in the convection closest to the storm center was -78º C. Even though the Moon was in the Waning Crescent phase (at 43% of Full), it still provided enough illumination to aid in the location of the LLCC, as noted in a discussion issued by the CPHC:
TROPICAL STORM ELA DISCUSSION NUMBER 7
NWS CENTRAL PACIFIC HURRICANE CENTER HONOLULU HI EP042015
500 AM HST THU JUL 09 2015
A 1052Z VIIRS DAY/NIGHT BAND IMAGE WAS INSTRUMENTAL IN HELPING TO LOCATE THE PARTIALLY EXPOSED CENTER OF ELA THIS MORNING.
Suomi NPP VIIRS Day/Night Band (0.7 µm) and Infrared (11.45 µm) images of Tropical Storm Ela at 1052 UTC on 09 July
According to satellite-derived winds products from the CIMSS Tropical Cyclones site, there was strong divergence and a well-defined outflow channel in the northern quadrant of Ela (below), whose center was located at 19.3º N 145.1º W at 09 UTC on 09 July.
GOES-15 water vapor (6.5 µm) images with satellite wind derived upper tropospheric divergence and winds
The reason that the LLCC remained exposed from the elements of deep convection was the fact that Ela was encountering increasing amounts of southwesterly deep-layer wind shear as it tracked northwestward (below).
GOES-15 Infrared (10.7 µm) images, with an overlay of deep-layer wind shear at 18 UTC on 09 July
========================= Added July 10 2015 ============================
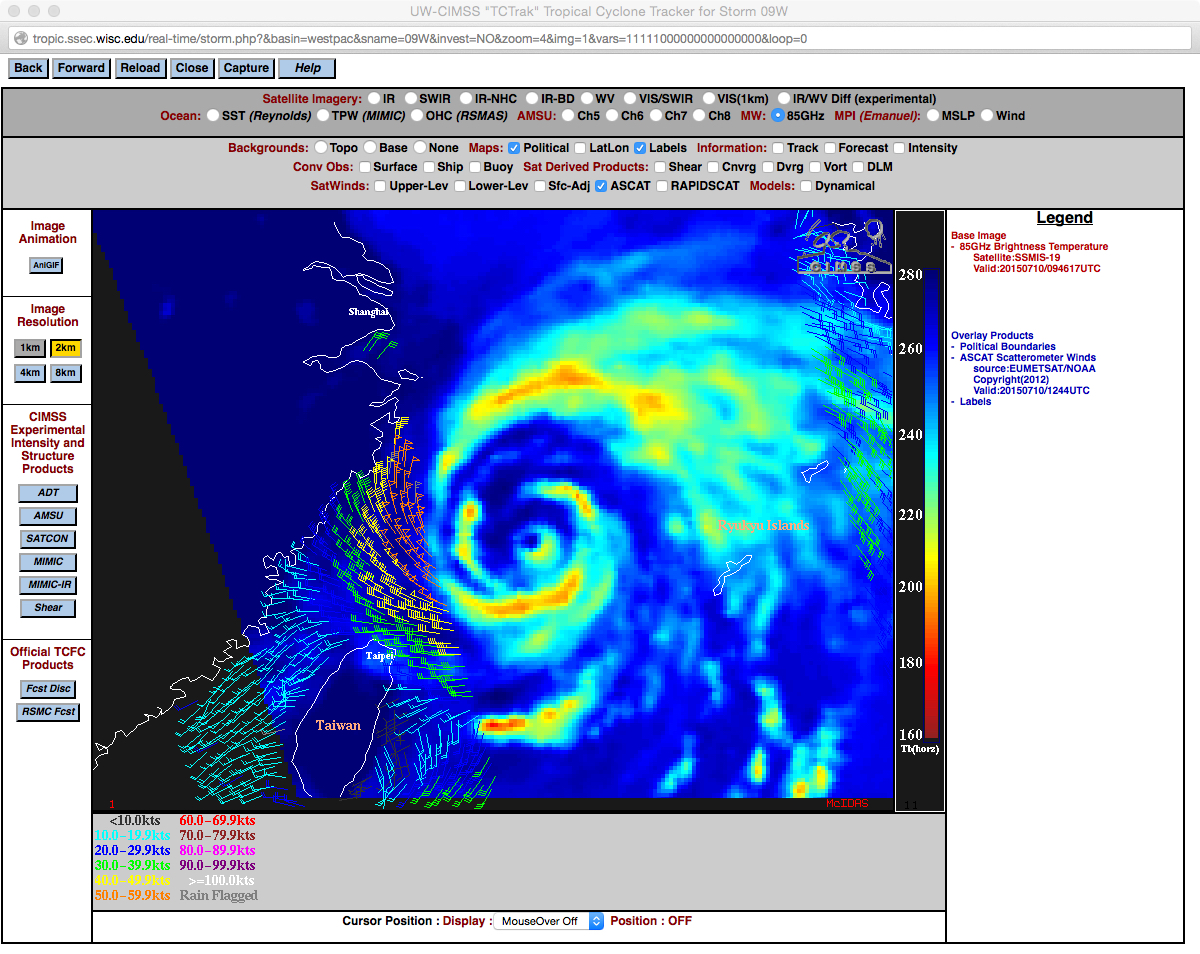
The southwesterly shear over the storm decoupled the surface circulation from the overlying convection, and Ela was downgraded to a depression early on 10 July 2015. The 0700 UTC 10 July 2015 image below shows ASCAT Scatterometer winds depicting a low-level swirl well east of Hawai’i; deep convection with the system is hundreds of kilometers to the northeast.
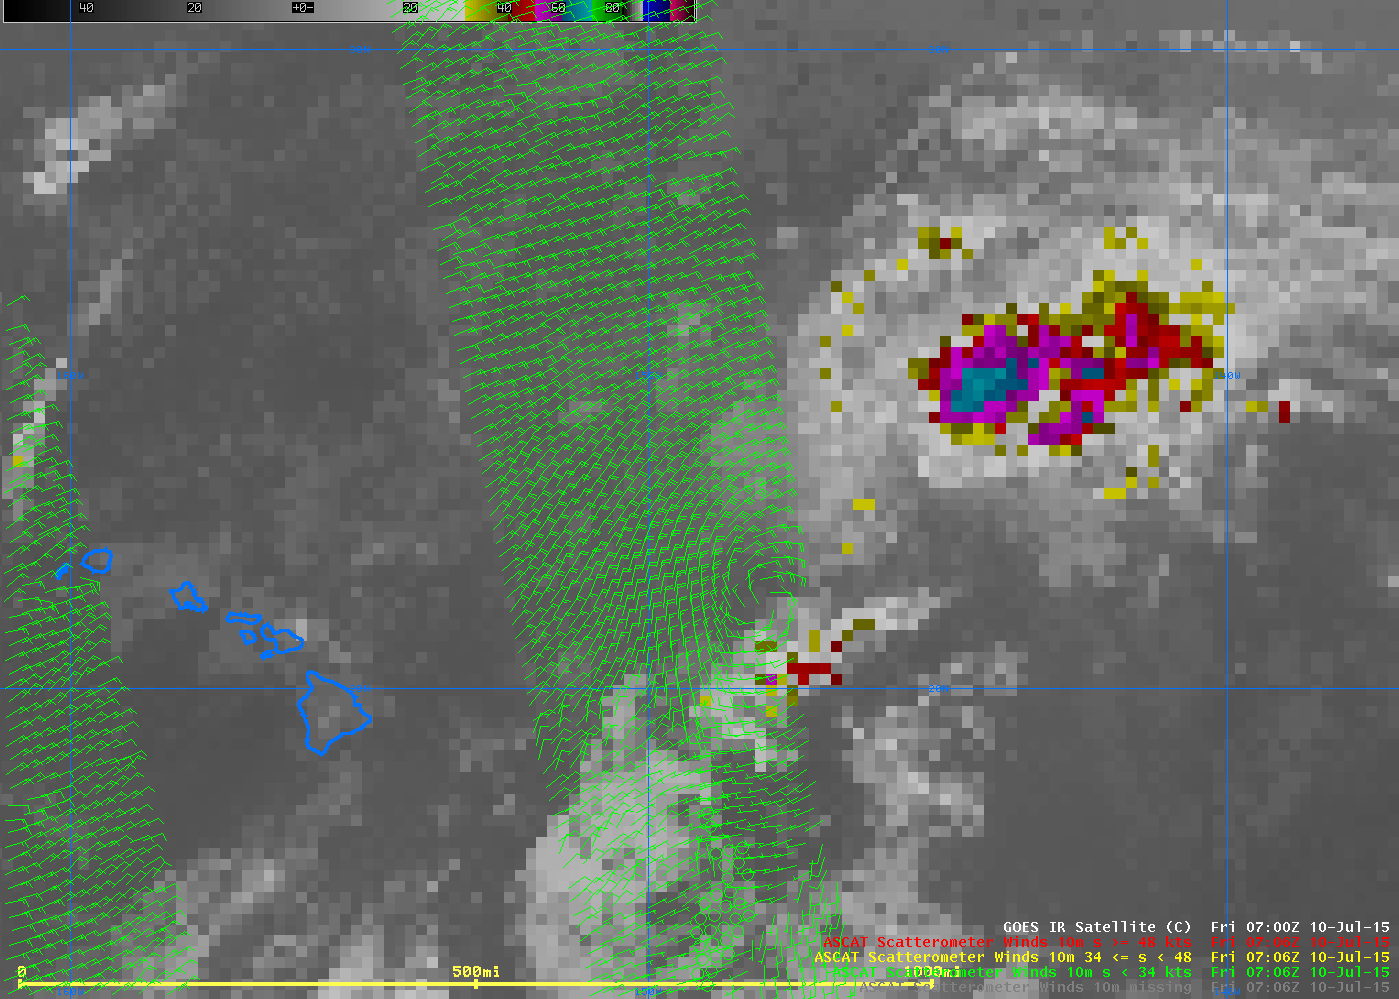
ASCAT Scatterometer winds and GOES-15 infrared (10.7 µm) imagery, 0700 UTC 10 July 2015 (Click to enlarge)
View only this post
Read Less

