
COMS-1 10.8µm Infrared imagery (click to play animation)
Imagery from the Korean COMS-1 satellite, above, shows Category 3 Typhoon Soudelor approaching the island of Taiwan. The eye appearance becomes ragged at the end of the animation, suggesting entrainment of dry air into the center of the Typhoon. Although Sea Surface Temperatures are warm (image taken from here), strengthening before landfall is not forecast. Life-threatening flooding is likely as the circulation and moisture associated with Soudelor interact with the high terrain on the island of Taiwan (Total Precipitable Water animation from MIMIC).
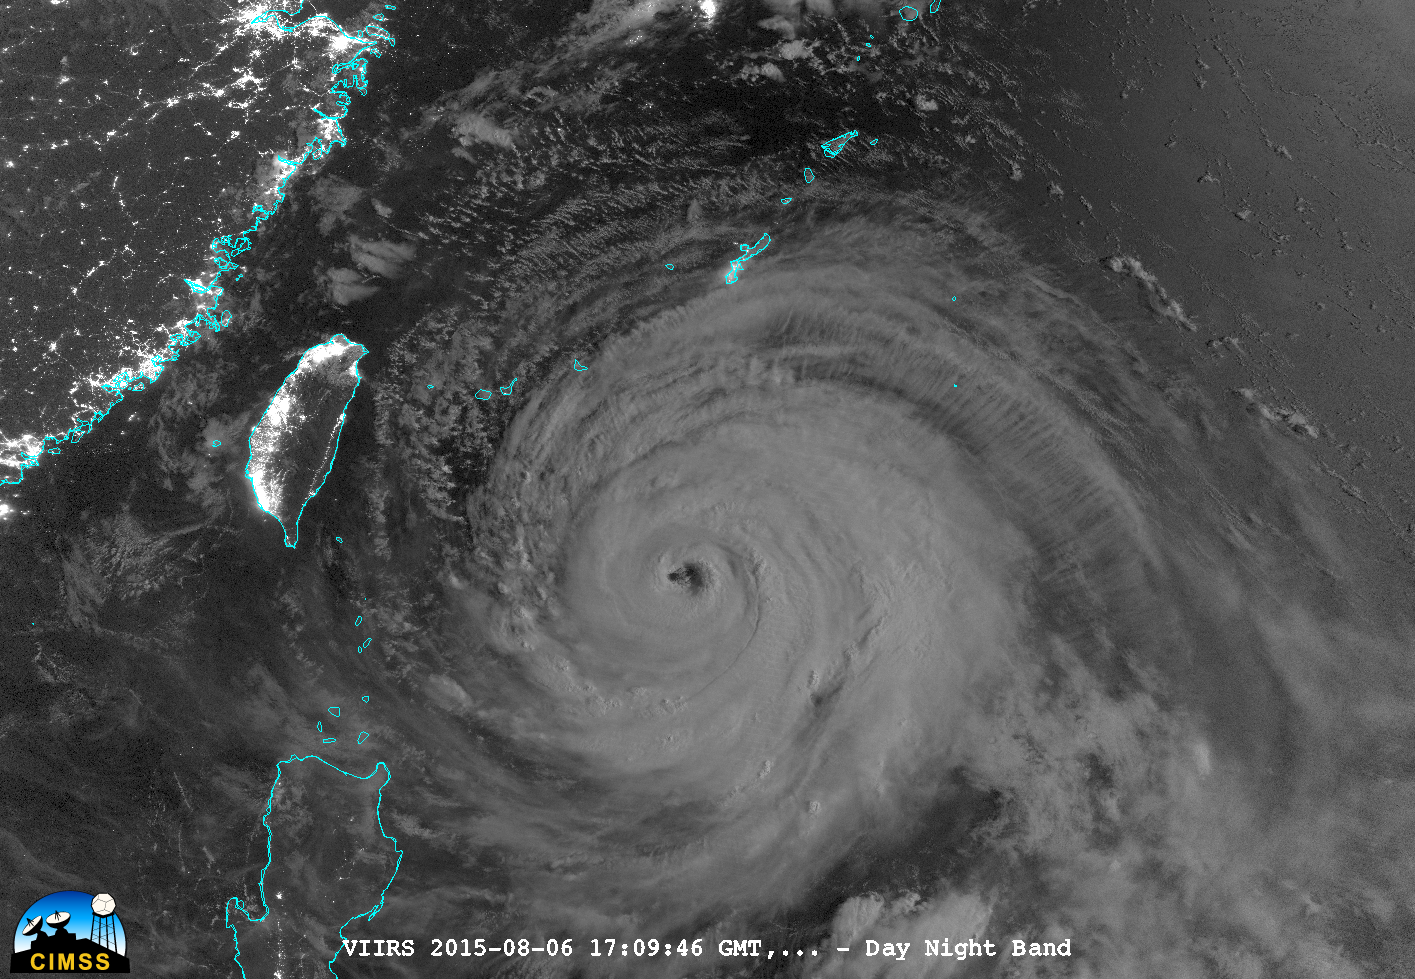
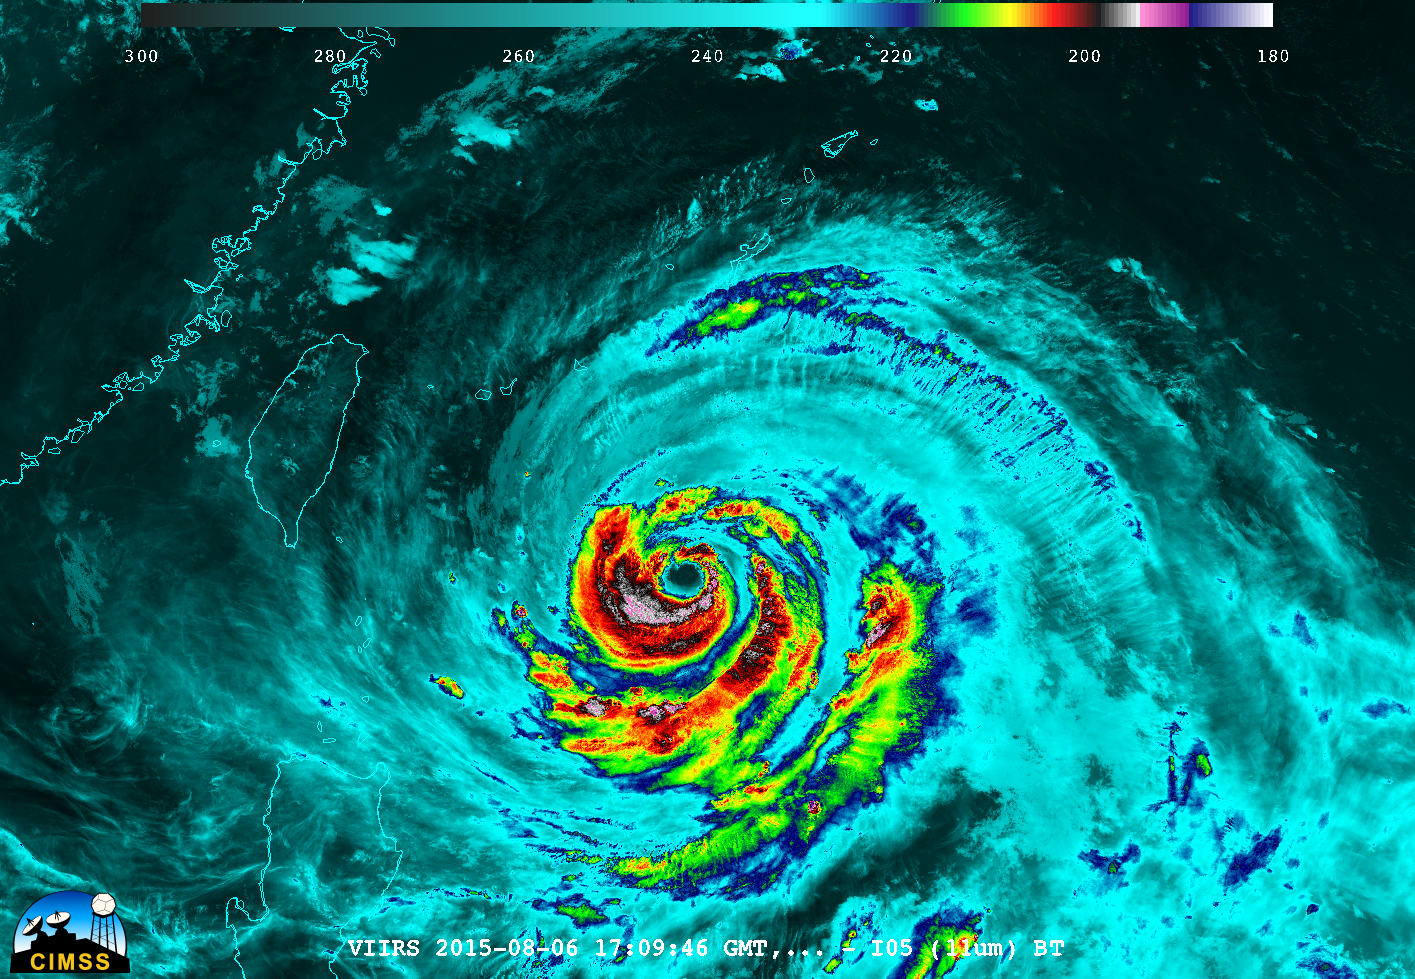
Suomi NPP overflew Soudelor during the morning of the 7th (1709 UTC on 6 August), and the half-moon illumination allowed the VIIRS Day/Night Band to show impressive outflow in the northern semi-circle of the storm; the 11.45 µm Infrared image, however, shows few cold cloud tops just to the north of the eye.

Suomi NPP VIIRS Day/Night Band Visible (0.70 µm) and Infrared (11.45 µm) images, 1709 UTC 6 August 2015 (click to enlarge)
A closer view of the eye of Typhoon Soudelor is shown below.
Suomi NPP VIIRS 0.7 µm Day/Night Band and 11.45 µm Infrared images (click to enlarge)
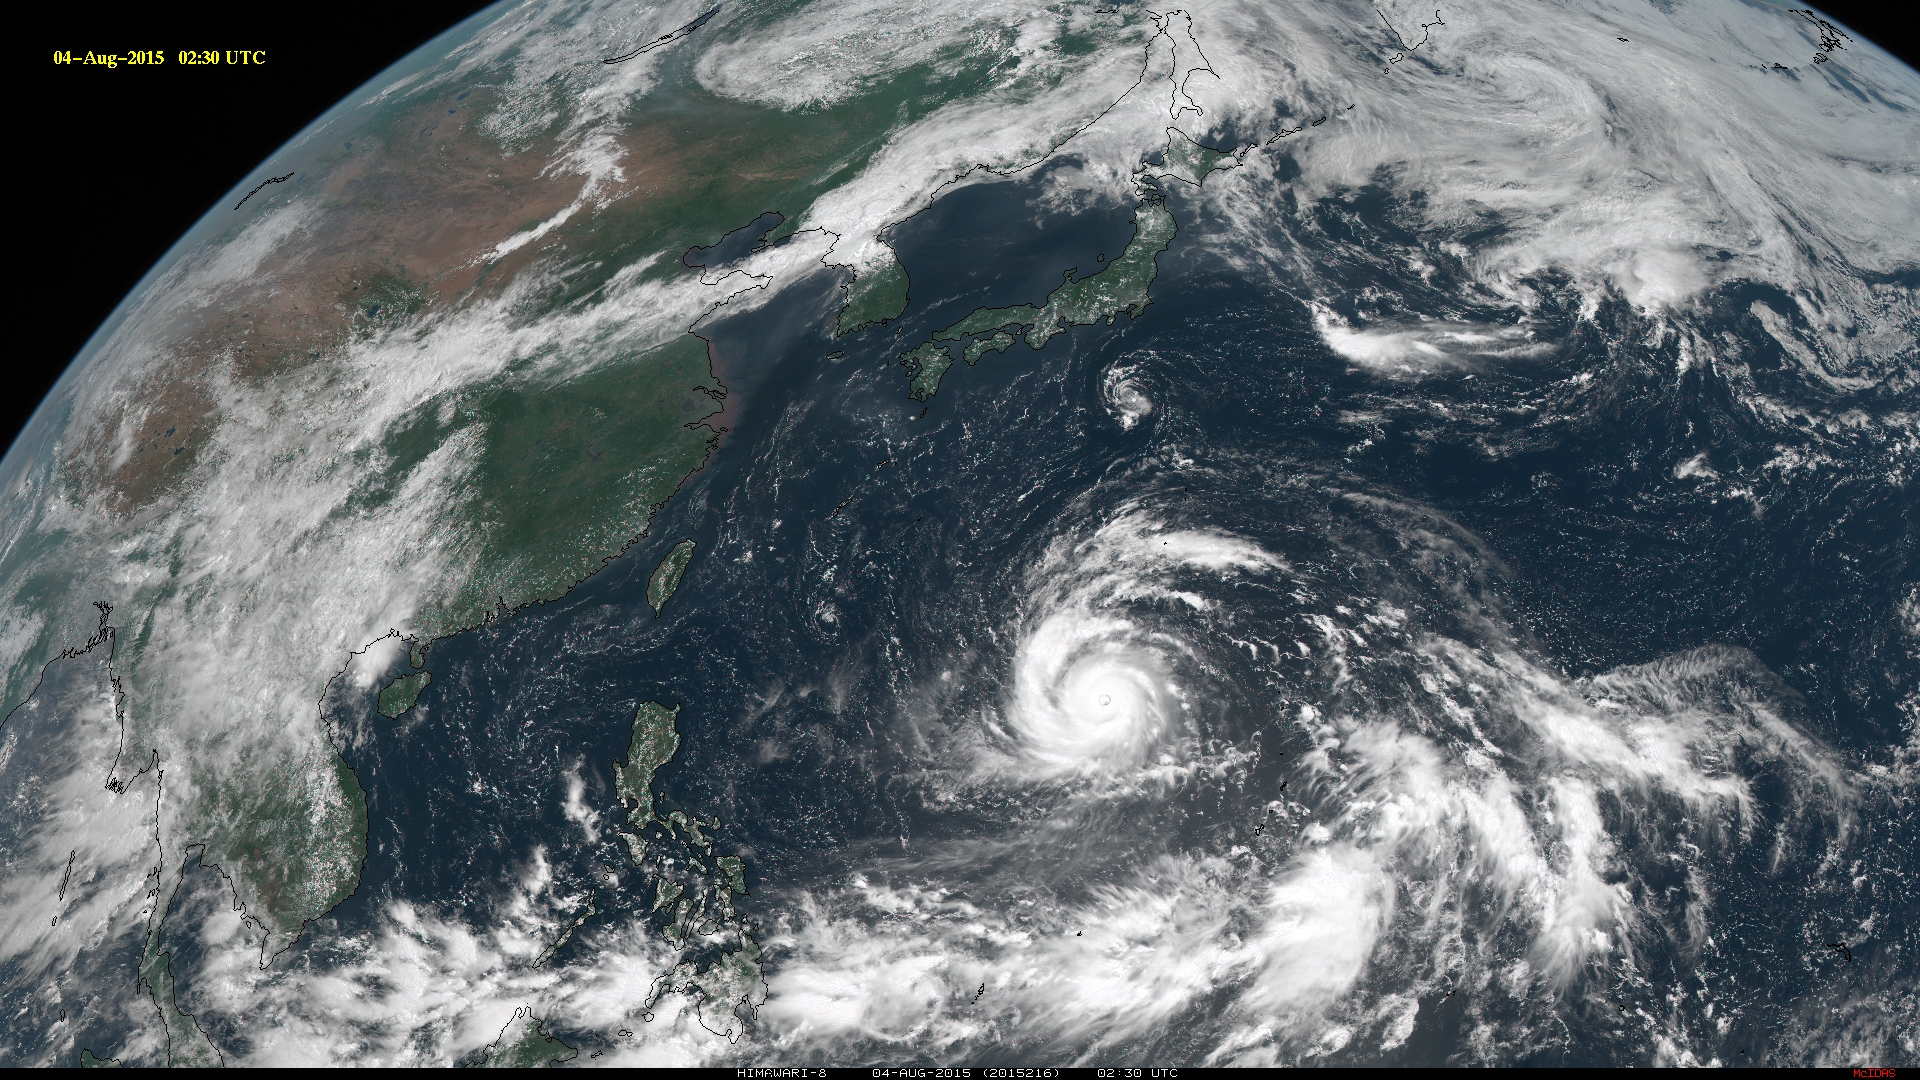
The 16-channel animation from Himawari-8 AHI, below, at half-hour time steps from 0000 through 1230 UTC on 7 August, shows plain evidence of dry air at mid-levels increasing with time, first northeast of the storm and later west of the storm (especially in the ‘water vapor’ channels: 6.2 µm, 6.9 µm and 7.3 µm).

All 16 Himawari-8 AHI channels, 0000-1230 UTC on 7 August, wavelengths as indicated (click to animate)
About 5 hours prior to landfall on Taiwan, a nighttime comparison of Suomi NPP VIIRS Day/Night Band (0.7 µm) and Infrared (11.45 µm) images at 1653 UTC on 07 August (00:53 AM on 08 August, Taiwan time) is shown below. The images showed a ragged eye structure, but a well-defined spiral band wrapping around the northern semicircle of the typhoon.
![Suomi NPP VIIRS Day/Night Band (0.7 µm) and Infrared (11.45 µm) images [click to enlarge]](https://cimss.ssec.wisc.edu/satellite-blog/wp-content/uploads/sites/5/2015/08/150807_1653utc_suomi_npp_viirs_dnb_ir_Typhoon_Soudelor_anim.gif)
Suomi NPP VIIRS Day/Night Band (0.7 µm) and Infrared (11.45 µm) images [click to enlarge]
View only this post Read Less
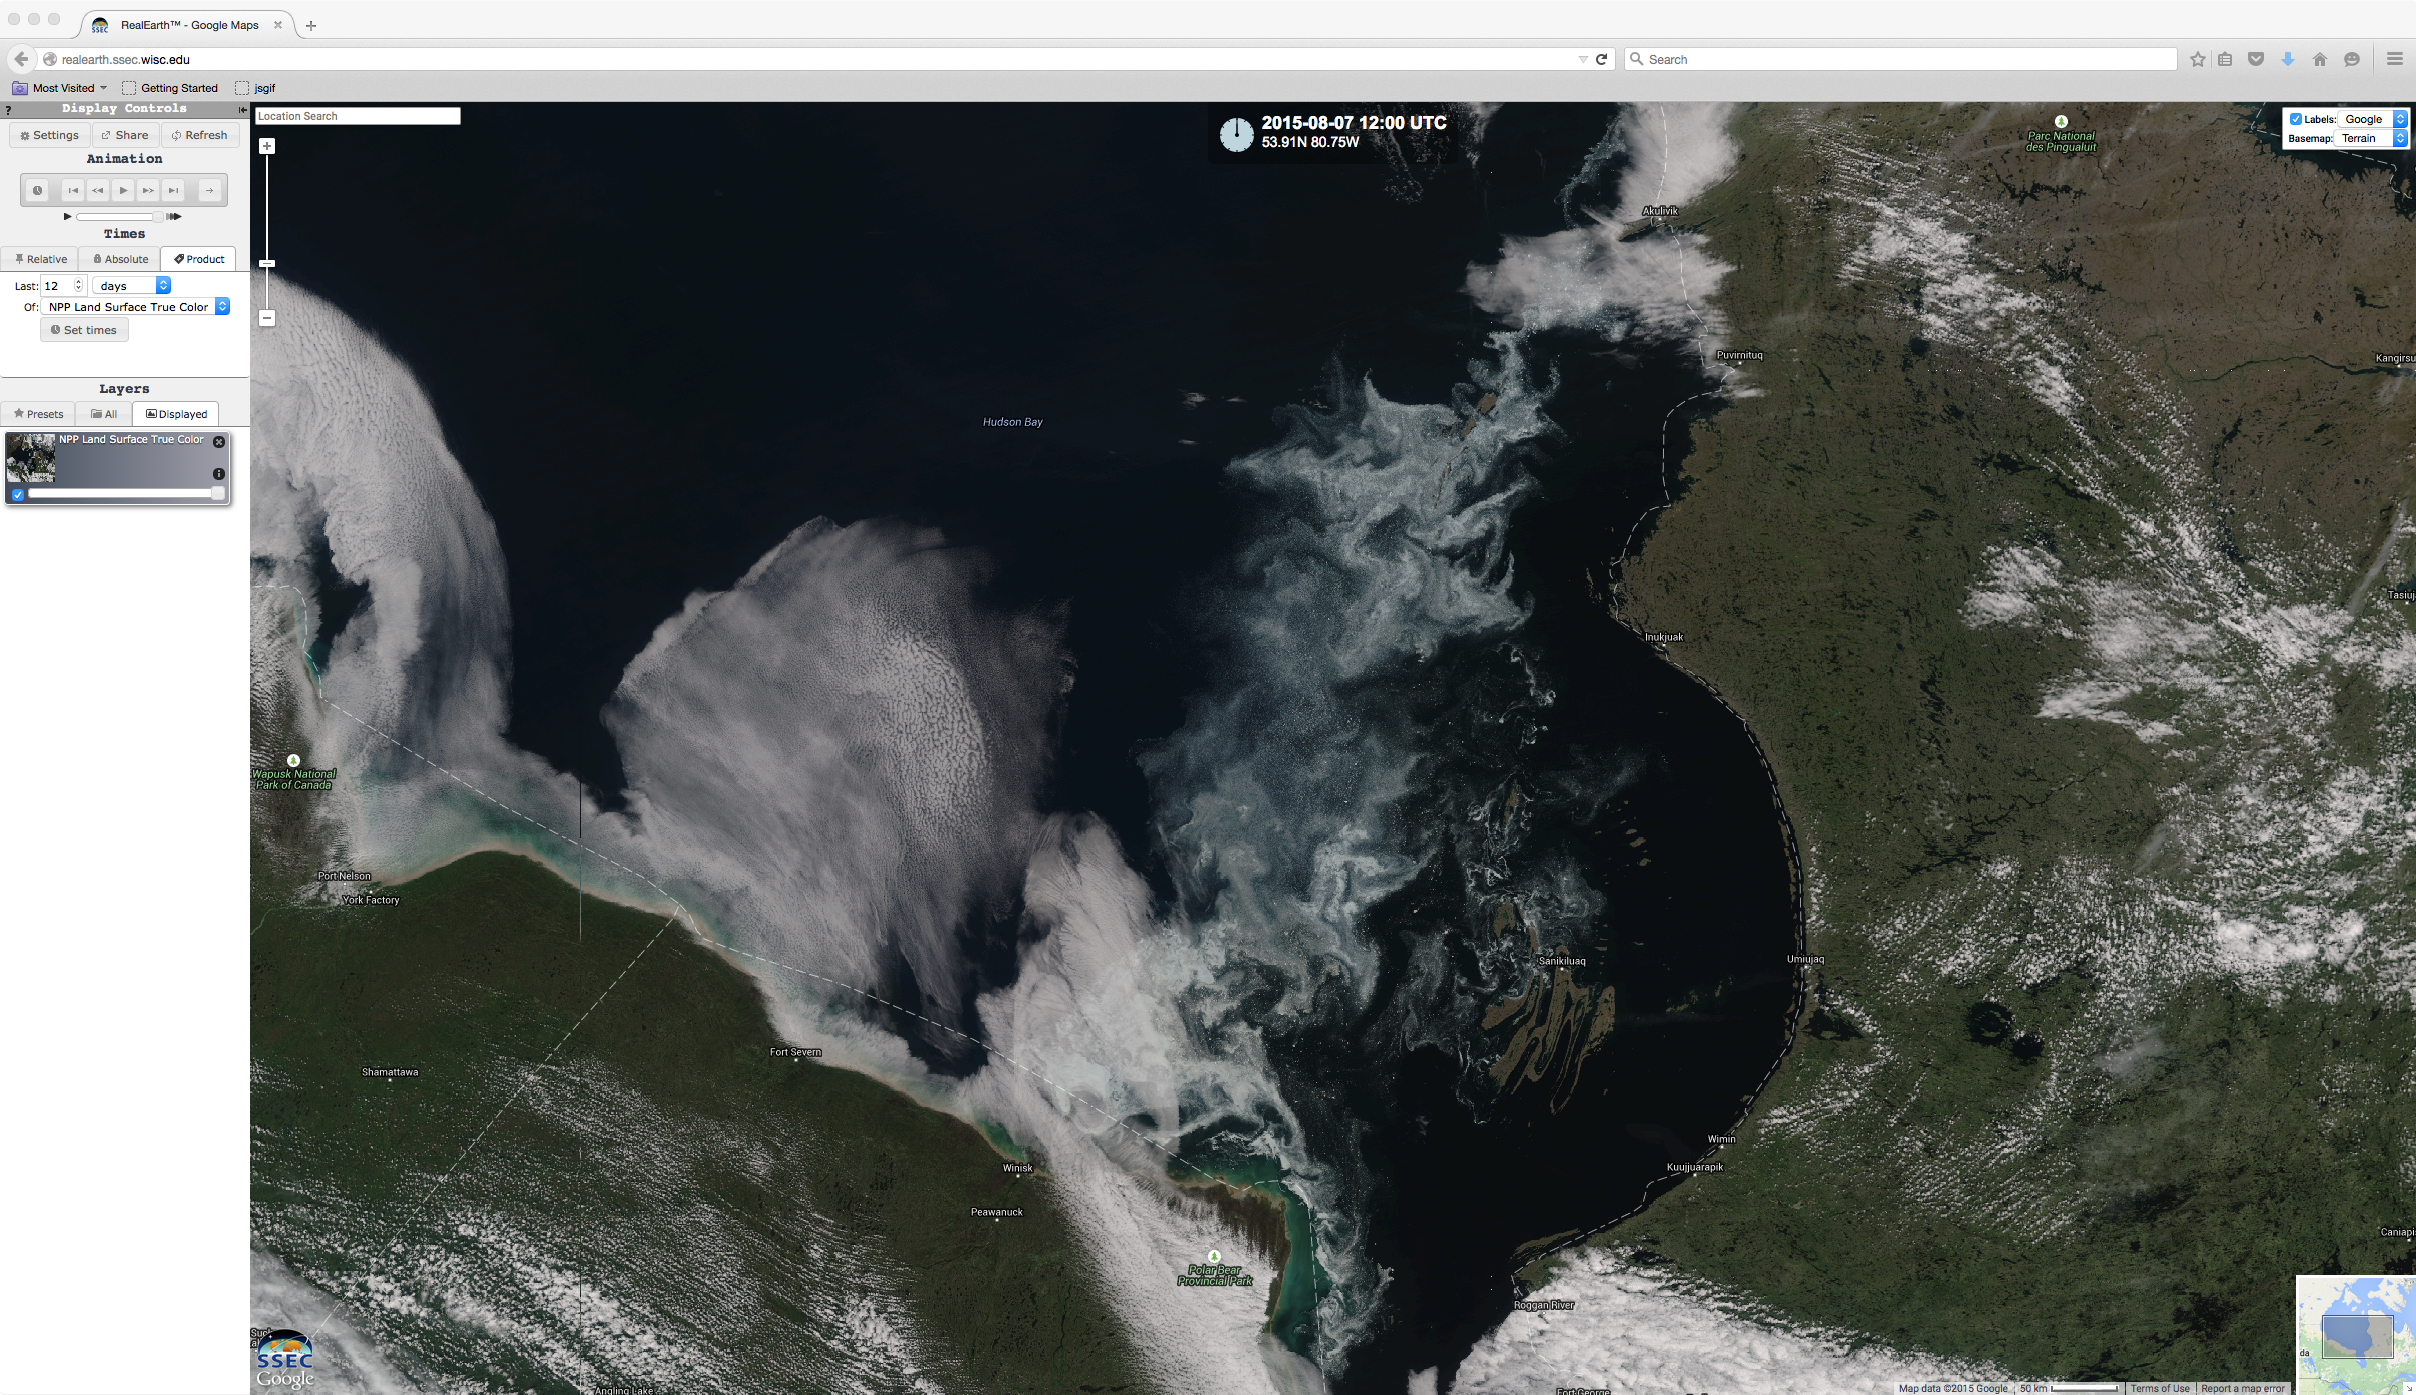
![GOES-13 visible (0.63 µm) images [click to play animation]](https://cimss.ssec.wisc.edu/satellite-blog/wp-content/uploads/sites/5/2015/08/150807_goes13_visible_Hudson_Bay_ice_anim.gif)
![Terra MODIS true-color and false-color images [click to enlarge]](https://cimss.ssec.wisc.edu/satellite-blog/wp-content/uploads/sites/5/2015/08/150807_1611utc_terra_modis_truecolor_falsecolor_Hudson_Bay_ice_anim.gif)
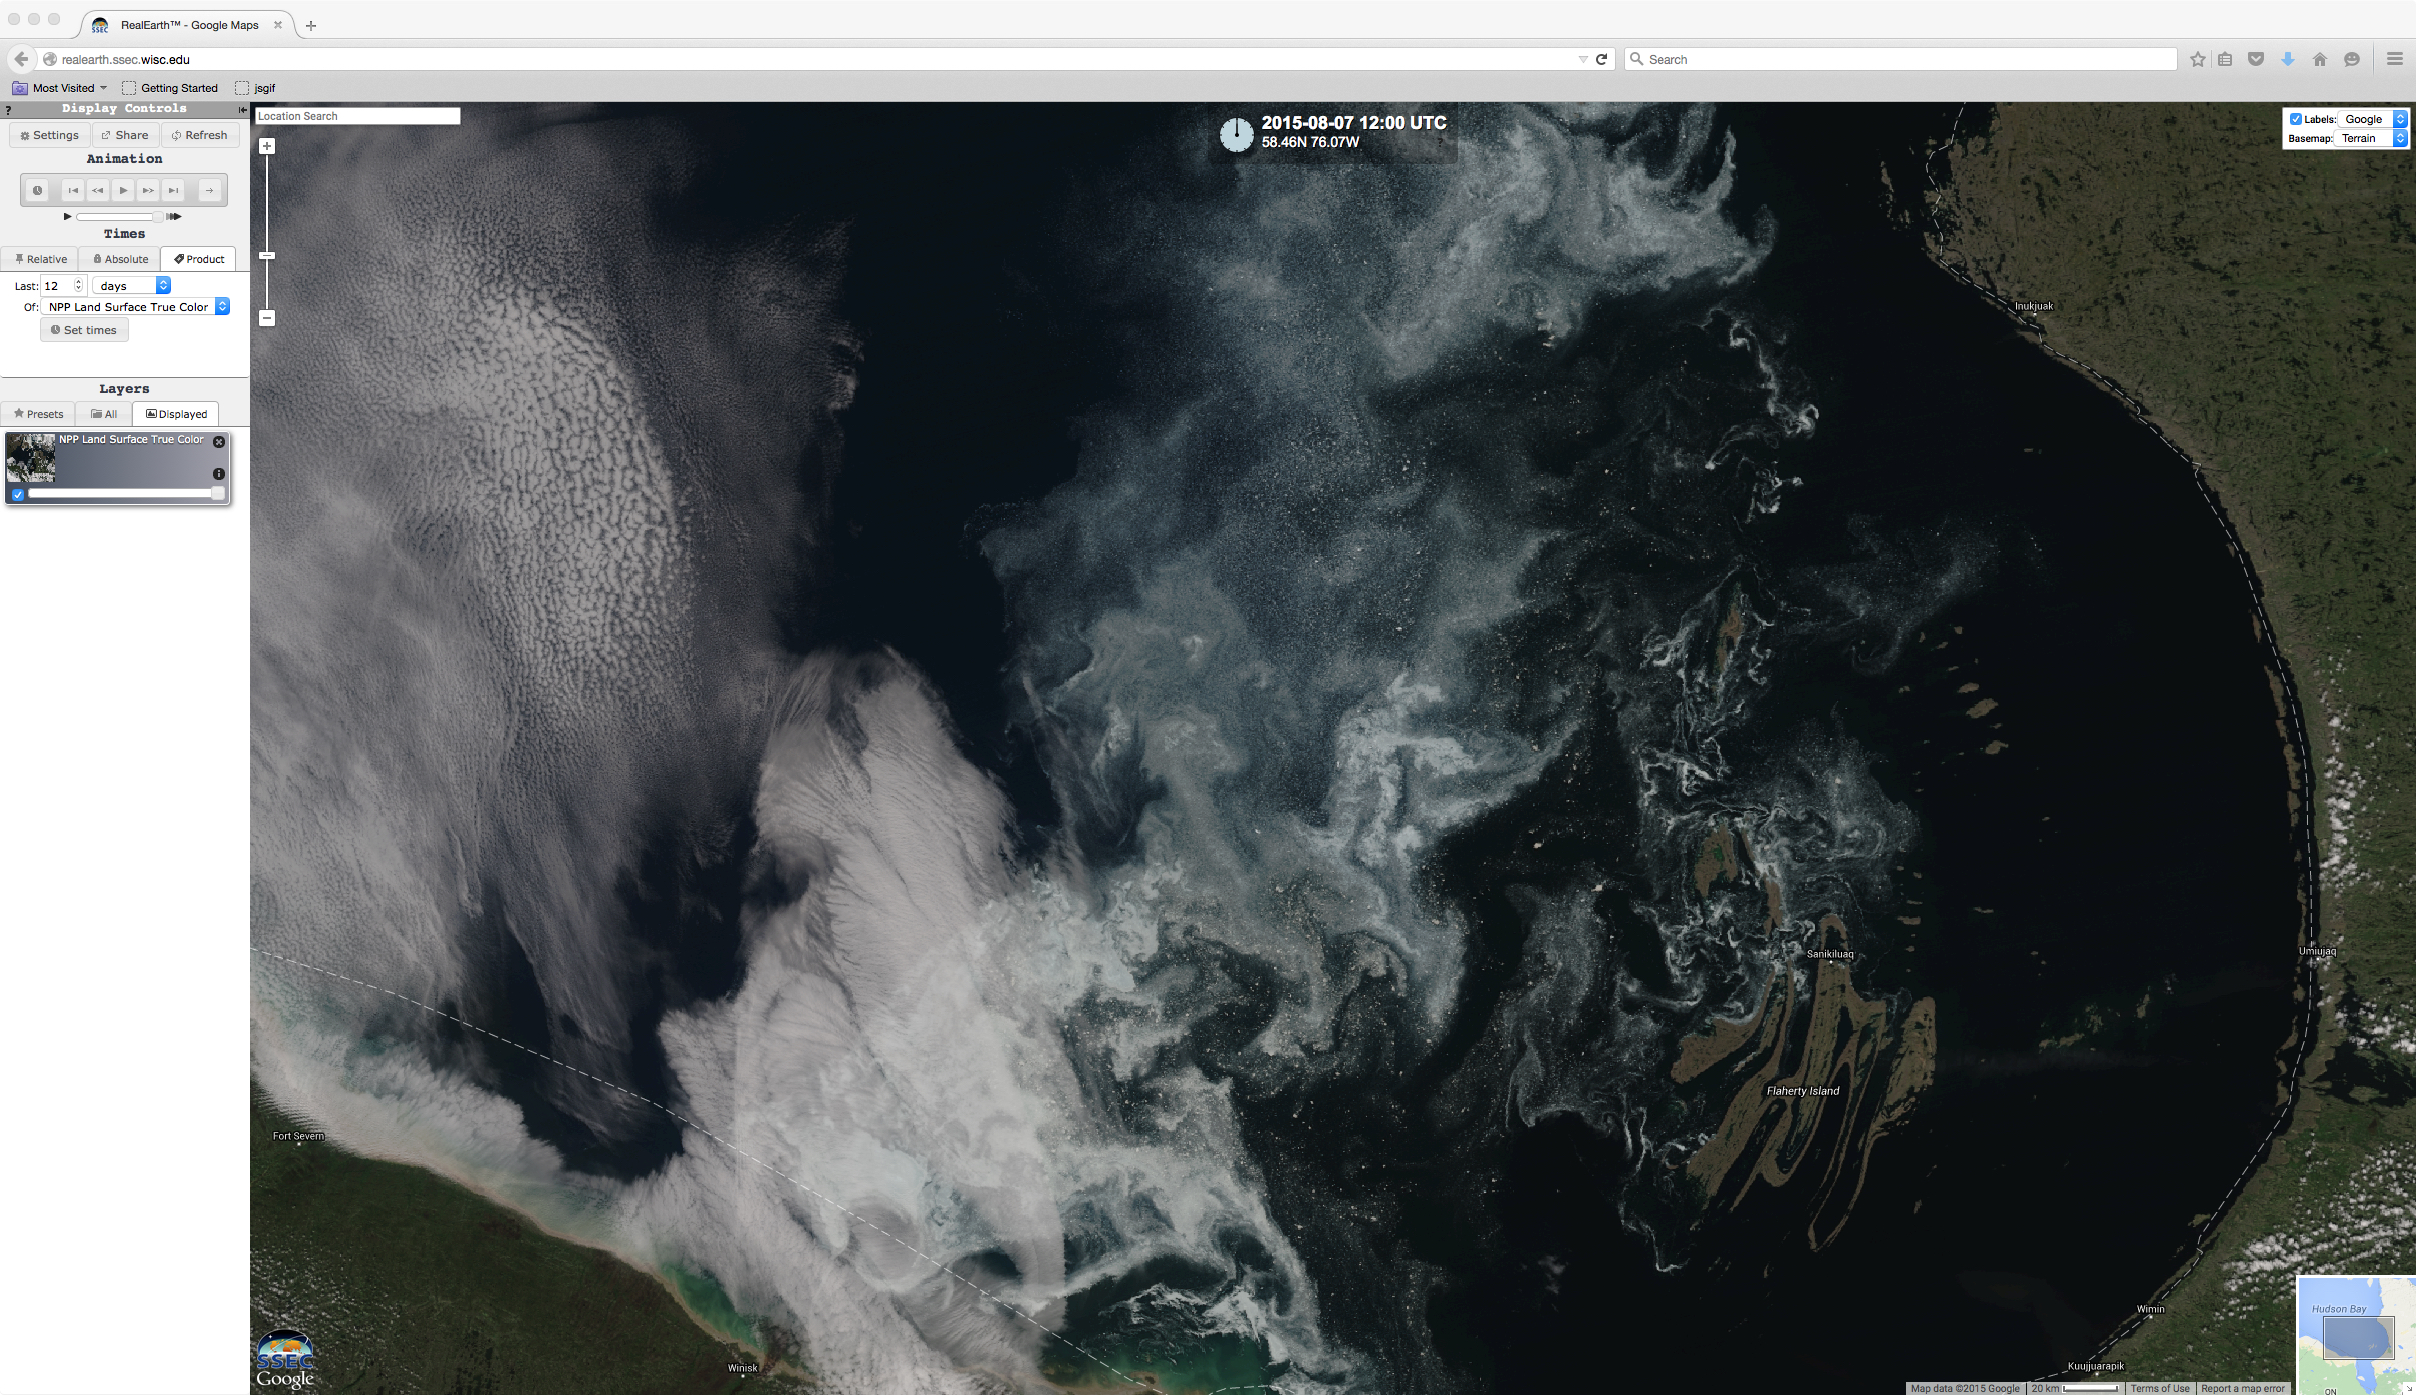
![Suomi NPP VIIRS true-color image [click to enlarge]](https://cimss.ssec.wisc.edu/satellite-blog/wp-content/uploads/sites/5/2015/08/150807_1800utc_suomi_npp_viirs_truecolor_Hudson_Bay_ice.jpg)
![Hudson Bay ice concentration [click to enlarge]](https://cimss.ssec.wisc.edu/satellite-blog/wp-content/uploads/sites/5/2015/08/150807_Hudson_Bay_ice_concentration.gif)
![Hudson Bay ice stage [click to enlarge]](https://cimss.ssec.wisc.edu/satellite-blog/wp-content/uploads/sites/5/2015/08/150807_Hudson_Bay_ice_stage.gif)
![Hudson Bay ice concentration departure from normal [click to enlarge]](https://cimss.ssec.wisc.edu/satellite-blog/wp-content/uploads/sites/5/2015/08/150803_Hudson_Bay_departure_from_normal_ice_concentration.gif)


![Morphed Microwave Imagery centered on Soudelor, 1200 UTC 3 August - 1200 UTC 5 August 2015 [click to enlarge]](https://cimss.ssec.wisc.edu/satellite-blog/wp-content/uploads/sites/5/2015/08/Soudelorlast48hrs_ending1200UTC5AugMIMIC.gif)
![Himawari-8 0.52 µm imagery, 3-4 August 2015 [click to play animation]](https://cimss.ssec.wisc.edu/satellite-blog/wp-content/uploads/sites/5/2015/08/1000x1000_AHIM08_B2_SOUDELOR_animated_2015215_203215_86_2015216_095945_86_GRAY.gif)
![Suomi NPP VIIRS Day/Night Band visible imager (0.70 µm) and infrared (11.45 µm) image at 1608 UTC 4 August 2015 [click to enlarge]](https://cimss.ssec.wisc.edu/satellite-blog/wp-content/uploads/sites/5/2015/08/ToggleI05_DNB_080415_1608_1.5E-8_TCSoudelor.gif)
