Tropical Storm Pali has formed in the central Pacific, in a region east-southeast of Kwajalein Atoll (which atoll is at 9 N, 168 E), just west of warm Sea Surface Temperature anomalies (Source) associated with the ongoing El Nino. For the Central Pacific basin, Pali set new records for being the earliest-forming tropical cyclone on record... Read More
![Himawari-8 Water Vapor (6.2 µm) infrared Imagery [click to animate], imagery Courtesy JMA](https://cimss.ssec.wisc.edu/satellite-blog/wp-content/uploads/sites/5/2016/01/960x1280_HIMAWARI_B8_Pali_H8_2016008_150000_0001PANEL.GIF)
Himawari-8 Water Vapor (6.2 µm) infrared Imagery [click to animate], imagery Courtesy JMA
Tropical Storm Pali has formed in the central Pacific, in a region east-southeast of Kwajalein Atoll (which atoll is at 9 N, 168 E), just west of
warm Sea Surface Temperature anomalies (
Source) associated with the ongoing El Nino. For the
Central Pacific basin, Pali set new records for being the earliest-forming tropical cyclone on record (21 UTC on 7 January), as well as the most Equatorward-forming (at 4.7º N). The Himawari animation, above, of the 6.2 µm Water Vapor imagery from 0000 UTC on 7 January through 1500 UTC 8 January 2016 (
mp4 available here), shows impressive upper-level outflow from the region of convection surrounding the storm center. A longer animation of Himawari 10.4 µm Infrared imagery (from 0000 UTC 06 January to 0650 UTC on 8 January) is available
here. The Composite Infrared Imagery from AWIPS II, below, shows the slow but steady organization of the storm. Infrared brightness temperatures are very cold, with temperatures occasionally colder than -95º C.
![Composite Infrared Imagery (10.7 µm) 0600 UTC 6 January 2016 - 1500 UTC on 8 January 2016 [click to animate]](https://cimss.ssec.wisc.edu/satellite-blog/wp-content/uploads/sites/5/2016/01/CompositeIR_1500UTC_8January2016.png)
Composite Infrared Imagery (10.7 µm) 0600 UTC 6 January 2016 – 1500 UTC on 8 January 2016 [click to animate]
Pali is forming in a region that allows views from both GOES-15 (overhead at the Equator and 135º W) and Himawari-8 (overhead at the Equator and 140º E). The Infrared animation below shows GOES-15 at Full Resolution from the Full Disk Imagery that is used to view Pali. Note that Himawari data has been degraded both spatially and temporally in the animation (to match that of GOES).
![GOES-15 Infrared Imagery (10.7 µm) (left) and Himawari-8 Infrared (right) (10.35) at full GOES Resolution 0600 UTC 8 January 2016 - 1800 UTC 8 January 2016 [click to animate]](https://cimss.ssec.wisc.edu/satellite-blog/wp-content/uploads/sites/5/2016/01/GOESH8_WINDOW_0900UTC_08Jan2016.GIF)
GOES-15 Infrared Imagery (10.7 µm) (left) and Himawari-8 Infrared (right) (10.35) at full GOES Resolution 0600 UTC 8 January 2016 – 1800 UTC 8 January 2016 [click to animate]
An animation that is at full resolution for Himawari-8, for just 3 hours, from 0600-0900 UTC, is below. Only two GOES-15 Images are available during this time period that includes 19 Himawari-8 images. (Note also the increase in spatial resolution with Himawari, from 4 km for GOES to 2 km for Himawari) There is considerable evolution to the storm during these three hours that present-day GOES cannot view because of limited scanning capabilities. GOES-R will provide spatial resolution and image scan rates identical to Himawari-8 so meteorologists will be better able to monitor storm evolution.
![GOES-15 Infrared Imagery (10.7 µm) (left) and Himawari-8 Infrared (right) (10.35) at full Himawari-8 Resolution 0600 UTC 8 January 2016 - 0900 UTC 8 January 2016 [click to animate]](https://cimss.ssec.wisc.edu/satellite-blog/wp-content/uploads/sites/5/2016/01/H8GOES_WINDOW_0900UTC_06Jan2016.GIF)
GOES-15 Infrared Imagery (10.7 µm) (left) and Himawari-8 Infrared (right) (10.35) at full Himawari-8 Resolution 0600 UTC 8 January 2016 – 0900 UTC 8 January 2016 [click to animate]
Himawari True-Color Imagery, below, shows both Pali, a large relatively disorganized system in the central north Pacific and Cyclone Ula, a compact and more organized system in the tropical south Pacific. Himawari True-Color (actually a 4-banded composite meant to emulate True Color) imagery is routinely available
here.
![Himawari-8 True-Color Visible Imagery [click to enlarge], imagery Courtesy JMA](https://cimss.ssec.wisc.edu/satellite-blog/wp-content/uploads/sites/5/2016/01/H8_TrueColor_0230UTC_8Januar2016.png)
Himawari-8 True-Color Visible Imagery [click to enlarge], imagery Courtesy JMA
View only this post
Read Less
![Himawari-8 Water Vapor (6.2 µm) infrared Imagery [click to animate], imagery Courtesy JMA](https://cimss.ssec.wisc.edu/satellite-blog/wp-content/uploads/sites/5/2016/01/960x1280_HIMAWARI_FD_B8_Pali_H8_animated_2016007_000000_86_2016008_150000_86_WVSCOTT.gif)
![Composite Infrared Imagery (10.7 µm) 0600 UTC 6 January 2016 - 1500 UTC on 8 January 2016 [click to animate]](https://cimss.ssec.wisc.edu/satellite-blog/wp-content/uploads/sites/5/2016/01/CompositeIRAnimation_10.7.gif)
![GOES-15 Infrared Imagery (10.7 µm) (left) and Himawari-8 Infrared (right) (10.35) at full GOES Resolution 0600 UTC 8 January 2016 - 1800 UTC 8 January 2016 [click to animate]](https://cimss.ssec.wisc.edu/satellite-blog/wp-content/uploads/sites/5/2016/01/GOESH8_WINDOW_0600_1800UTC_08Jan2016anim.gif)
![GOES-15 Infrared Imagery (10.7 µm) (left) and Himawari-8 Infrared (right) (10.35) at full Himawari-8 Resolution 0600 UTC 8 January 2016 - 0900 UTC 8 January 2016 [click to animate]](https://cimss.ssec.wisc.edu/satellite-blog/wp-content/uploads/sites/5/2016/01/H8GOES_WINDOW_0600_0900UTC_06Jan2016anim.gif)
![GOES-15 Water Vapor (6.5 µm) infrared Imagery [click to animate]](https://cimss.ssec.wisc.edu/satellite-blog/wp-content/uploads/sites/5/2016/01/GOES15_WV_06January2016_0600_2000anim.gif)
![MIMIC Total Precipitable Water for the 72 hours ending 1800 UTC on 6 January [click to enlarge]](https://cimss.ssec.wisc.edu/satellite-blog/wp-content/uploads/sites/5/2016/01/MIMICTPWlatest72hrs_ending1800UTC_6January2016.gif)

![GOES-13 Visible (0.65 µm) Imagery, 1300-2045 UTC on 5 January 2015 [click to animate]](https://cimss.ssec.wisc.edu/satellite-blog/wp-content/uploads/sites/5/2016/01/GOES13_BAYEFFECT_5JAN2015anim_1300_2045.gif)
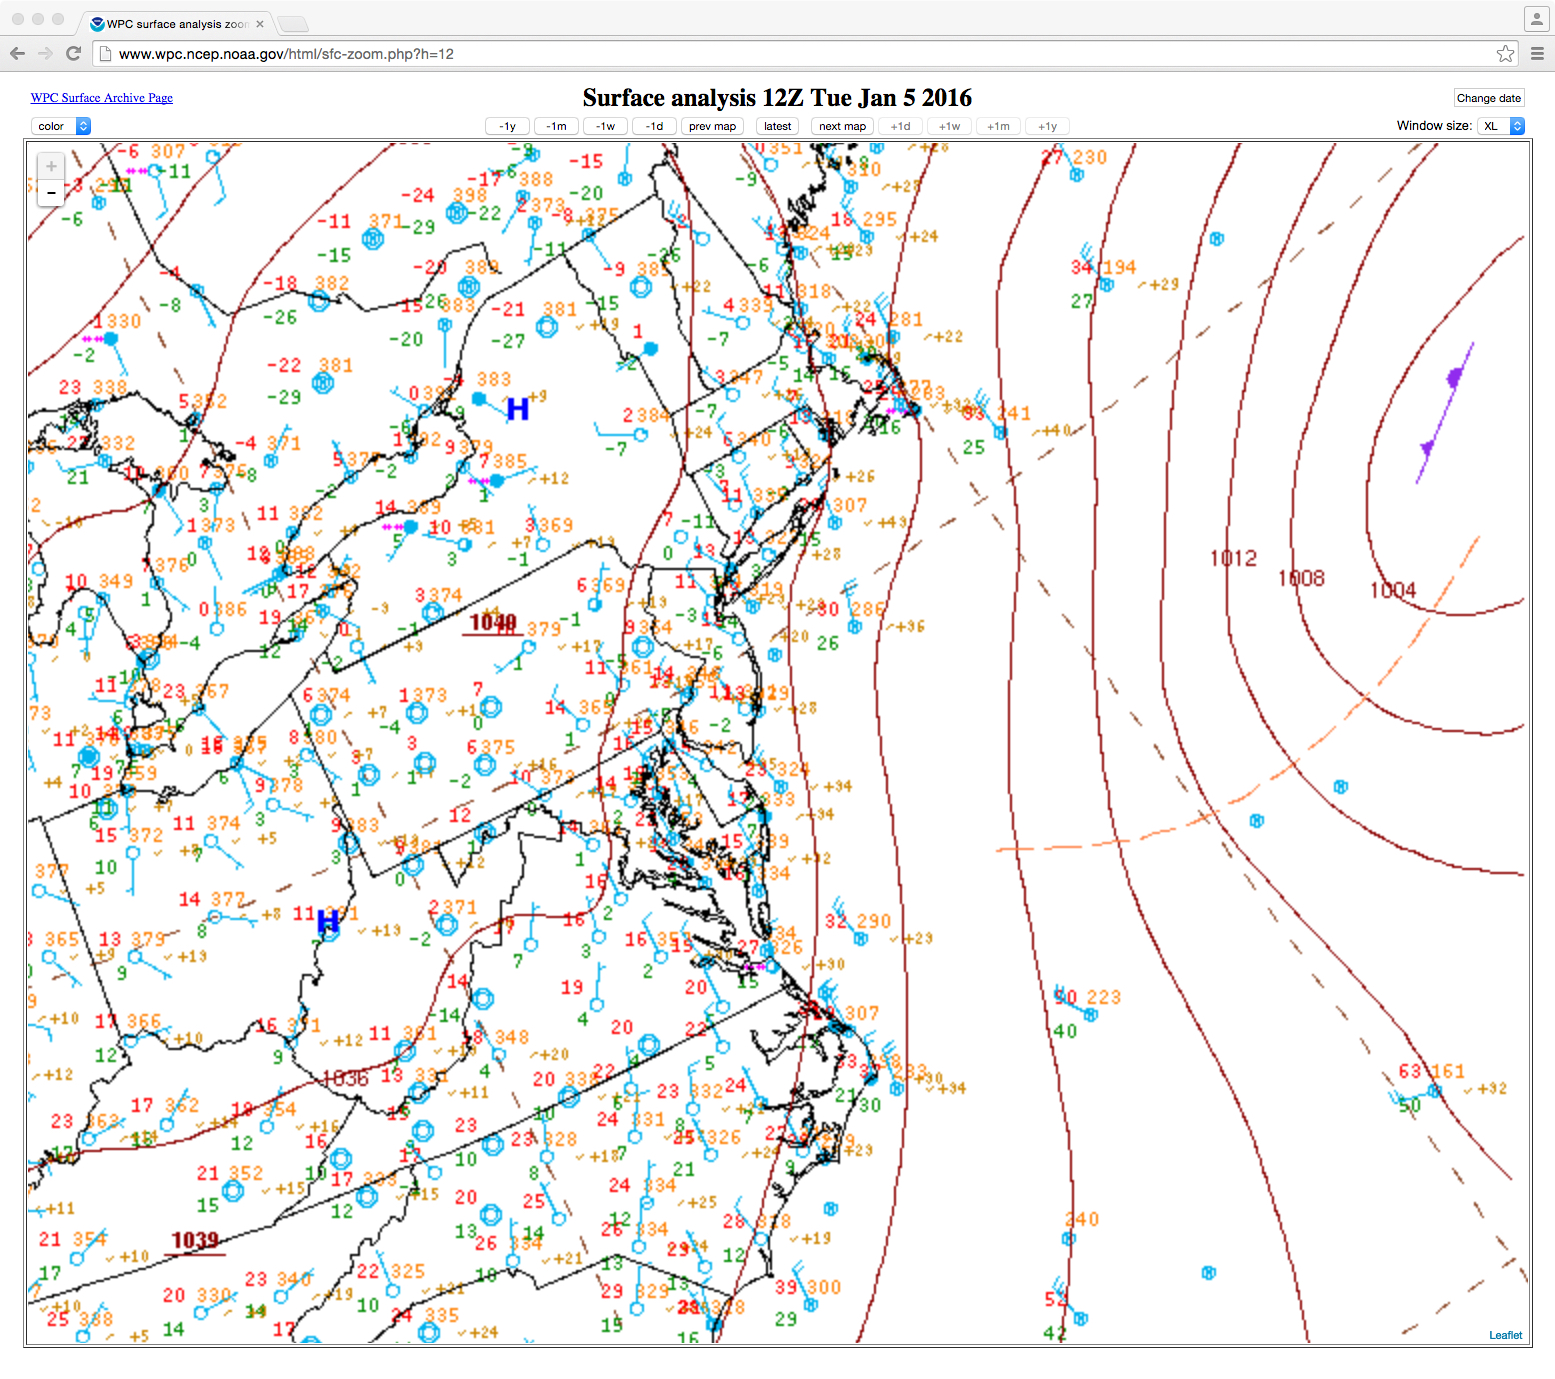
![GOES-13 Visible (0.65 µm) Imagery, 1300 and 2045 UTC on 5 January 2015, with surface weather observations and wind barbs [click to enlarge]](https://cimss.ssec.wisc.edu/satellite-blog/wp-content/uploads/sites/5/2016/01/GOES13_SURFACEOBS_1300_2100UTC_5JANUARY2016toggle.gif)
![MODIS 11.0-3.7 µm IR brightness temperature difference images [click to enlarge]](https://cimss.ssec.wisc.edu/satellite-blog/wp-content/uploads/sites/5/2016/01/160105_modis_fog_stratus_ir_btd_anim.gif)
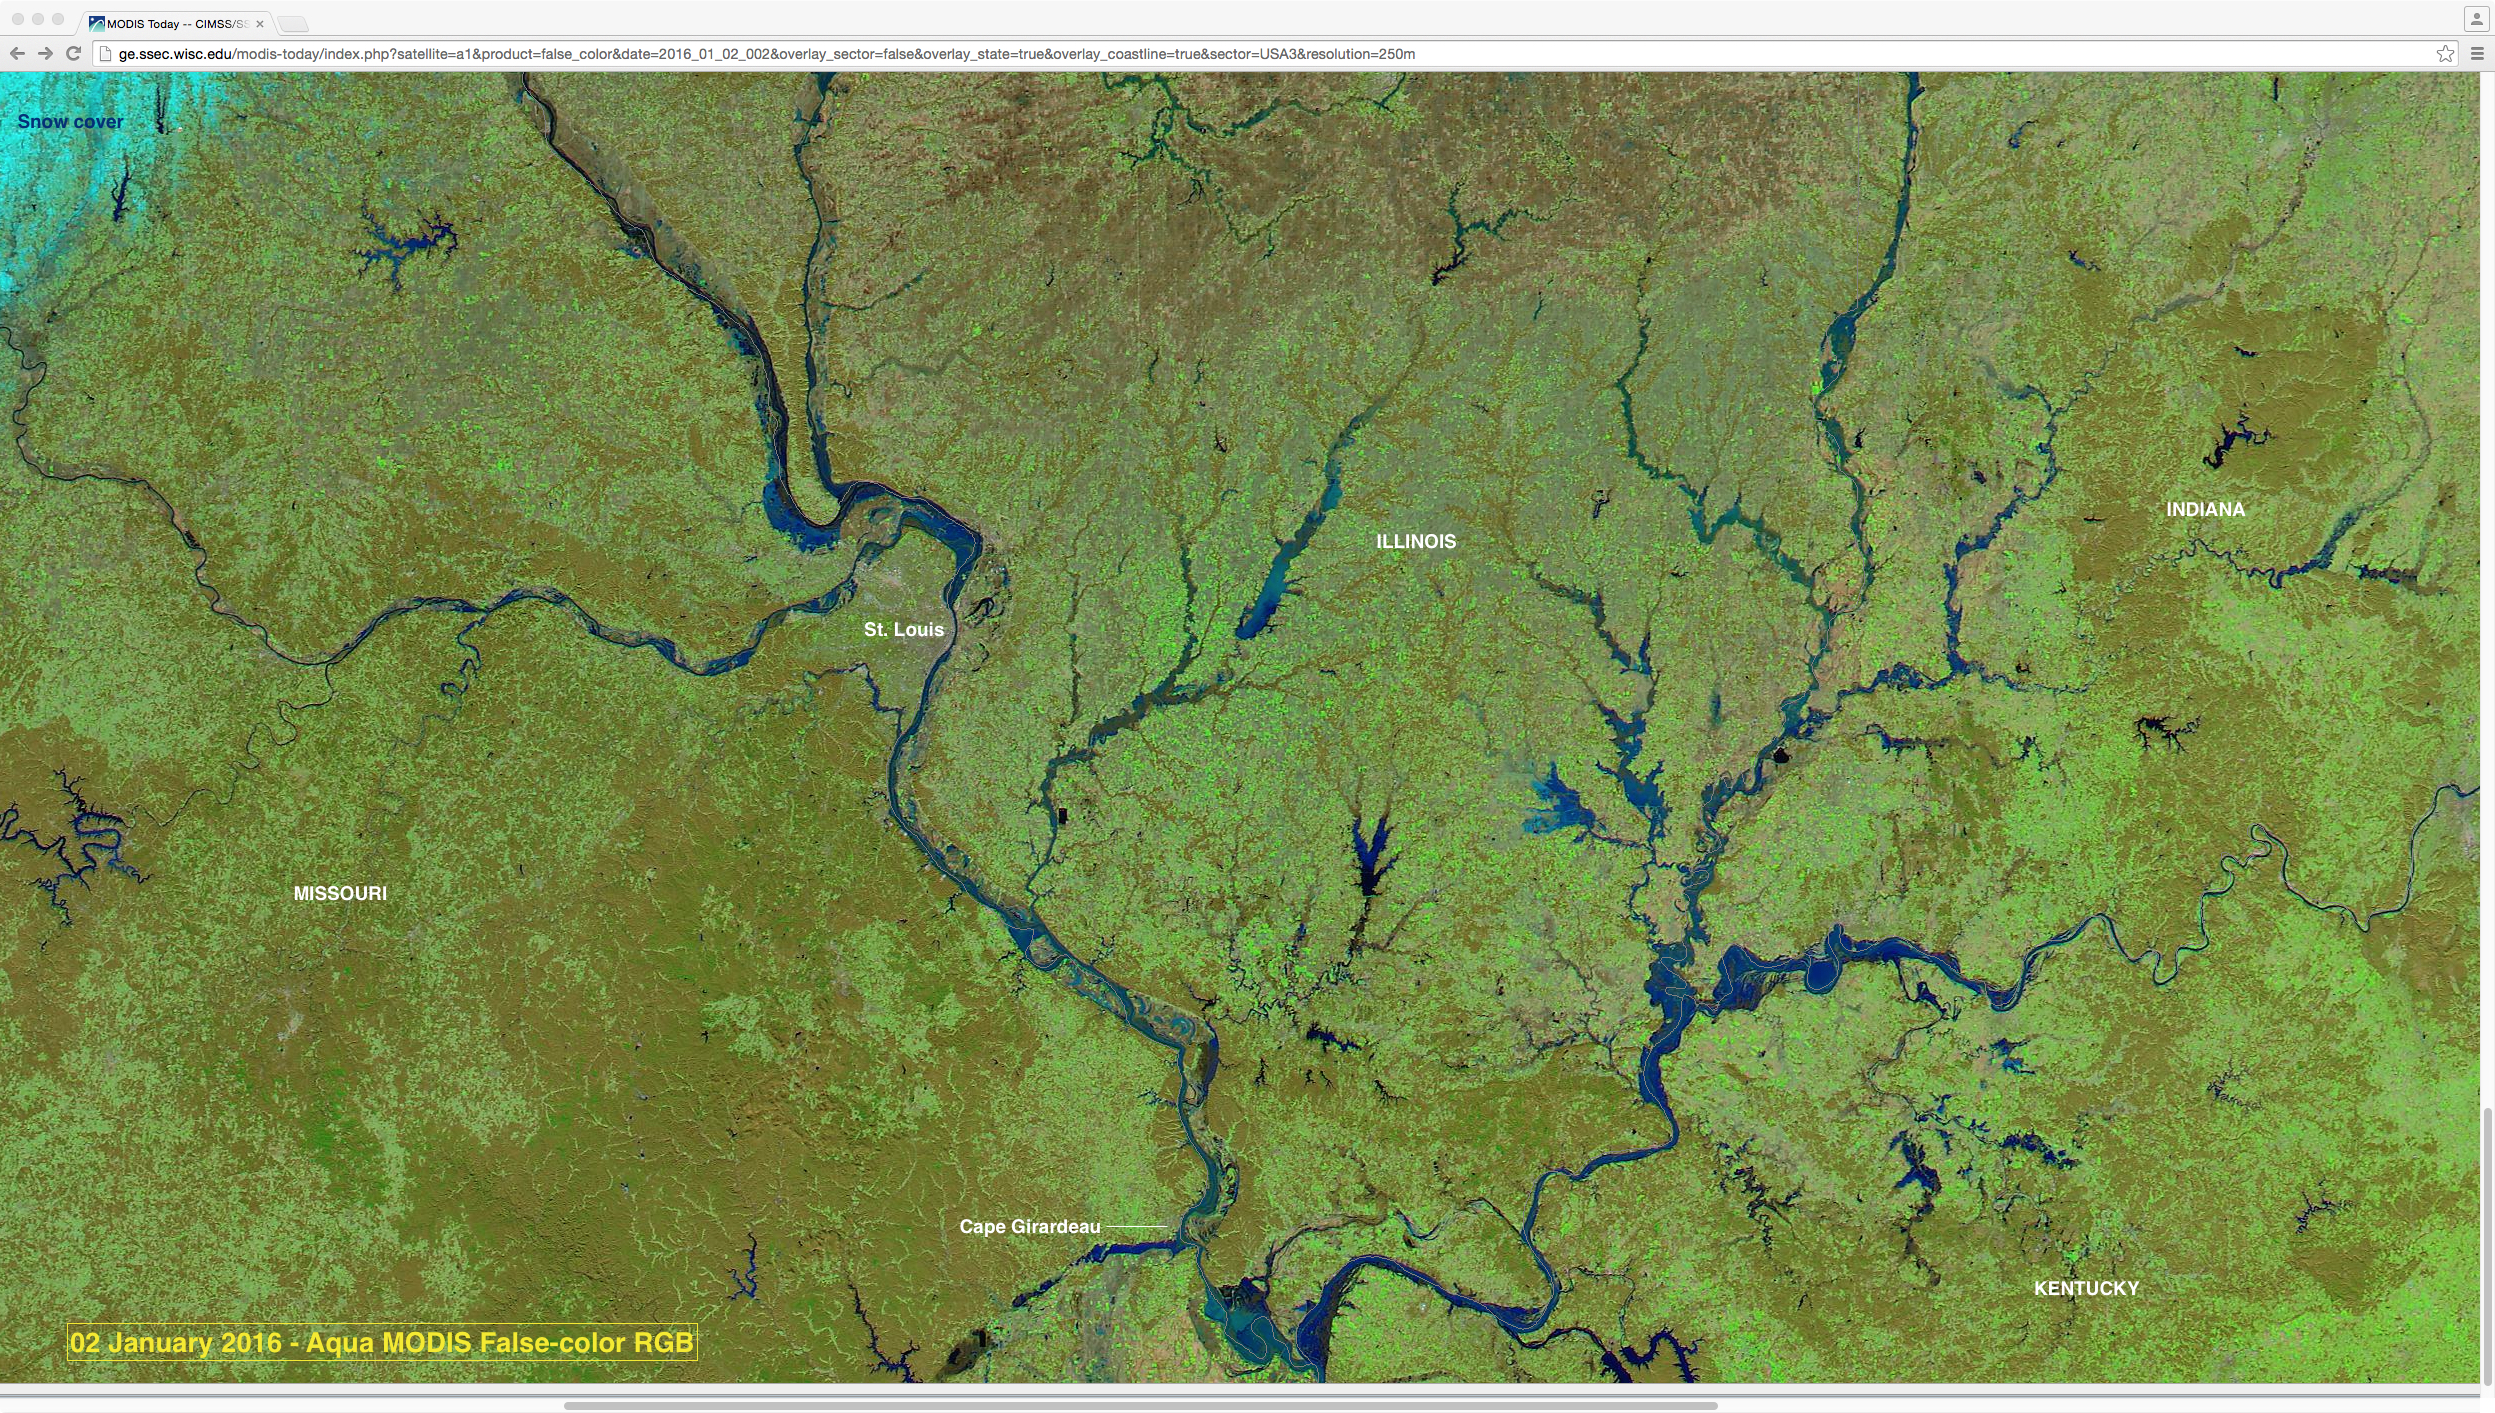
![Aqua MODIS false-color RGB images on 19 December 2015 and 02 January 2016 [click to enlarge]](https://cimss.ssec.wisc.edu/satellite-blog/wp-content/uploads/sites/5/2016/01/Dec2015_Jan2016_modis_falsecolor_MS_OH_River_flooding_anim.gif)
![Aqua MODIS true-color and false-color RGB images on 02 January 2016 [click to enlarge]](https://cimss.ssec.wisc.edu/satellite-blog/wp-content/uploads/sites/5/2016/01/160102_modis_truecolor_falsecolor_MS_OH_River_flooding_anim.gif)
![Landsat-8 false-color image [click to enlarge]](https://cimss.ssec.wisc.edu/satellite-blog/wp-content/uploads/sites/5/2016/01/160102_1623utc_landsat8_falsecolor_IN_KY_flooding_anim.gif)
![19 December 2015 to 02 January 2016 total precipitation and departure from normal [click to enlarge]](https://cimss.ssec.wisc.edu/satellite-blog/wp-content/uploads/sites/5/2016/01/151219_160102_MS_OH_River_region_14day_precipitation_departure_from_normal_anim.gif)
![River gauge plot for the Mississippi River at Cape Girardeau, Missouri [click to enlarge]](https://cimss.ssec.wisc.edu/satellite-blog/wp-content/uploads/sites/5/2016/01/Cape_Girardeau_MO_river_gauge.jpg)
![River gauge for the Mississippi River at Thebes, Illinois [click to enlarge]](https://cimss.ssec.wisc.edu/satellite-blog/wp-content/uploads/sites/5/2016/01/Thebes_IL_river_gauge.jpg)
