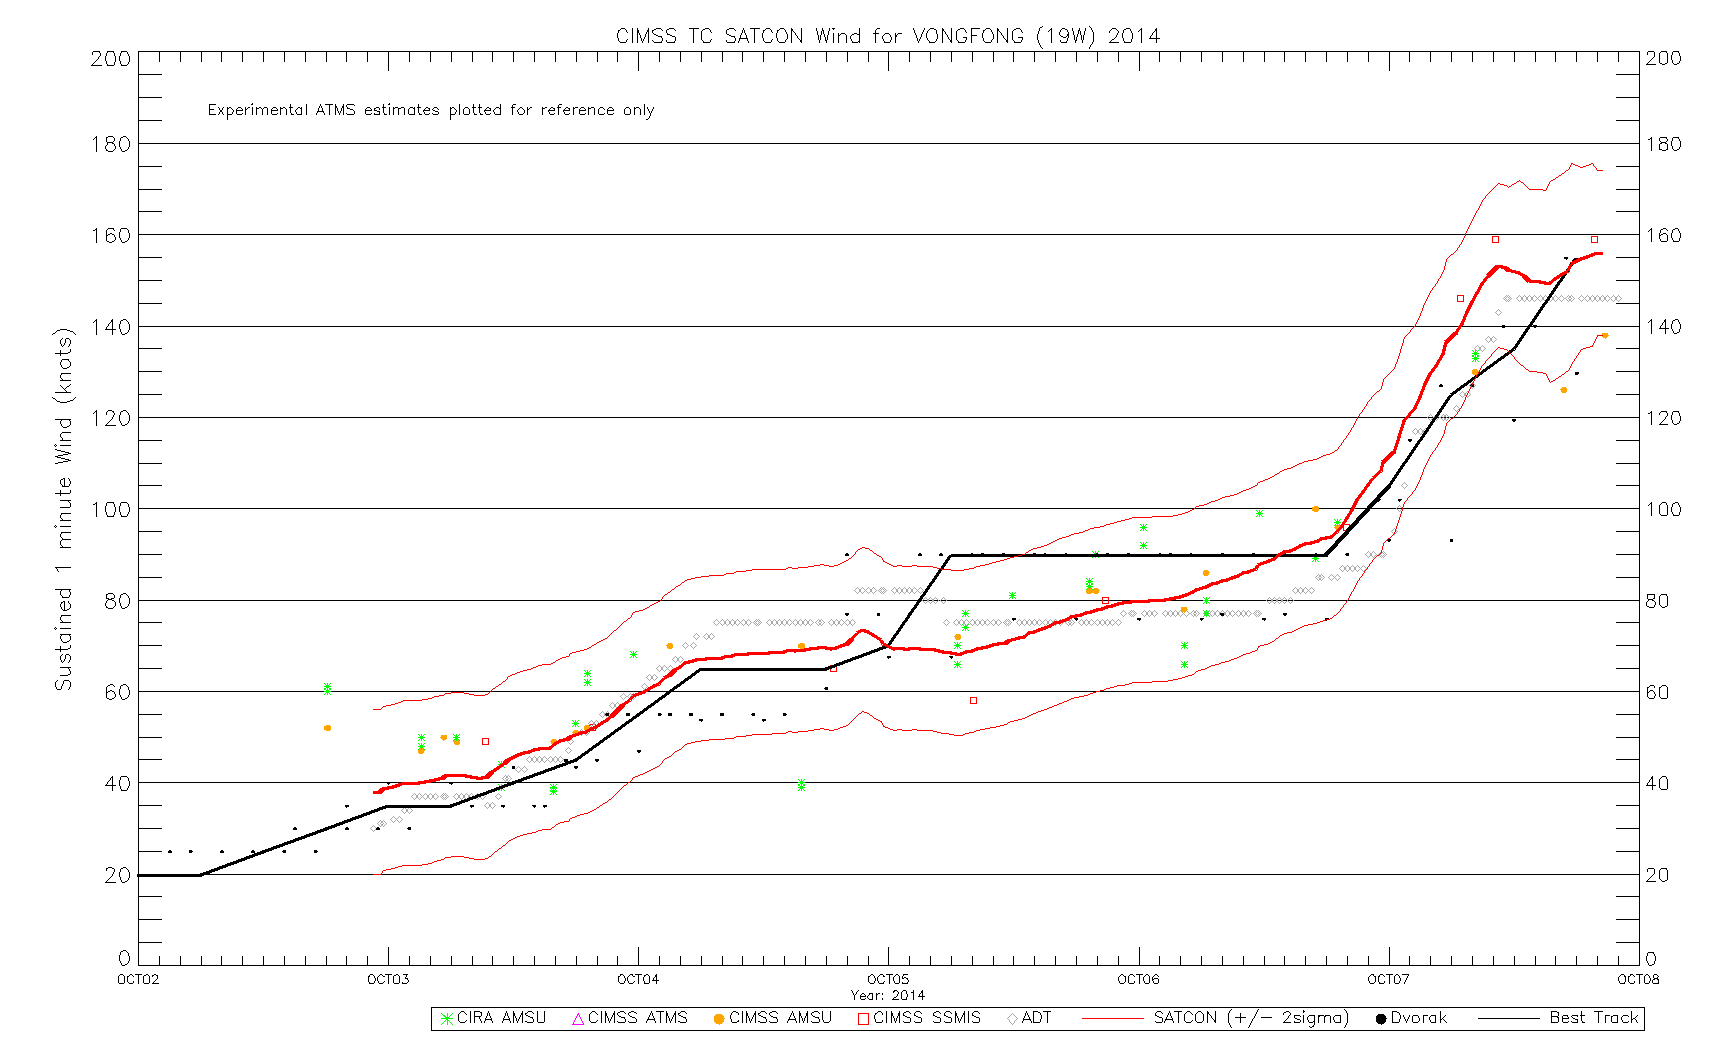
Advanced Dvorak Technique plot for Typhoon Vongfong
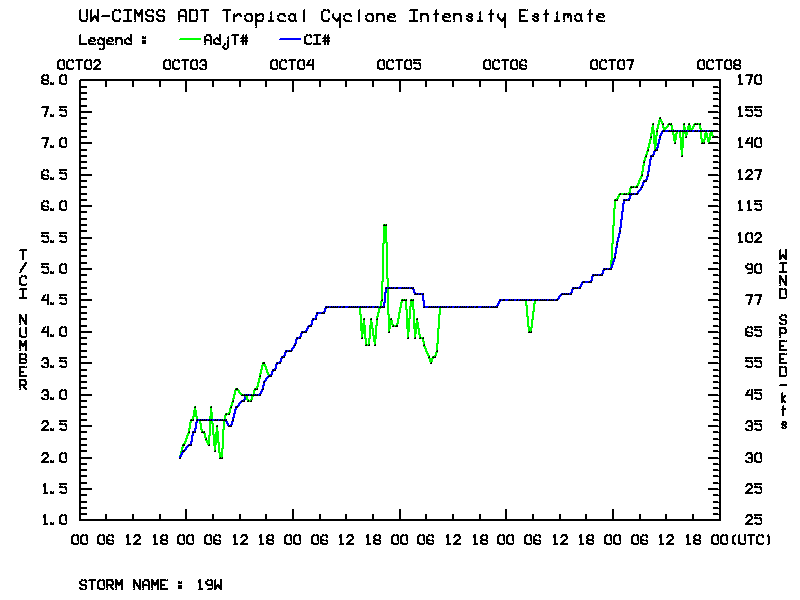
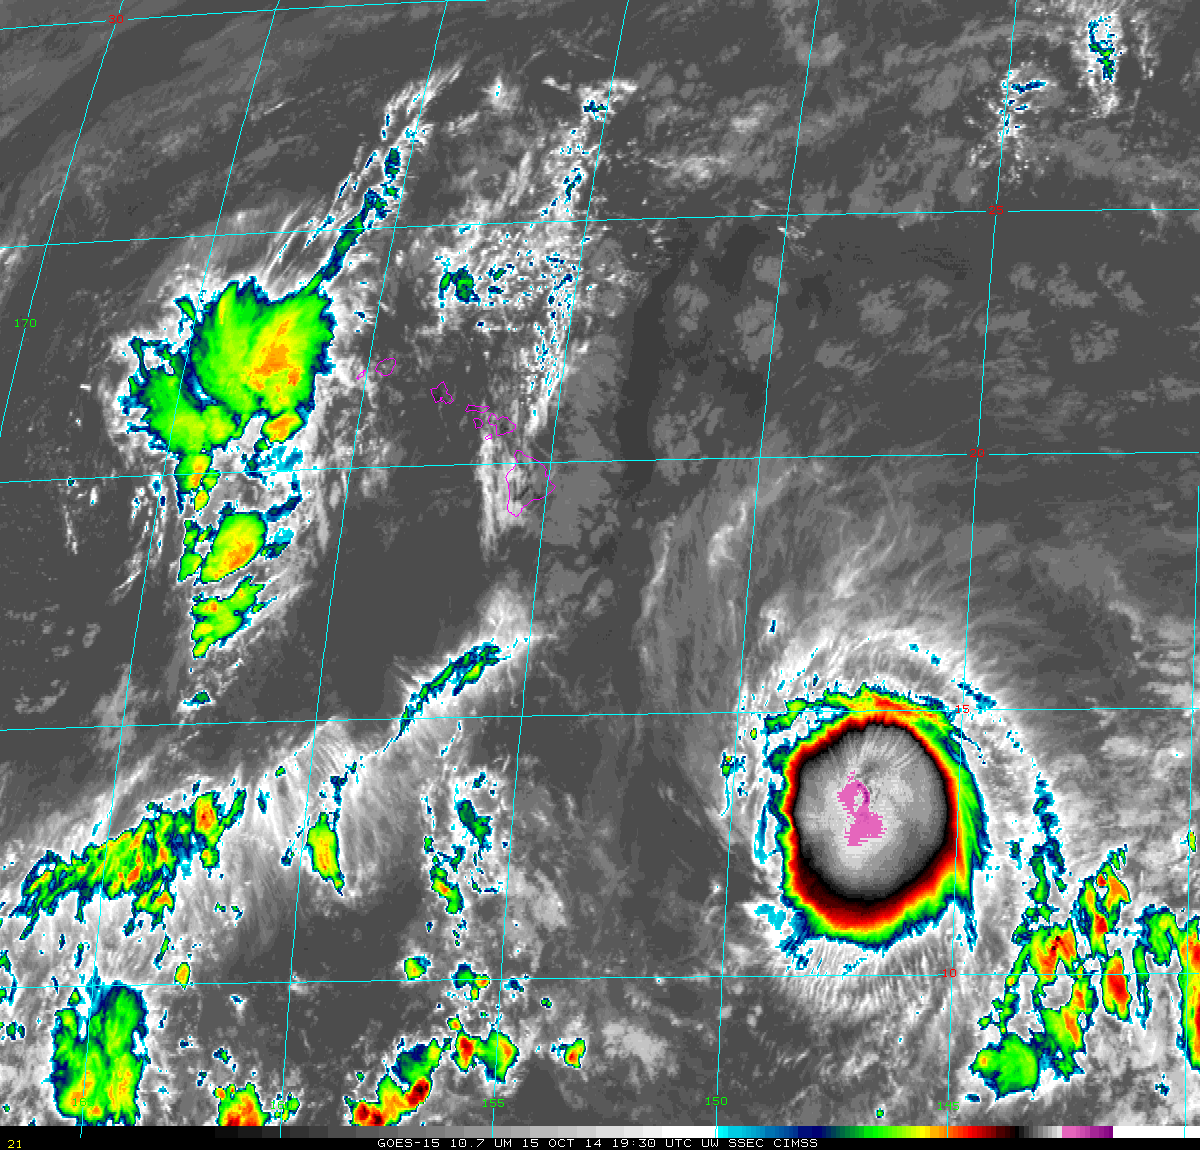
Beginning shortly before 00 UTC on 07 October 2014, Typhoon Vongfong began a period of rapid intensification, as shown on a plot of the Advanced Dvorak Technique (ADT) intensity estimate (above). The peak ADT intensity late in the day was 146 knots. On the other hand, the CIMSS Satellite Consensus or SATCON indicated a peak intensity of 156 knots around that time.
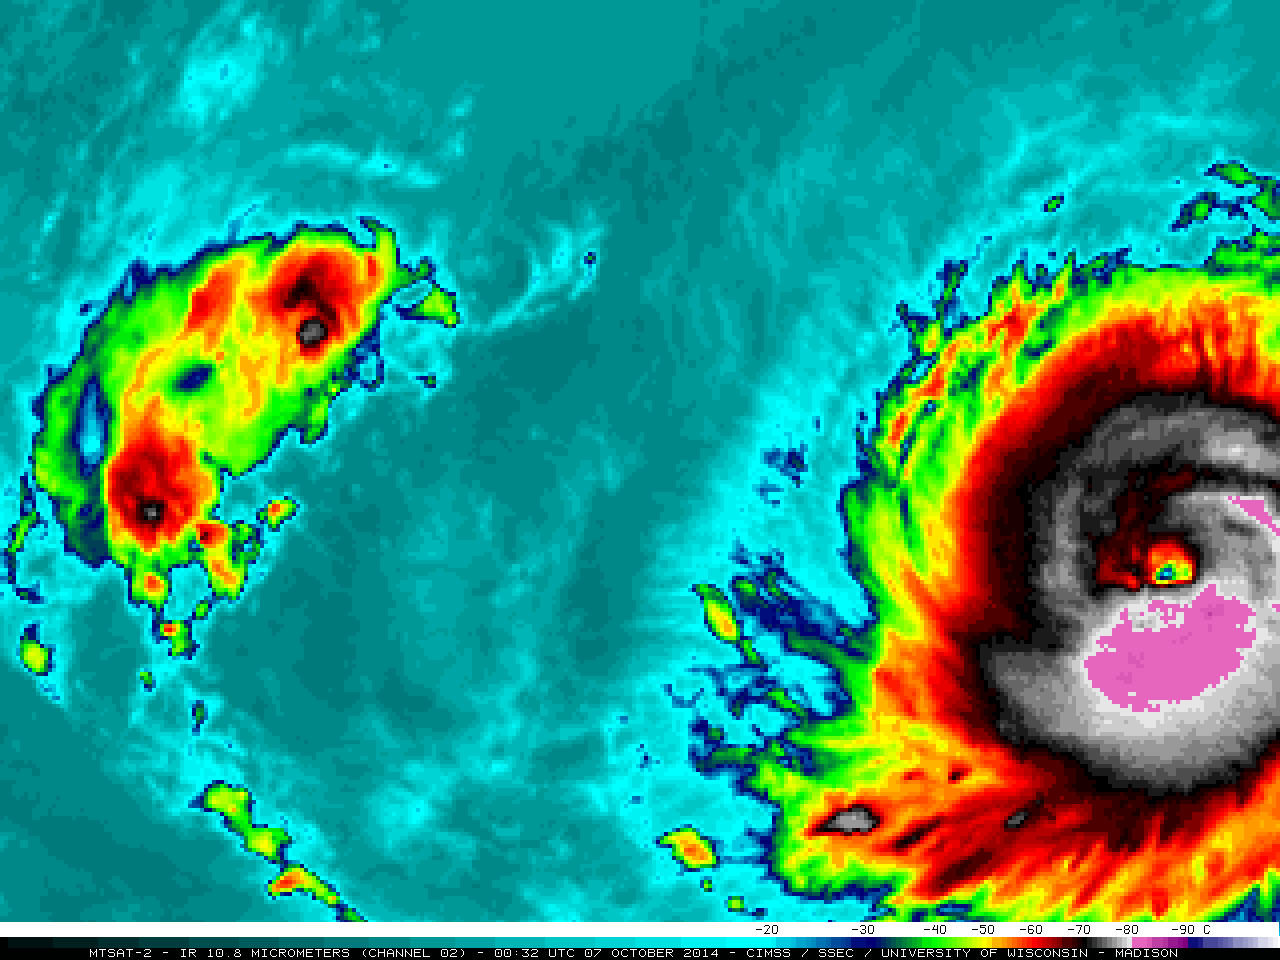
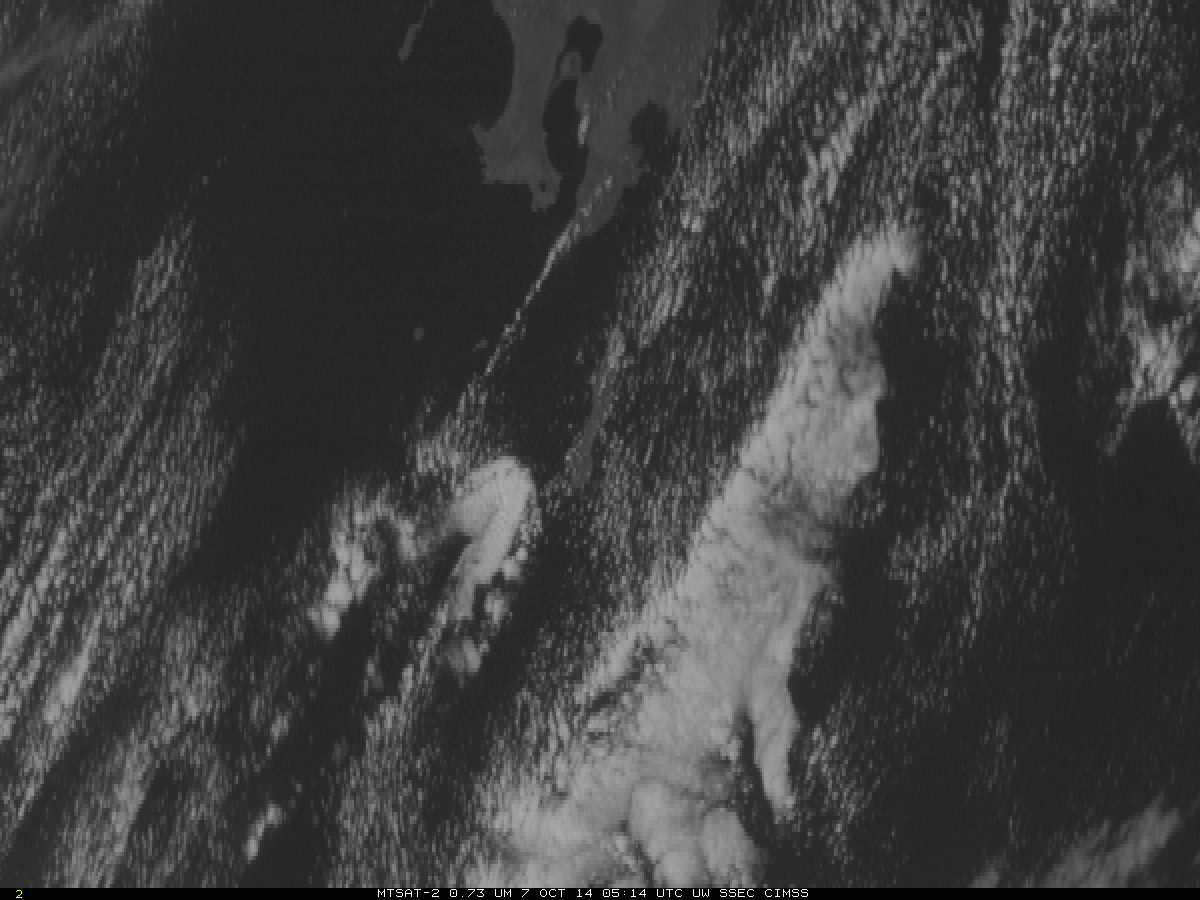
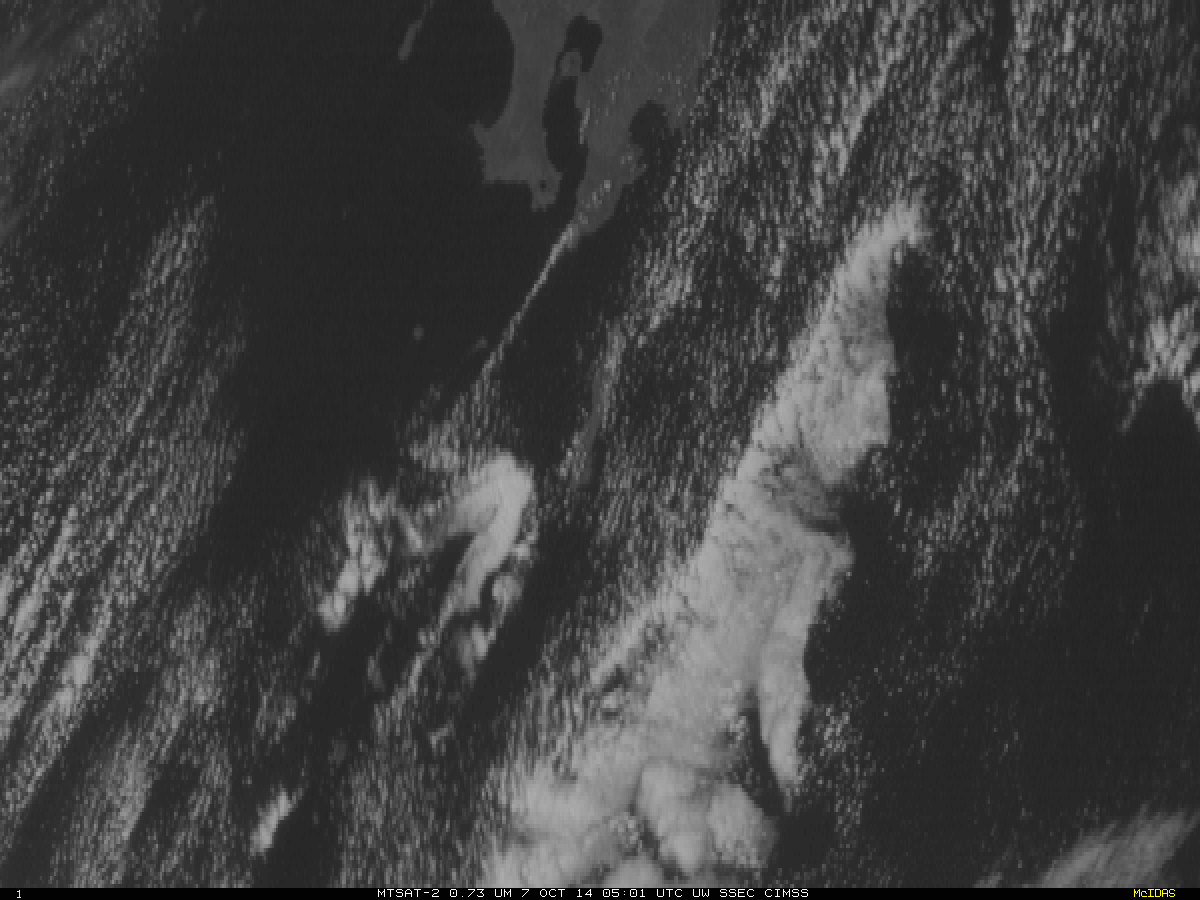
MTSAT-2 10.8 µm IR channel images beginning during the period of rapid intensification on 07 October and extending into 08 October (below; click image to play animation; also available as an MP4 animation) revealed the formation of a very large and well-defined eye. There were large portions of the eyewall which exhibited cloud-top IR brightness temperatures of -80º C and colder (purple color enhancement).
MTSAT-2 10.8 µm IR channel images (click to play animation)
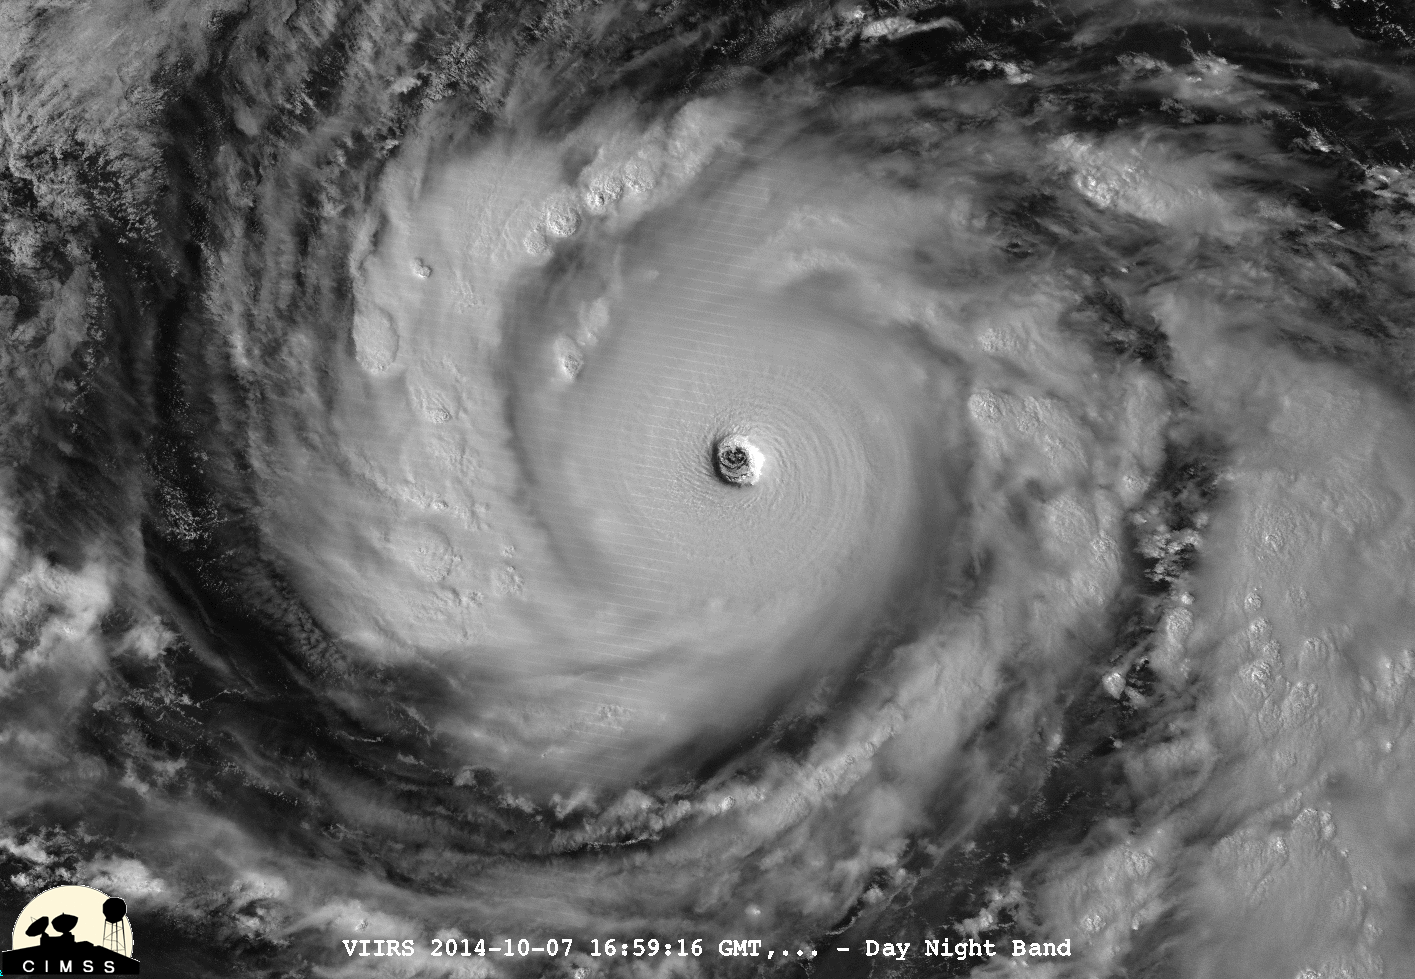
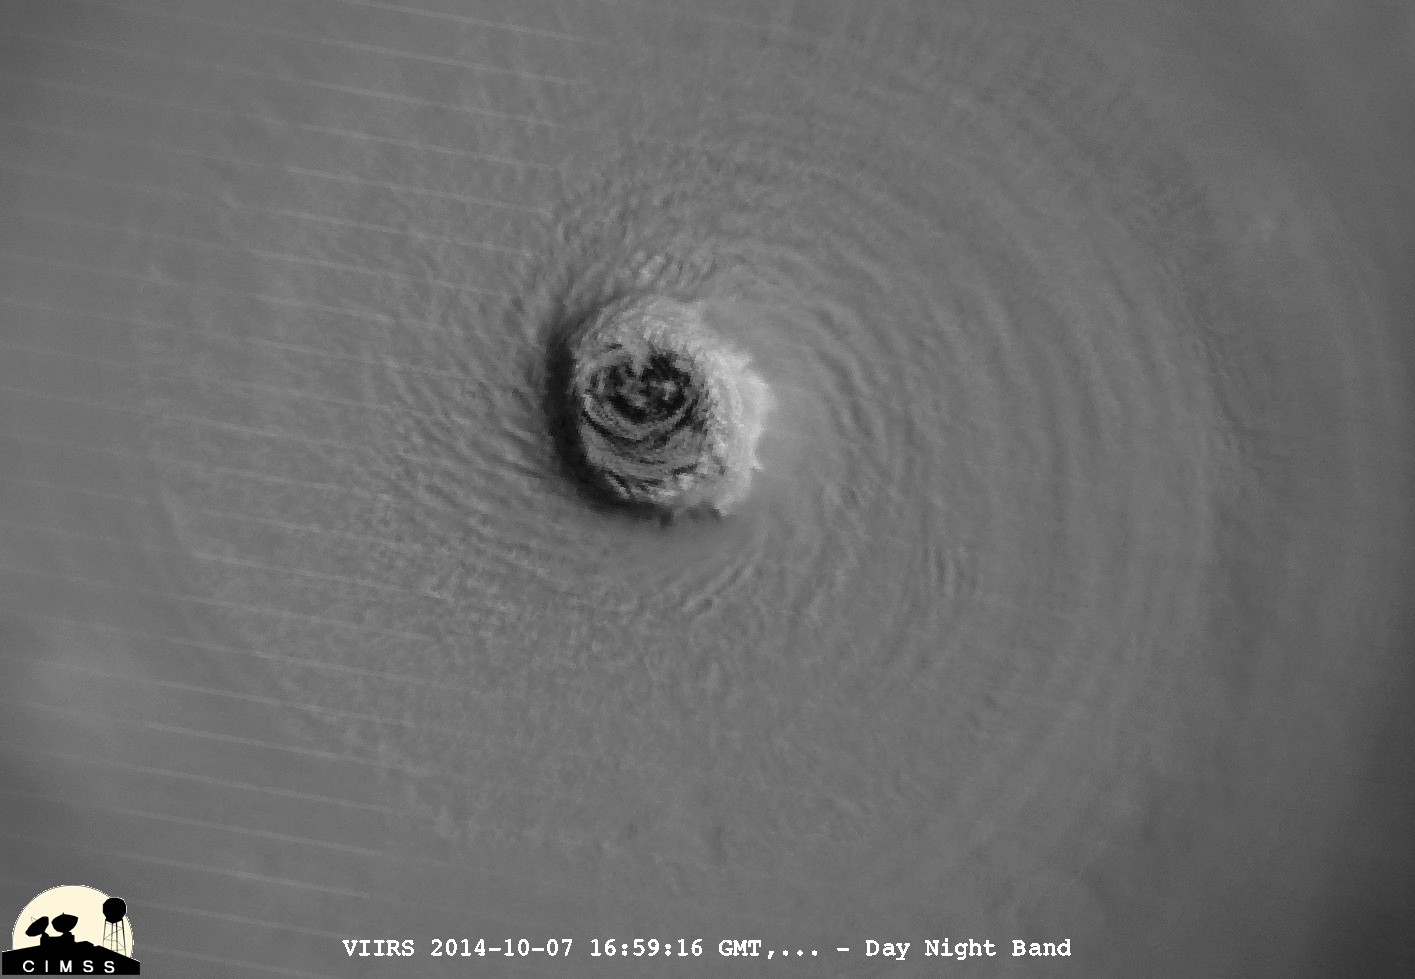
A large-scale view and a close-up view of the eye of Vongfong using Suomi NPP VIIRS 0.7 µm Day/Night Band and 11.45 µm IR channel images at 16:59 UTC or 1:59 am local time are shown below (courtesy of William Straka, SSEC). Due to an abundance of reflected light from a Full Moon, these examples demonstrate the “visible image at night” capability of the VIIRS Day/Night Band.
Suomi NPP VIIRS 0.7 µm Day/Night Band and 11.45 µm IR channel images
Suomi NPP VIIRS 0.7 µm Day/Night Band and 11.45 µm IR channel images
In a comparison of a MTSAT-2 10.8 µm IR image with the corresponding DMSP SSMIS 85 GHz microwave image around 22:47 UTC (below), there was evidence of the formation of a larger secondary eyewall surrounding the primary eyewall (which can signal the beginning of an eyewall replacement cycle). Using the microwave data, the diameter of the eye was determined to be 60.59 km.
MTSAT-2 10.8 um IR image and DMSP SSMIS 85 GHz microwave image
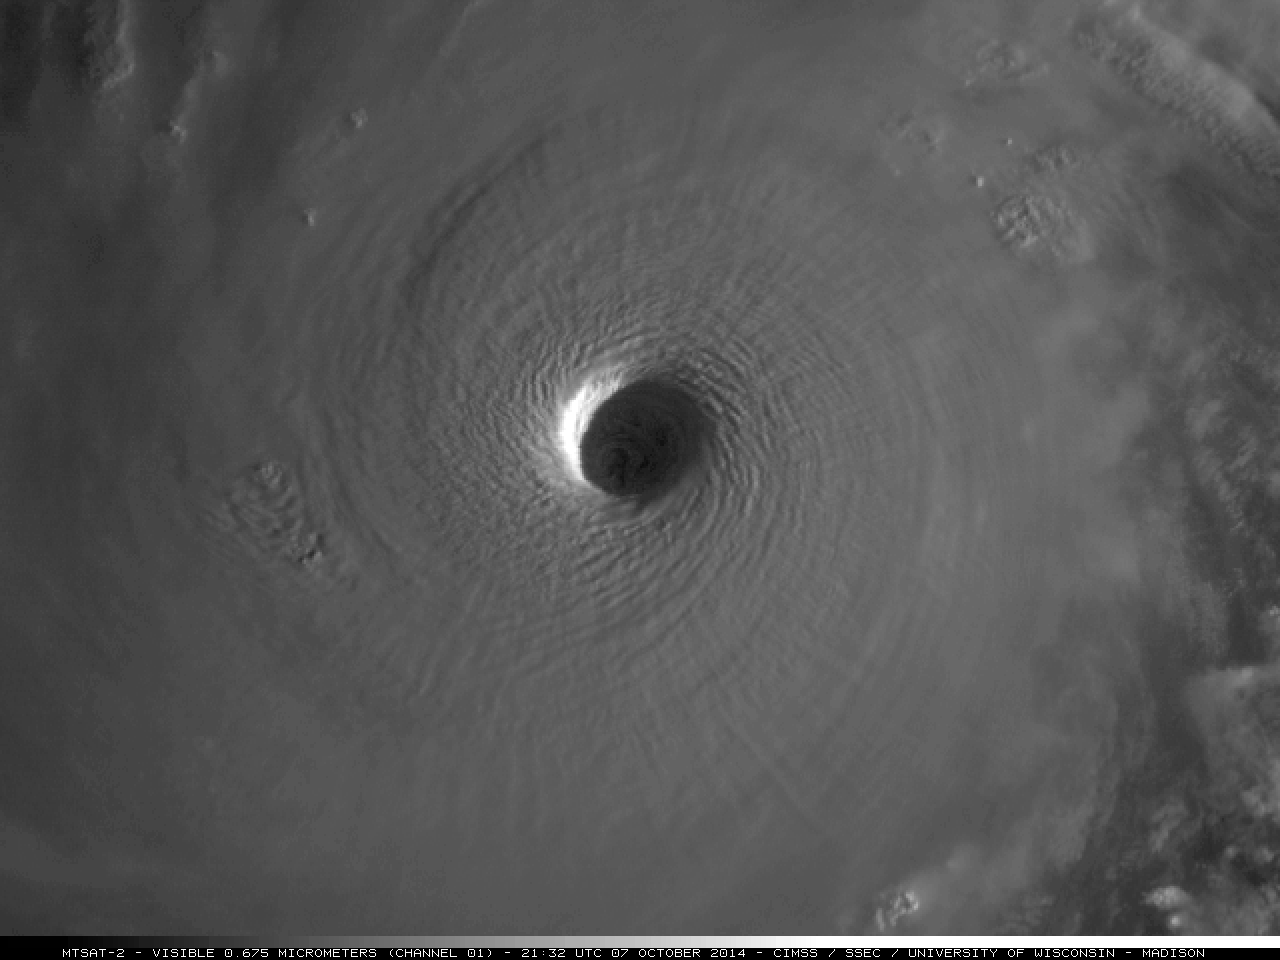
As the morning sun began to illuminate Super Typhoon Vongfong around 21:32 UTC, an MTSAT-2 0.675 µm visible channel image (below) provided a stunning view of the eye of the intense tropical cyclone. An animation of subsequent MTSAT-2 visible images revealed the presence of mesovortices within the eye.

MTSAT-2 0.675 µm visible channel image
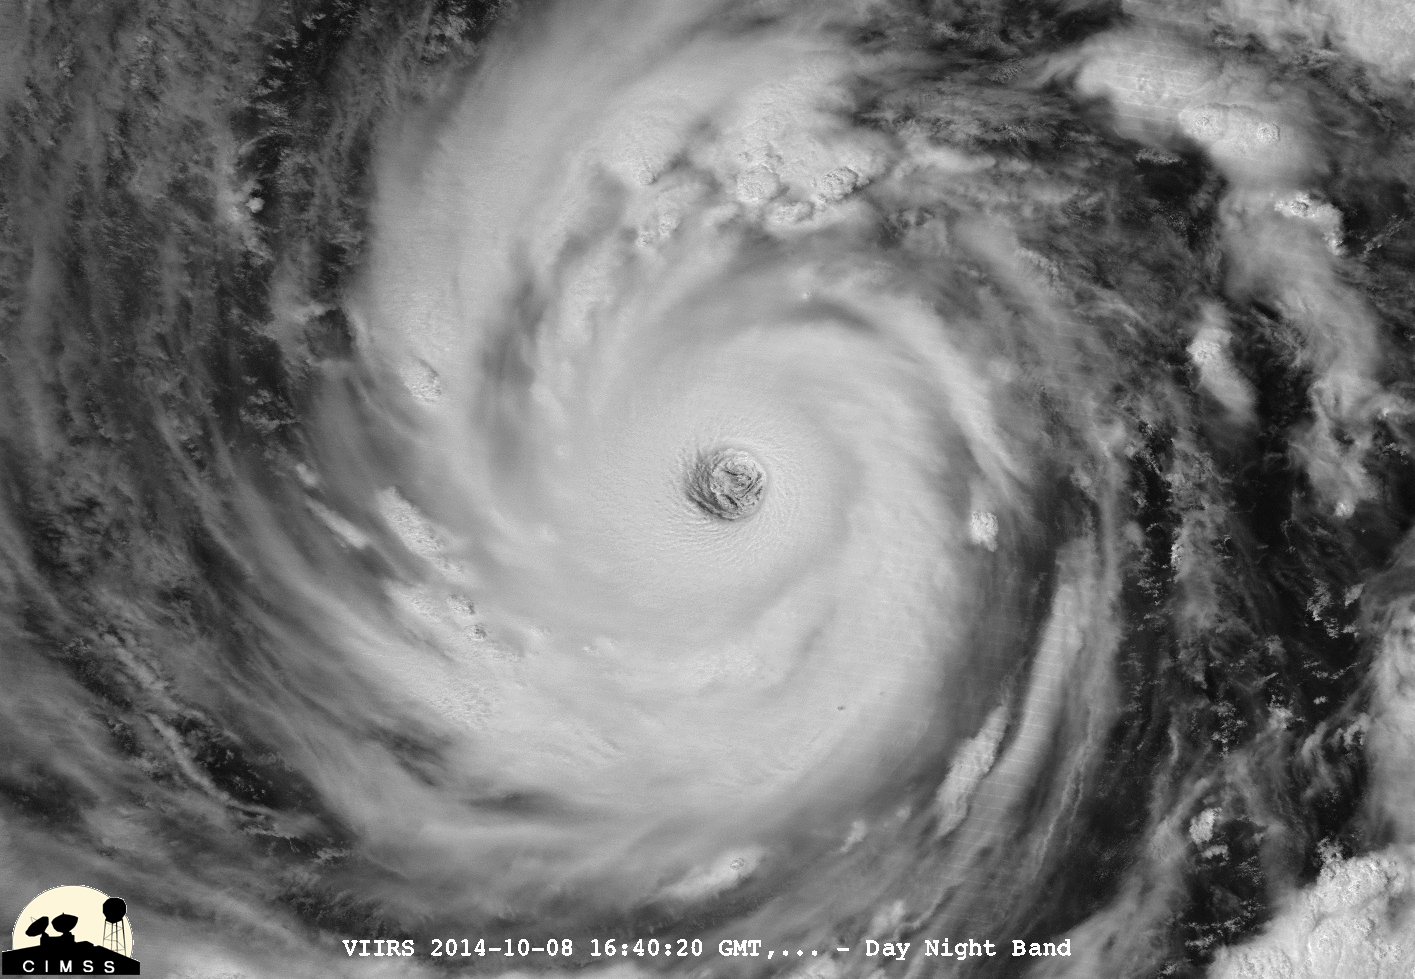
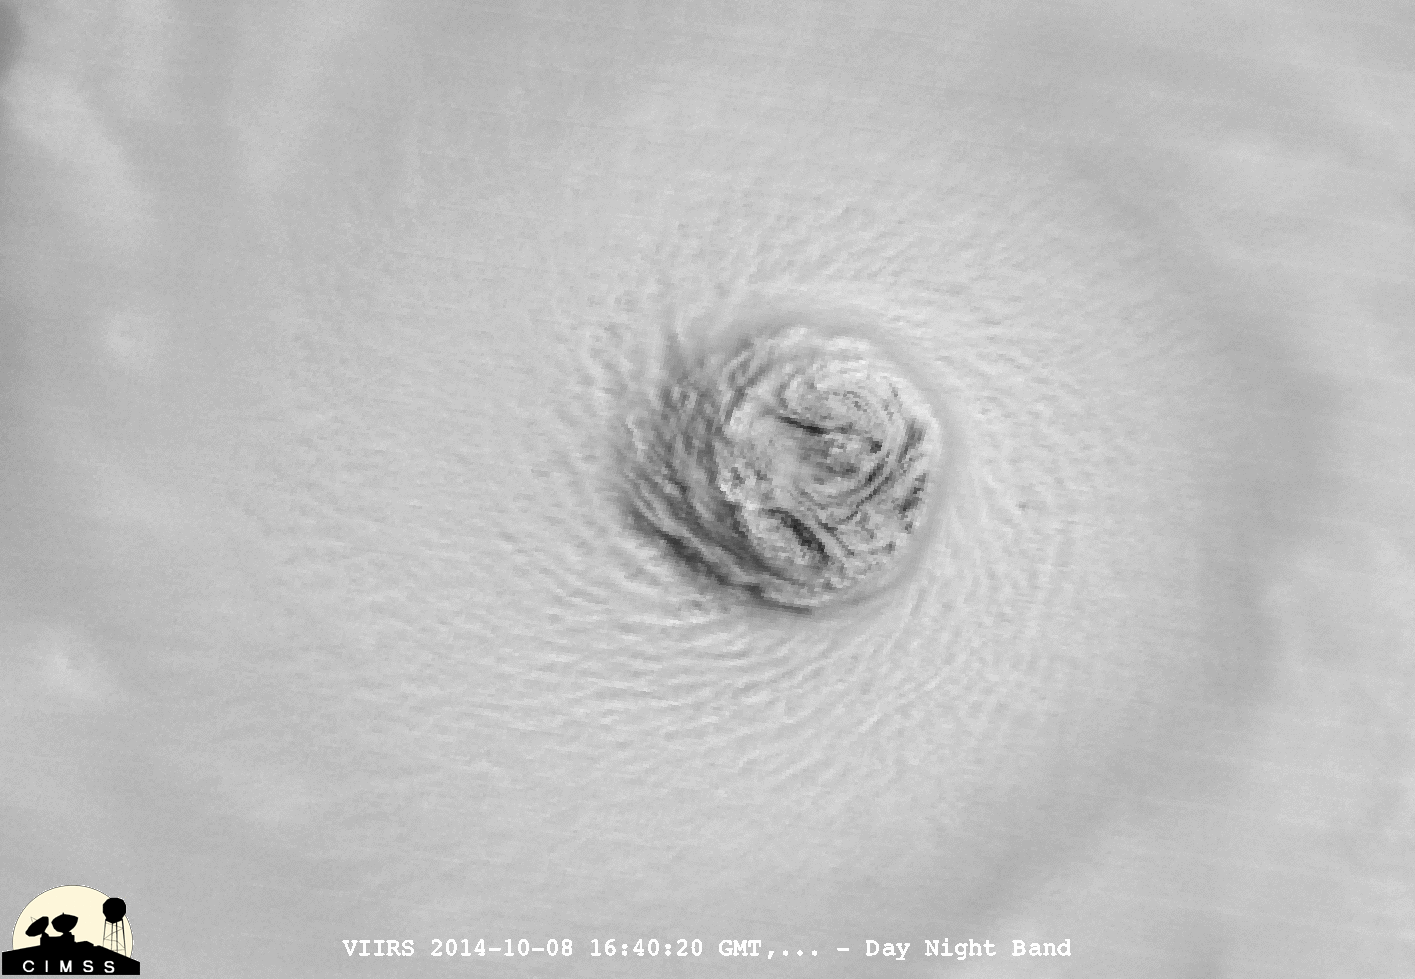
08 October Update: A large-scale view and a close-up view of the eye of Super Typhoon Vongfong using Suomi NPP VIIRS 0.7 µm Day/Night Band and 11.45 µm IR channel images at 16:40 UTC or 1:40 am local time on 08 October are shown below (courtesy of William Straka, SSEC).
Suomi NPP VIIRS 0.7 µm Daqy/Night Band and 11.45 µm IR channel images
Suomi NPP VIIRS 0.7 µm Day/Night Band and 11.45 µm IR channel images
11 October Update: A large-scale view and a close-up view of the eye of a weakened Vongfong (as it passed near the island of Okinawa) using Suomi NPP VIIRS 0.7 µm Day/Night Band and 11.45 µm IR channel images at 17:18 UTC on 11 October are shown below (courtesy of William Straka, SSEC).
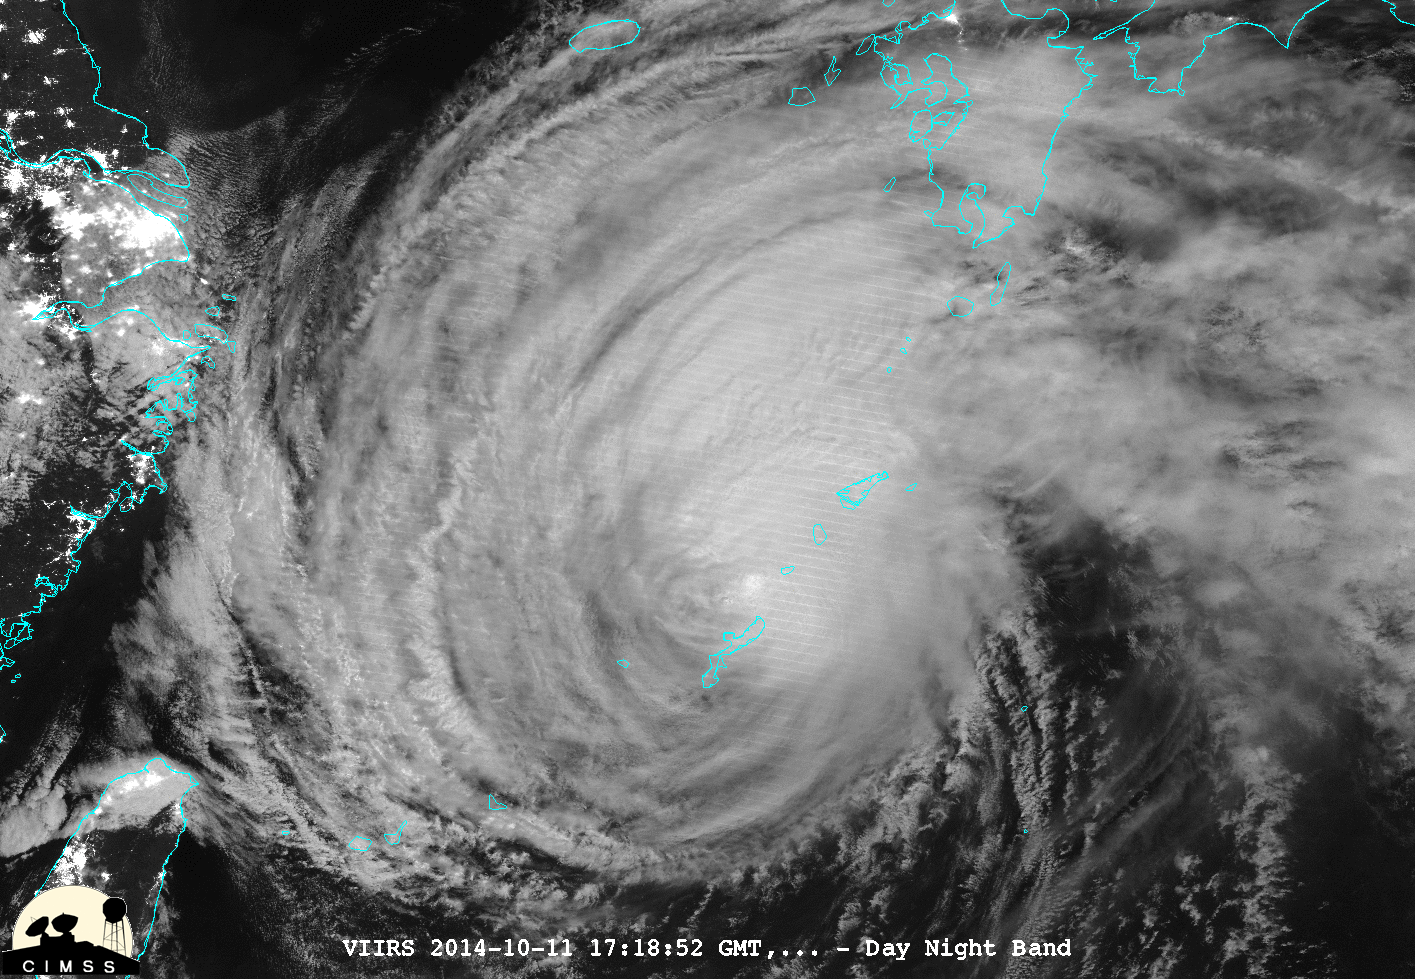
Suomi NPP VIIRS 0.7 µm Daqy/Night Band and 11.45 µm IR channel images
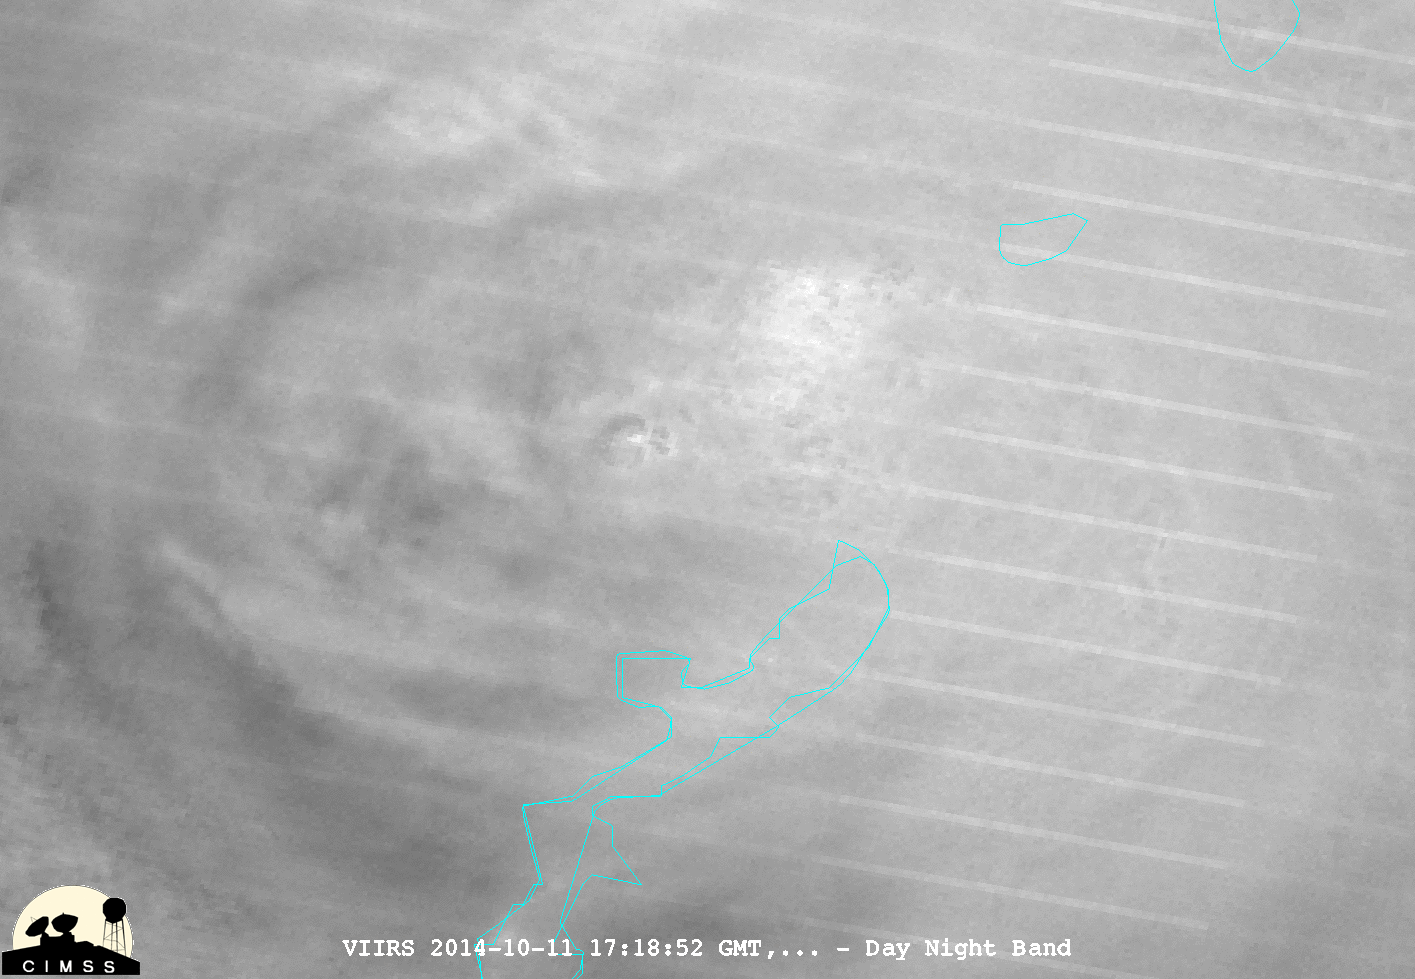
Suomi NPP VIIRS 0.7 µm Day/Night Band and 11.45 µm IR channel images
Additional satellite images of Super Typhoon Vongfong can be found on the Satellite Liaison Blog.
View only this post Read Less


