
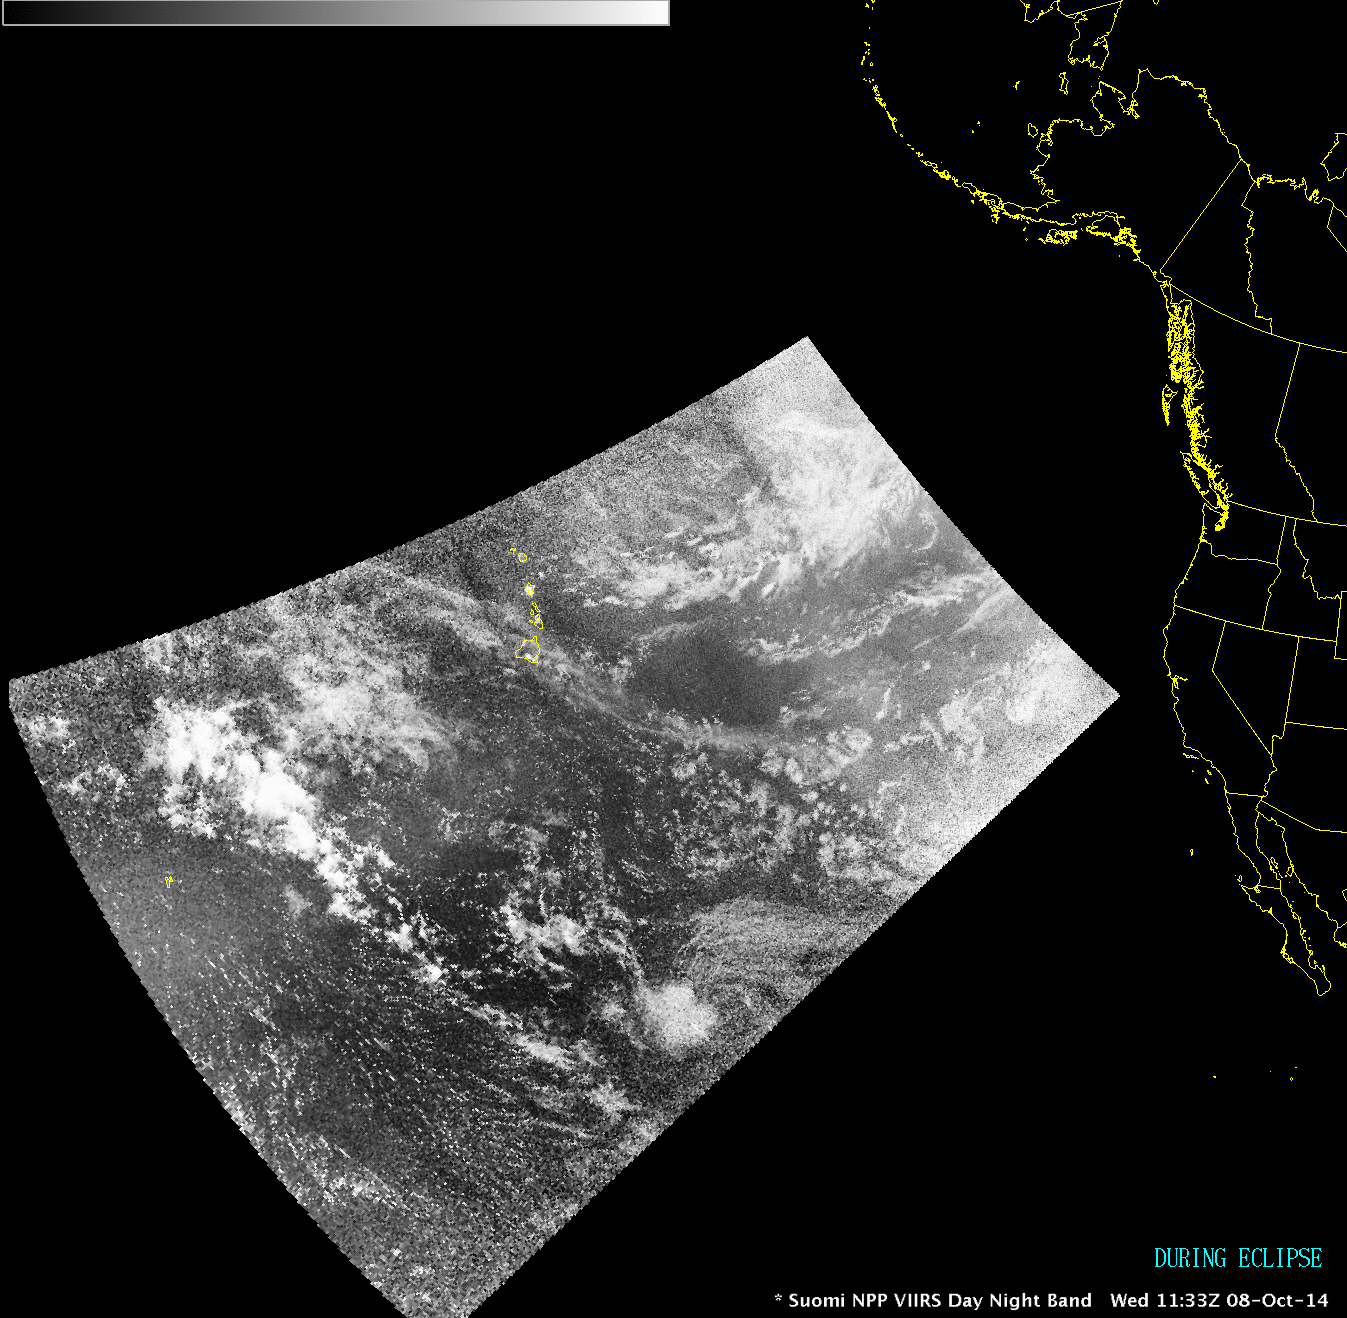
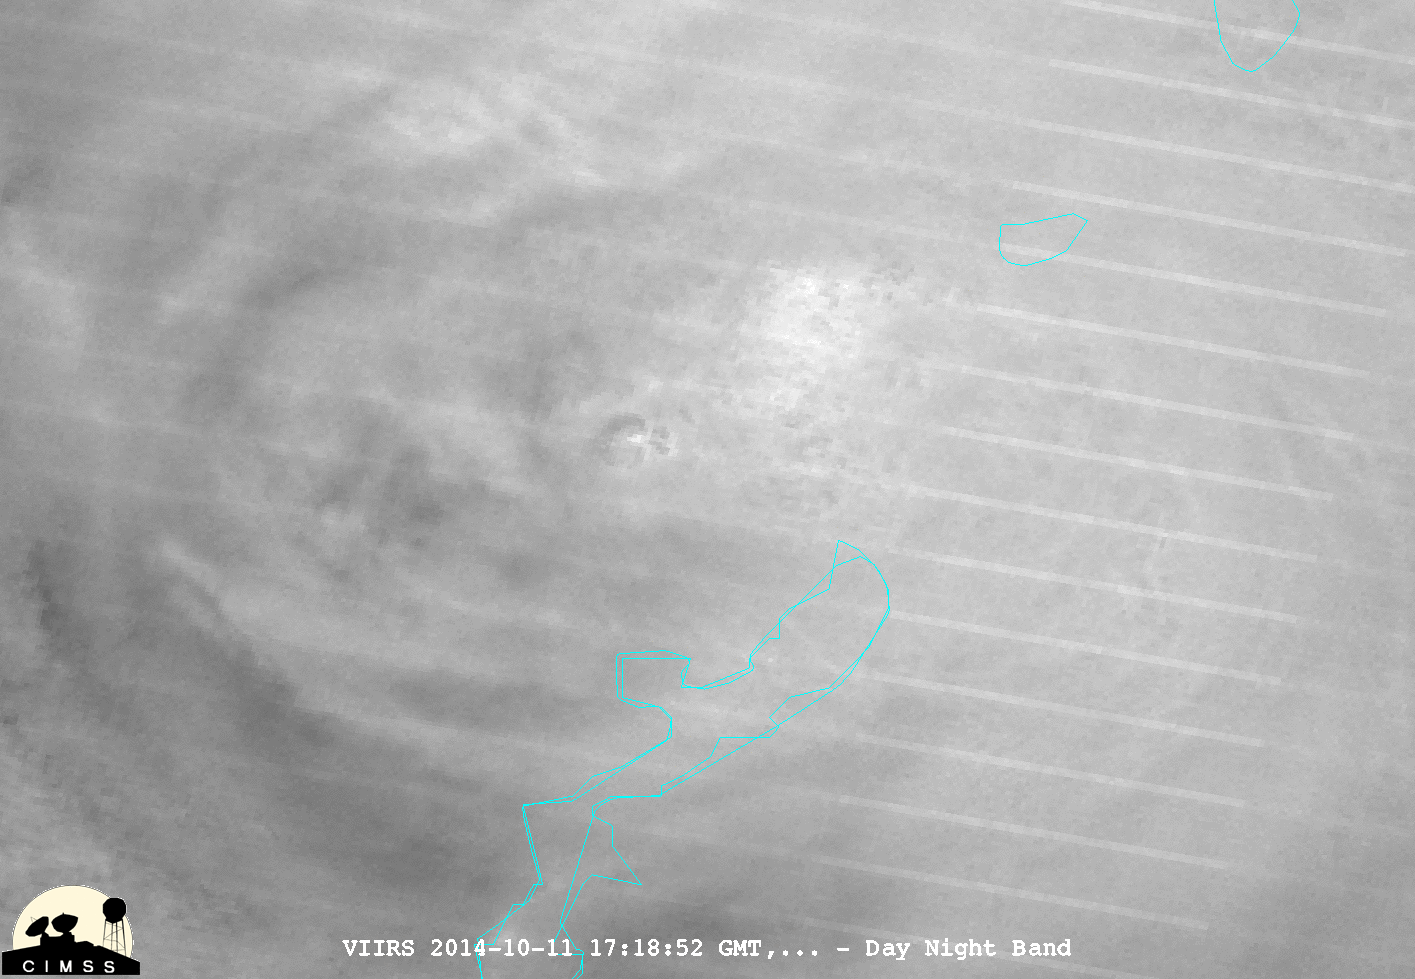
A “Blood Moon” total lunar eclipse occurred between 09:15 UTC and 12:34 UTC on 08 October 2014. One effect of this eclipse can be seen in a comparison of nighttime “during eclipse” and “after eclipse” Suomi NPP VIIRS 0.7 µm Day/Night Band images (above). The 11:33 UTC “during eclipse” Day/Night Band image appears somewhat dim and washed out, due to limited illumination by only red sunlight being refracted by the Earth’s atmosphere into the eclipse shadow. Less than 2 hours later, the 13:14 UTC Day/Night Band image appears much more bright with crisp cloud feature details, due to an abundance of illumination from the Full Moon.
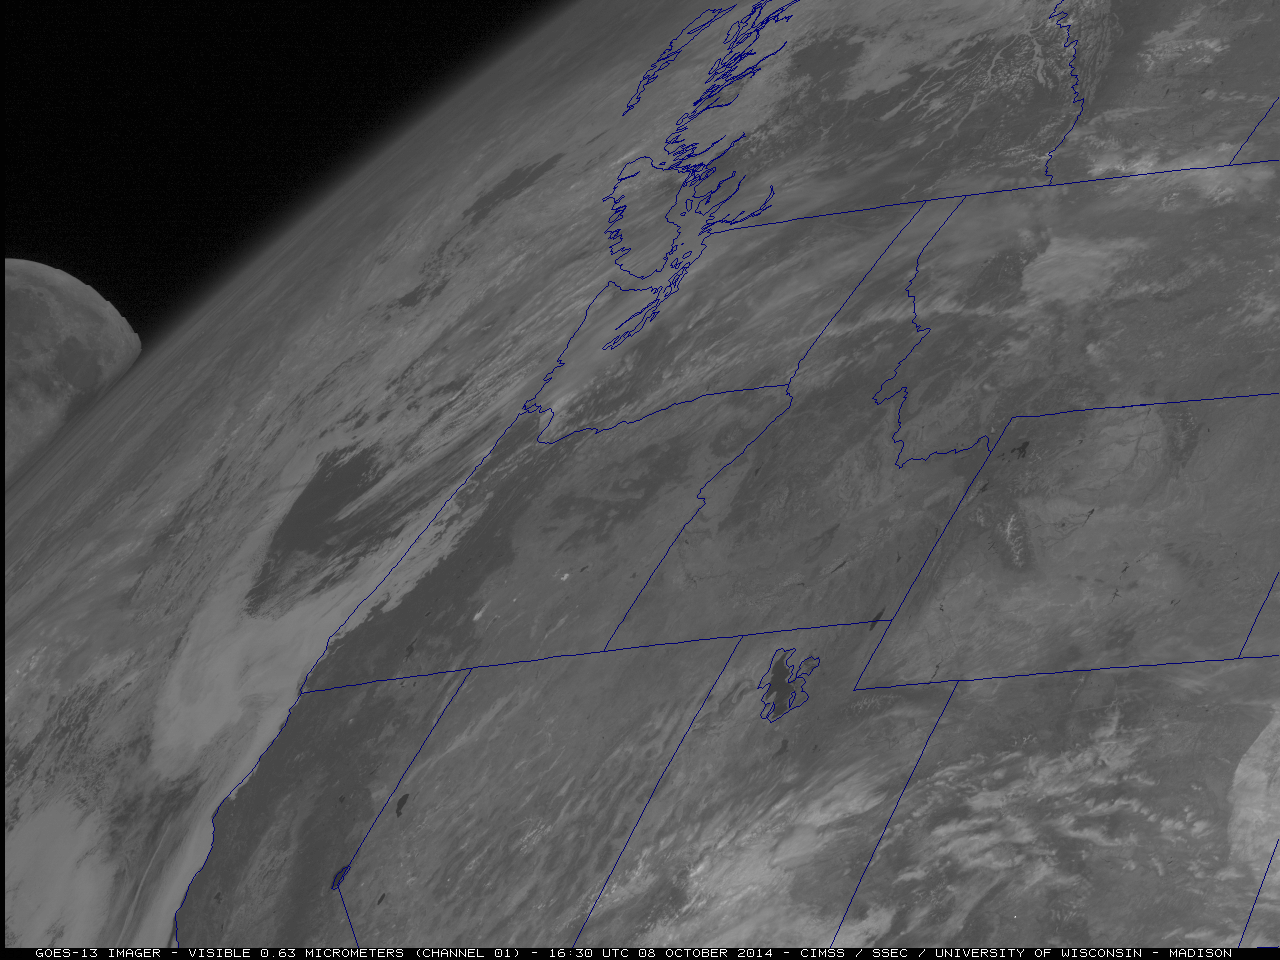
A few hours after sunrise in North America, a portion of the Moon was captured on the GOES-13 (GOES-East) 0.63 µm visible channel image at 16:30 UTC (below). Note how the edges of the Moon appear slightly jagged, caused by the fact that it was moving (setting) behind the Earth as the GOES-13 imager instrument was scanning horizontally step-wise from north to south. In addition, at the point where the edge of the Moon meets the edge of the Earth, there is a “lensing effect” where the Earth’s atmosphere is refracting light from the Moon and creating the illusion of a curved wedge of dark space that is visible within the atmosphere.
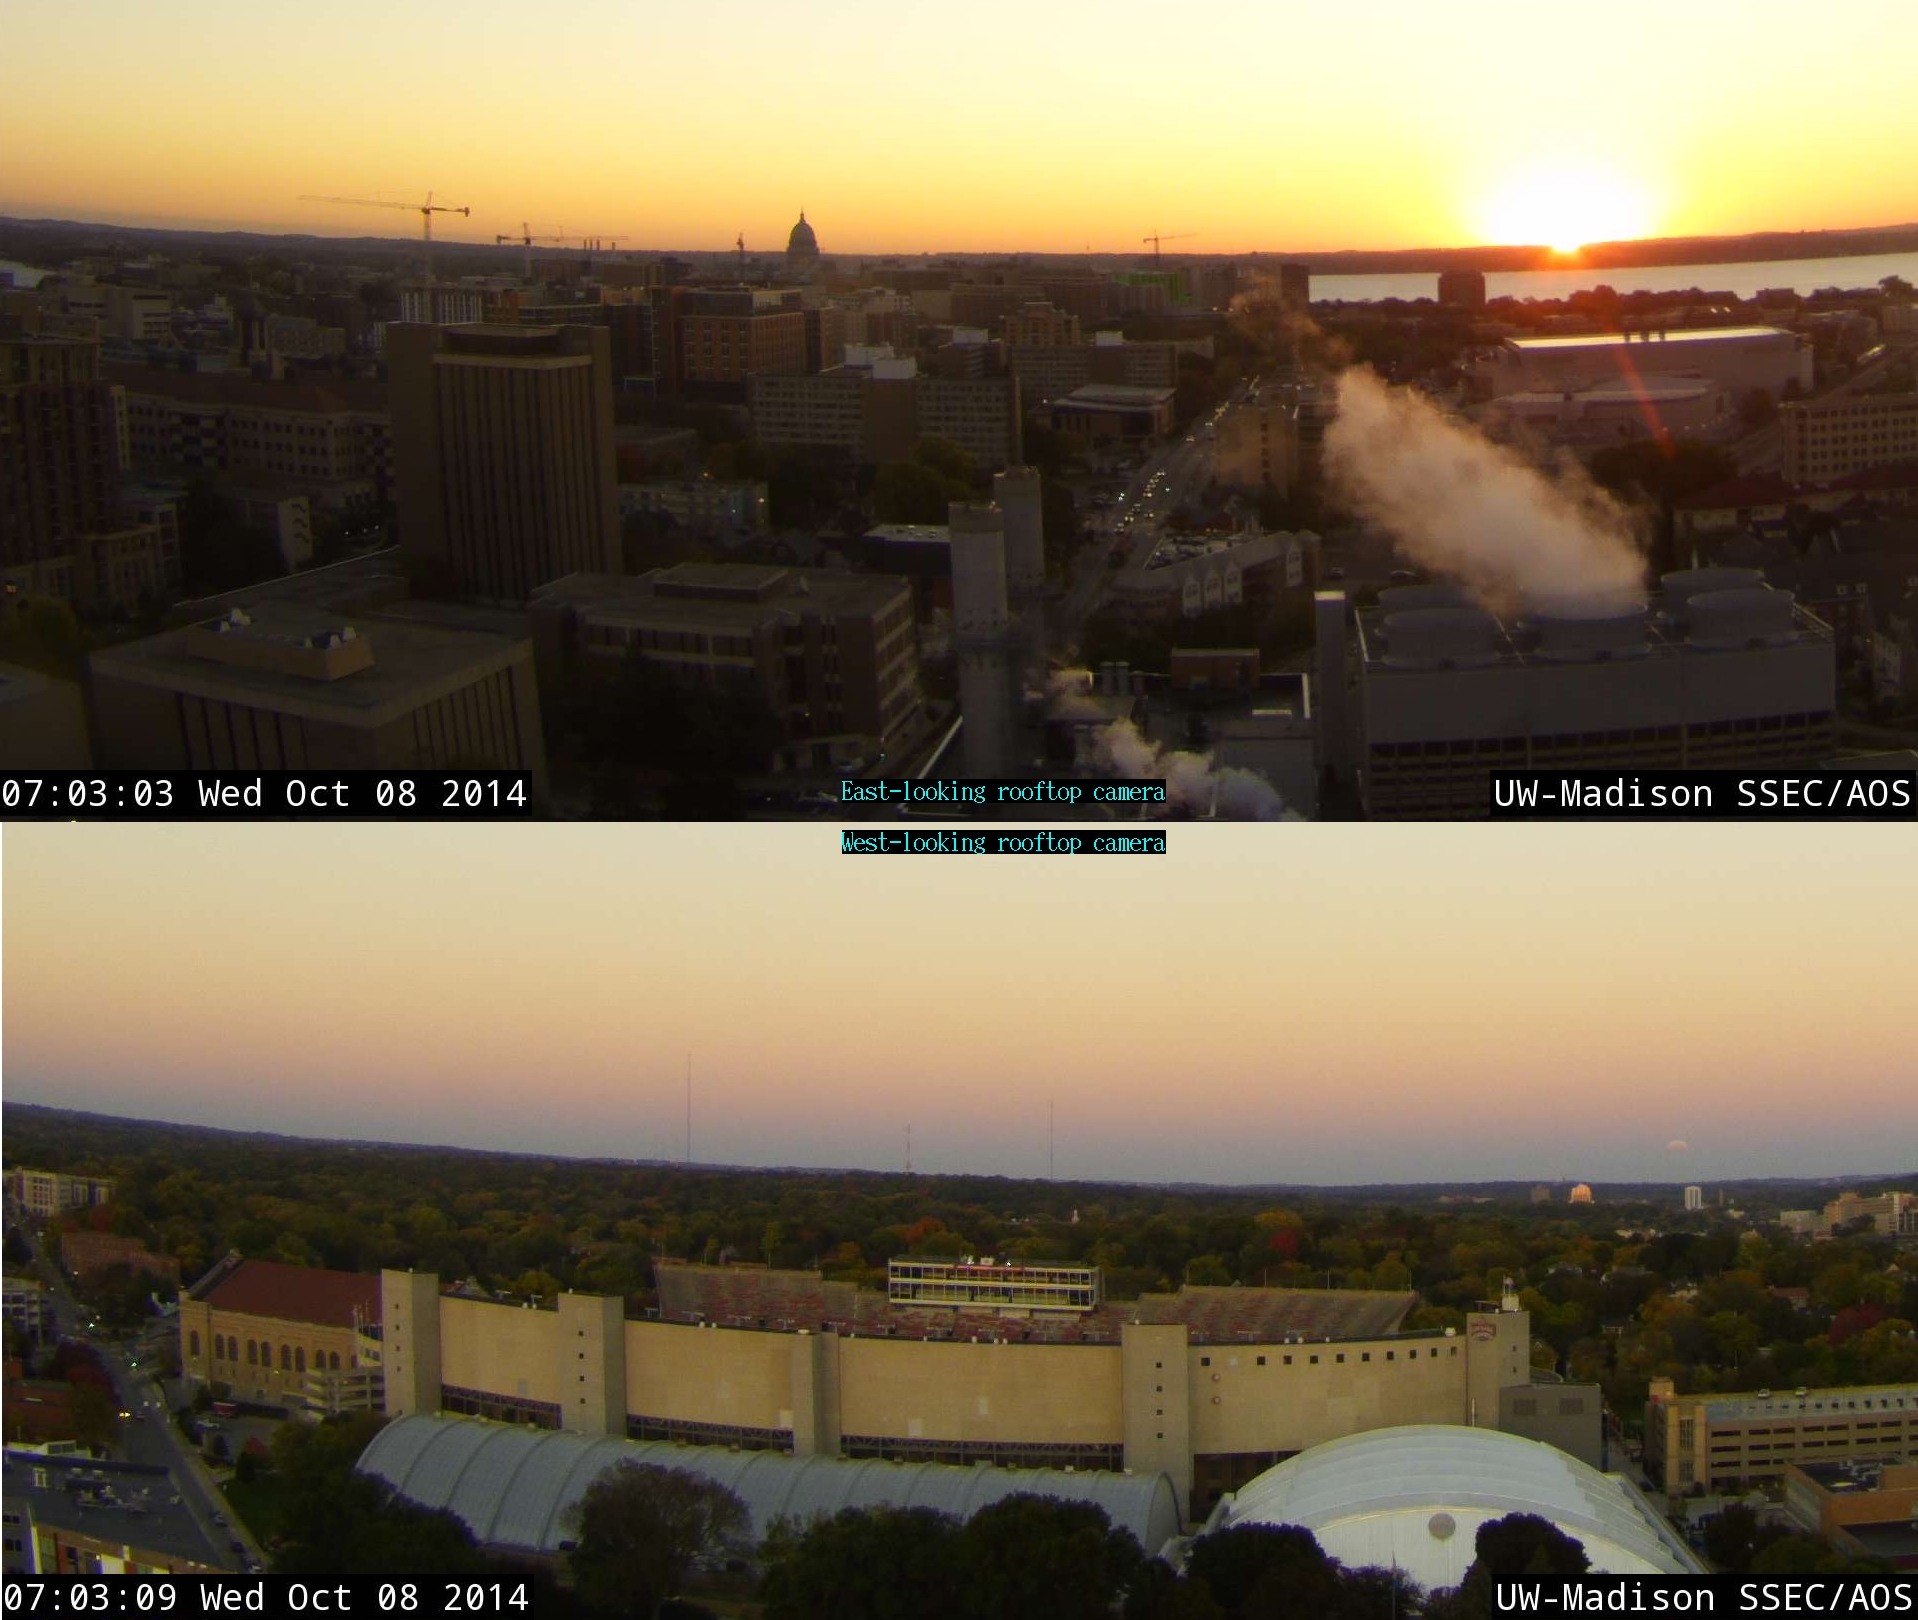
Speaking of sunrise, an interesting aspect of this lunar eclipse was that it was a rare “selenelion”, when the rising sun in the east could be seen at the same time as the non-eclipsed portion of the setting moon in the west (Space.com article). This selenelion was captured at 12:03 UTC or 7:03 am local time by the east-looking and west-looking rooftop cameras on the Space Science and Engineering Center building (below; image captures courtesy of John Lalande, SSEC).
View only this post Read Less


