
GOES-13 6.5 µm water vapor channel images (click to play animation)
GOES-13 6.5 µm water vapor channel images (above; click to play animation) showed dry air (brighter yellow to orange color enhancement) moving across the Mid-Atlantic and Southeast regions of the eastern US in the wake of a strong cold frontal passage on the morning of 30 January 2015. There were also numerous pilot reports of turbulence, at both low altitudes (plotted in red) and high altitudes (plotted in cyan).
The most obvious feature seen on the GOES-13 water vapor images was the “rippled” signature of mountain waves, which extended far to the lee (southeast) of the Appalachian Mountains (the topographical obstacle to the strong northwesterly boundary layer flow that was causing the waves to initially form). A comparison of 4-km resolution GOES-13 6.5 µm water vapor and 1-km resolution Aqua MODIS 6.7 µm water vapor images (below) demonstrated the benefit of higher spatial resolution for diagnosing the areal coverage of such small-scale mountain waves. Of special note is the pilot report of “severe to extreme” turbulence at 4000 feet over South Carolina.

MODIS 6.7 µm and GOES-13 6.5 µm water vapor channel images, with pilot reports
A comparison of the MODIS 6.7 µm water vapor channel image with the corresponding MODIS 0.65 µm visible channel image (below) showed that the severe to extreme reports in North and South Carolina were examples of Clear Air Turbulence (CAT), since no clouds were apparent in those areas at the time.
Aqua MODIS 0.65 µm visible channel and 6.7 µm water vapor channel images
Regarding the numerous high-altitude pilot reports of moderate to severe turbulence, the NAM80 model depicted a 120-knot jet streak over South Carolina at 12:00 UTC, with another 120-knot jet streak approaching from the middle Mississippi Valley region (below). Note that there was strong wind speed shear to the north of the jet stream axis, which is where the bulk of the pilot reports of turbulence were located. Quite often there is an obvious moist-to dry gradient water vapor signature along or just poleward of a strong jet streak axis — but such a signature was not seen with this particular event.
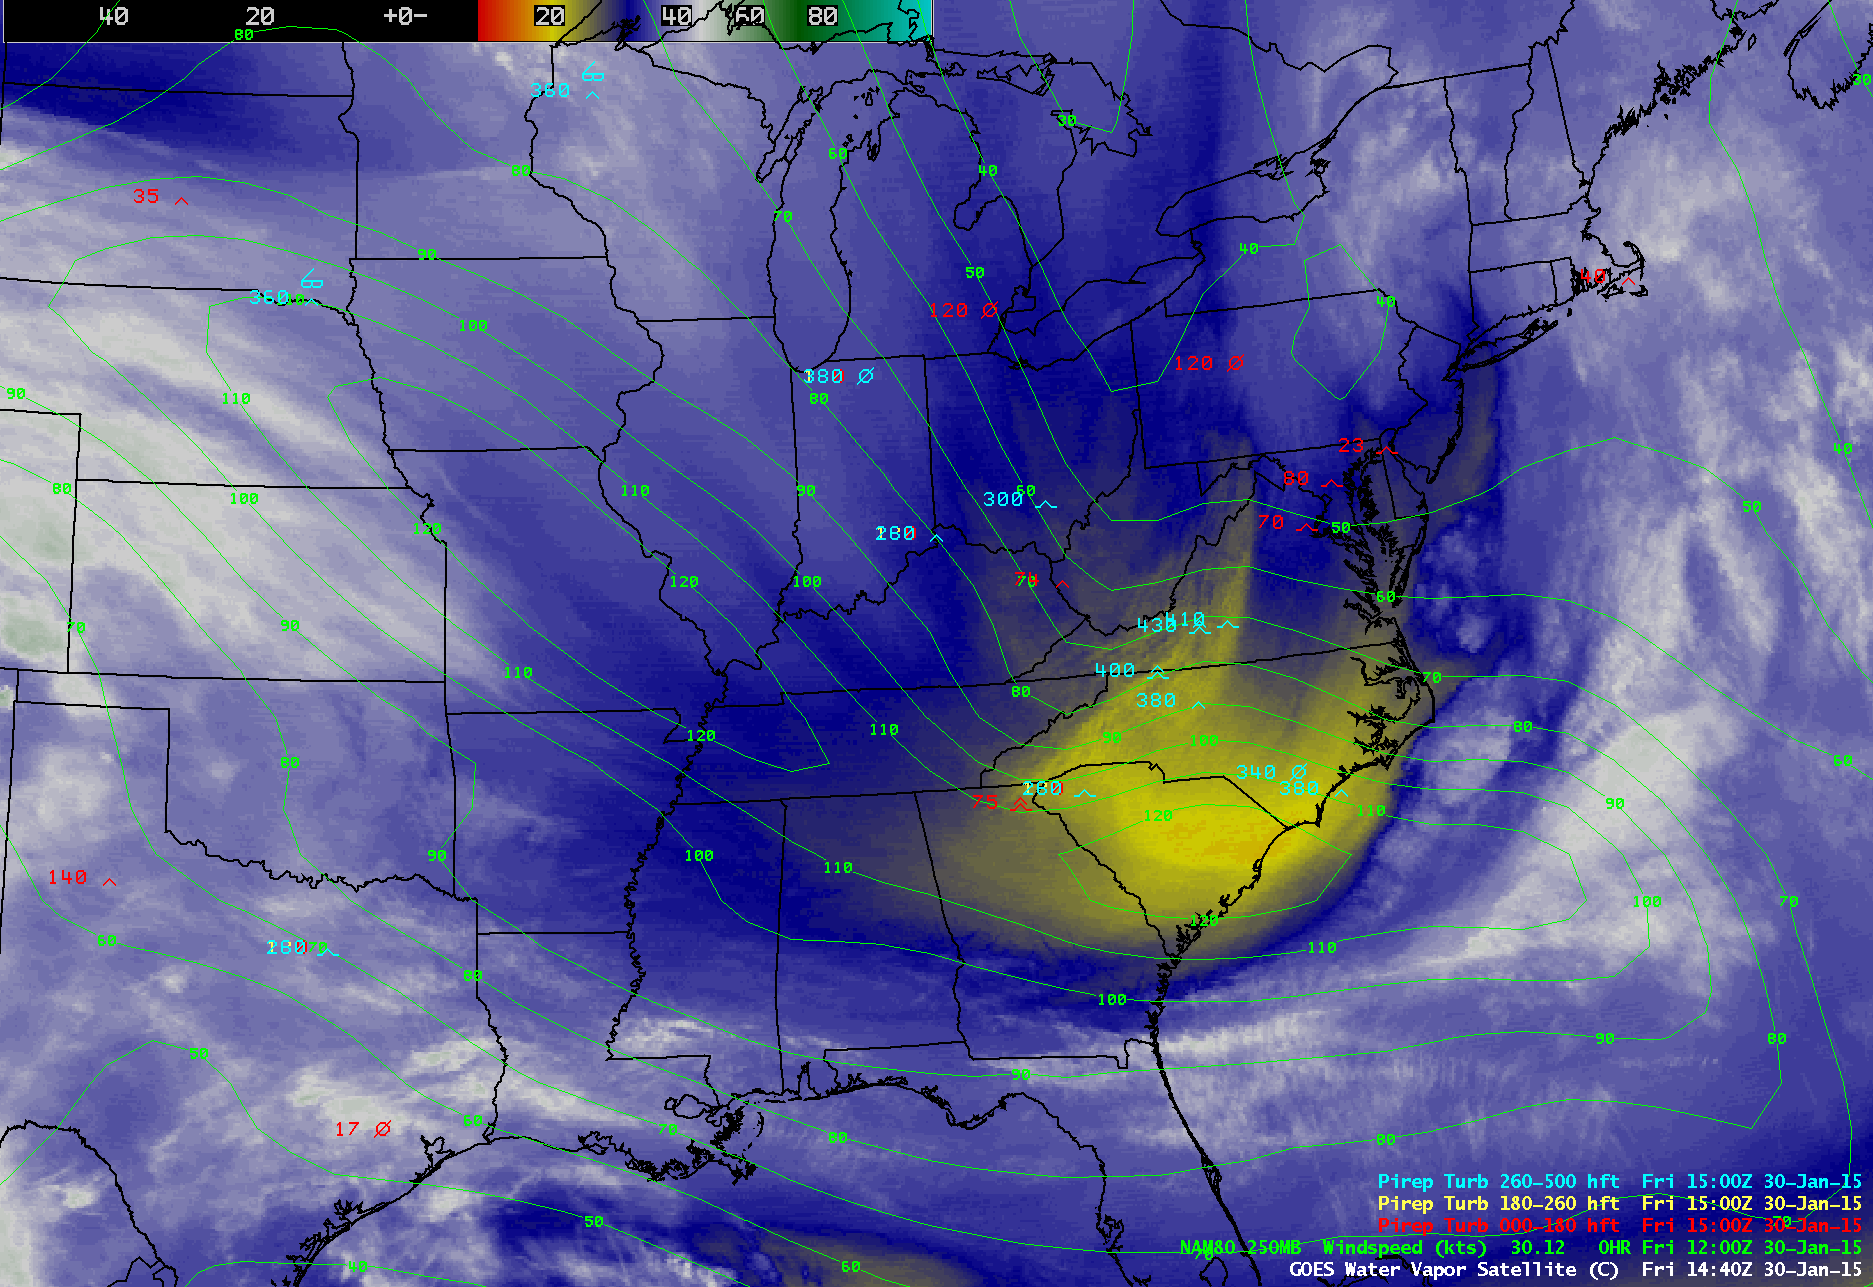
GOES-13 water vapor image with NAM80 250 hPa wind isotachs and pilot reports
In response to some of these pilot reports, at 16 UTC a SIGMET (SIGnificant METeorological advisory) was issued for occasional severe turbulence due to jet stream wind shear (below).
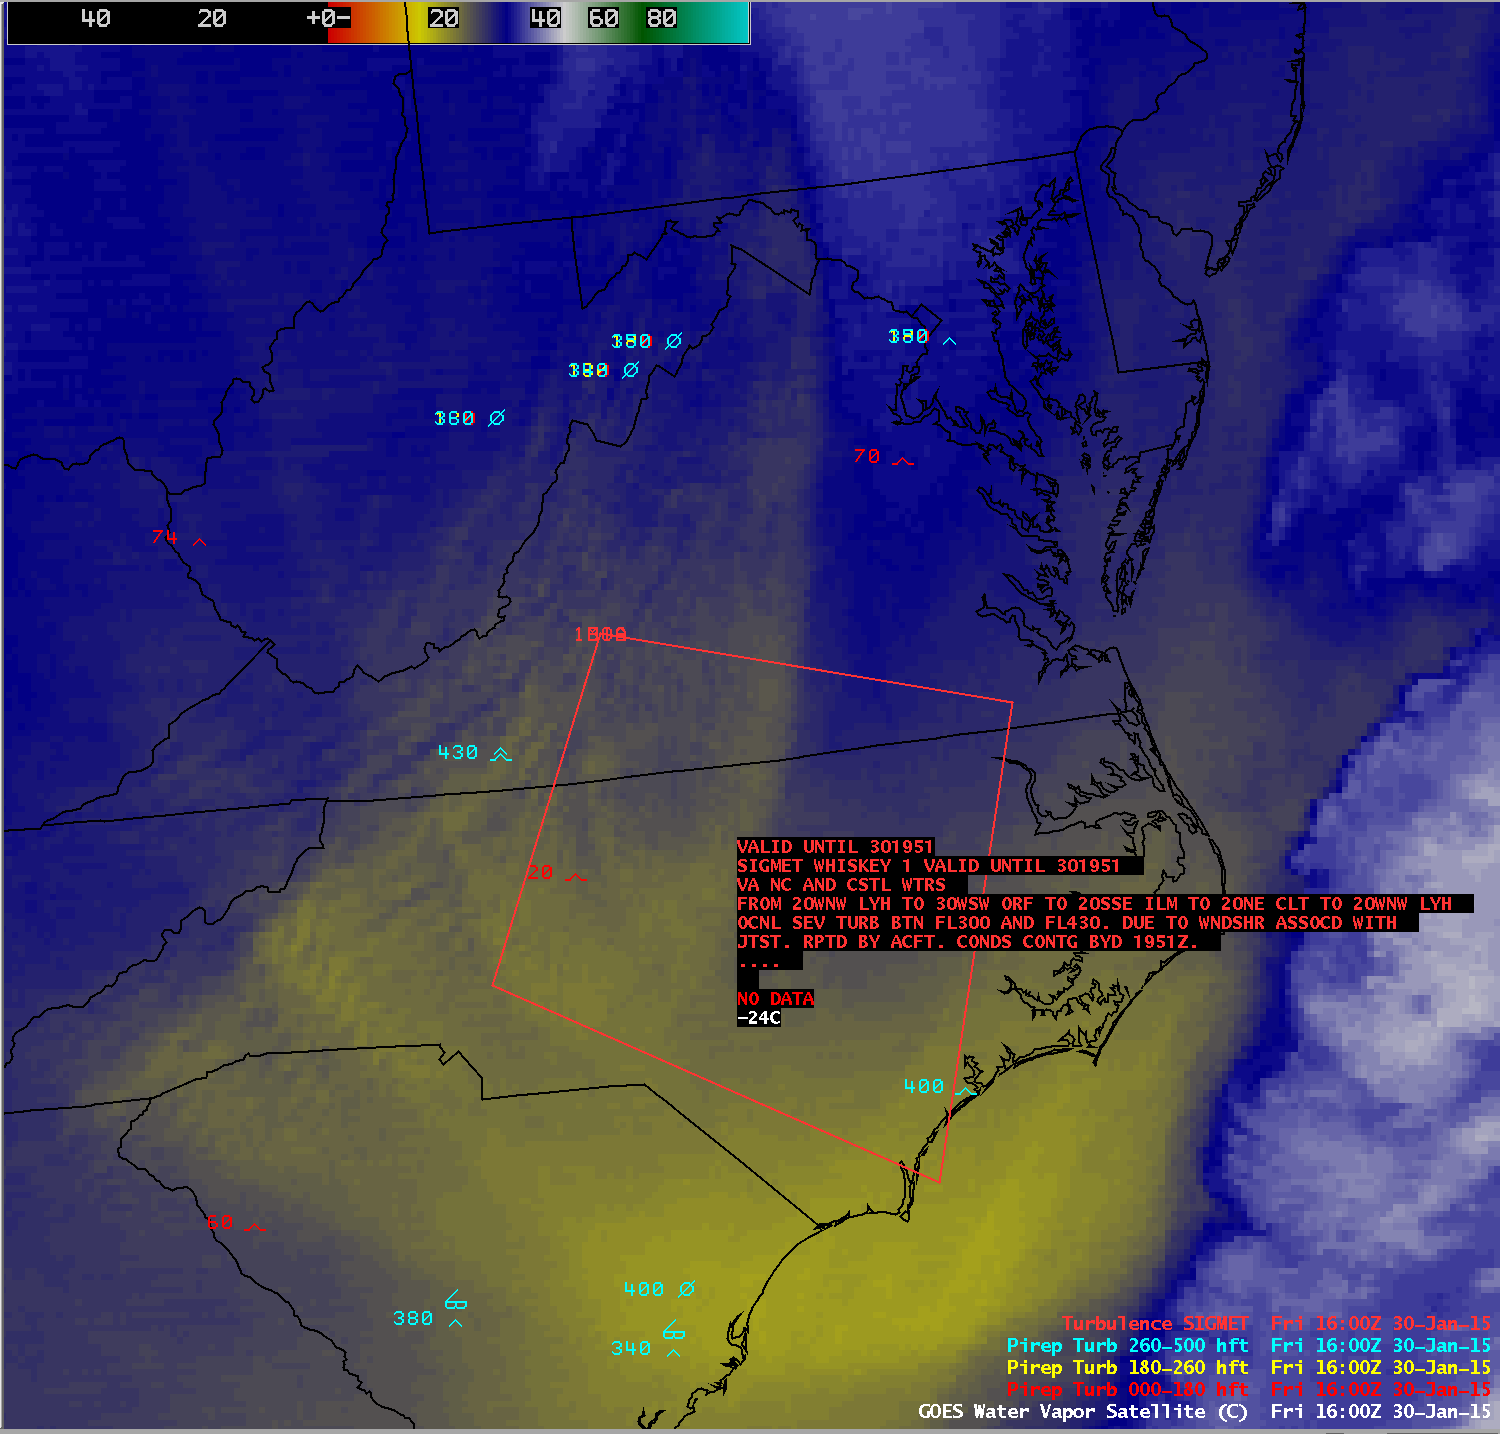
GOES-13 water vapor image with pilot reports and boundaries of turbulence SIGMET
4-panel images showing the three GOES-13 Sounder water vapor channels (6.5 µm, 7.0 µm, and 7.4 µm) along with the conventional GOES-13 Imager 6.5 µm water vapor channel (below; click to play animation) showed how each channel helped to identify where the pockets of middle-tropospheric dry air were located.
4-panel images showing the three GOES-13 Sounder and the GOES-13 imager water vapor channels (click to play animation)
The GOES-13 water vapor channel weighting functions plotted using data from the 12 UTC rawinsonde reports from Roanoke/Blacksburg, Virginia and Greensboro, North Carolina are shown below. Due to the very dry middle to upper troposphere, the water vapor channels were able to sense features farther down into the atmosphere than is usually the case — this is illustrated by the relatively low altitude of the water vapor weighting function peaks.
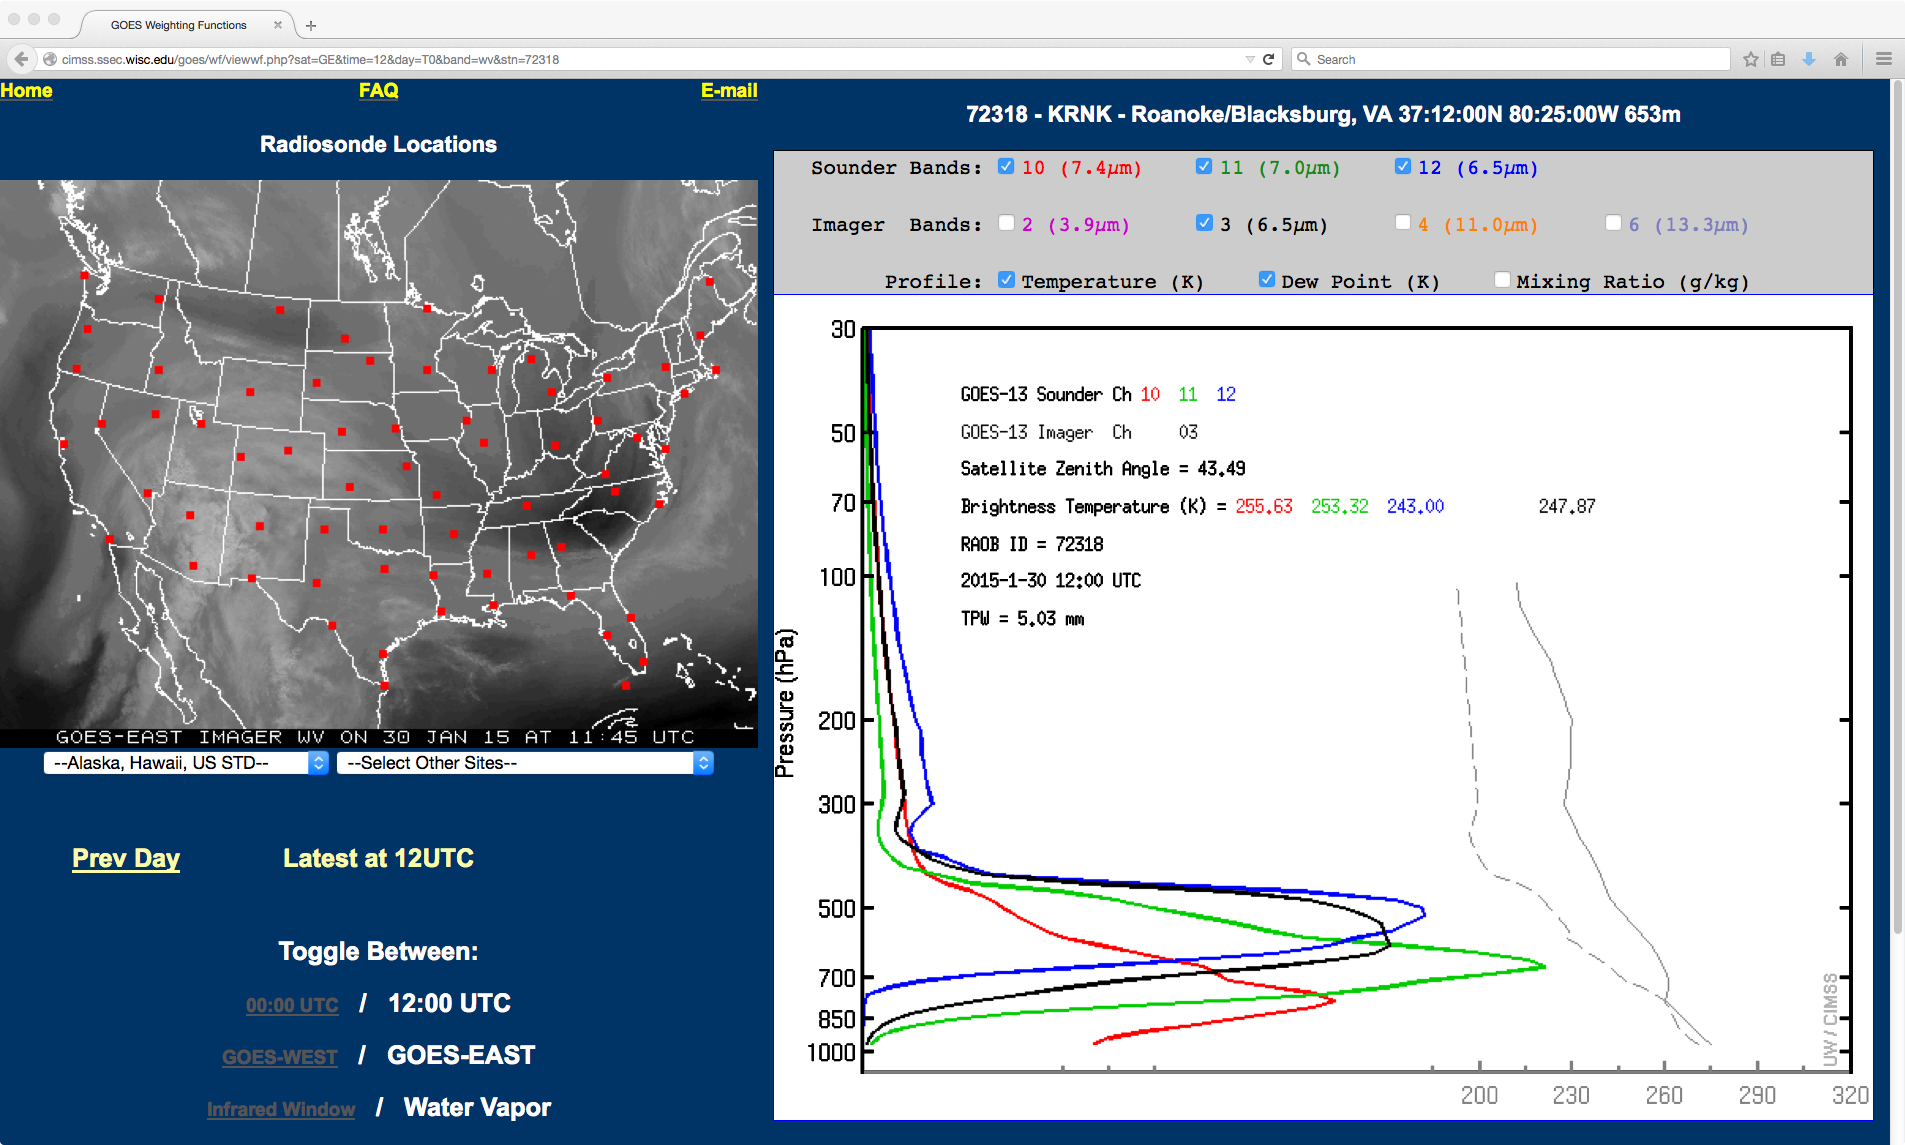
Roanoke/Blacksburg, Virginia water vapor channel weighting function plots
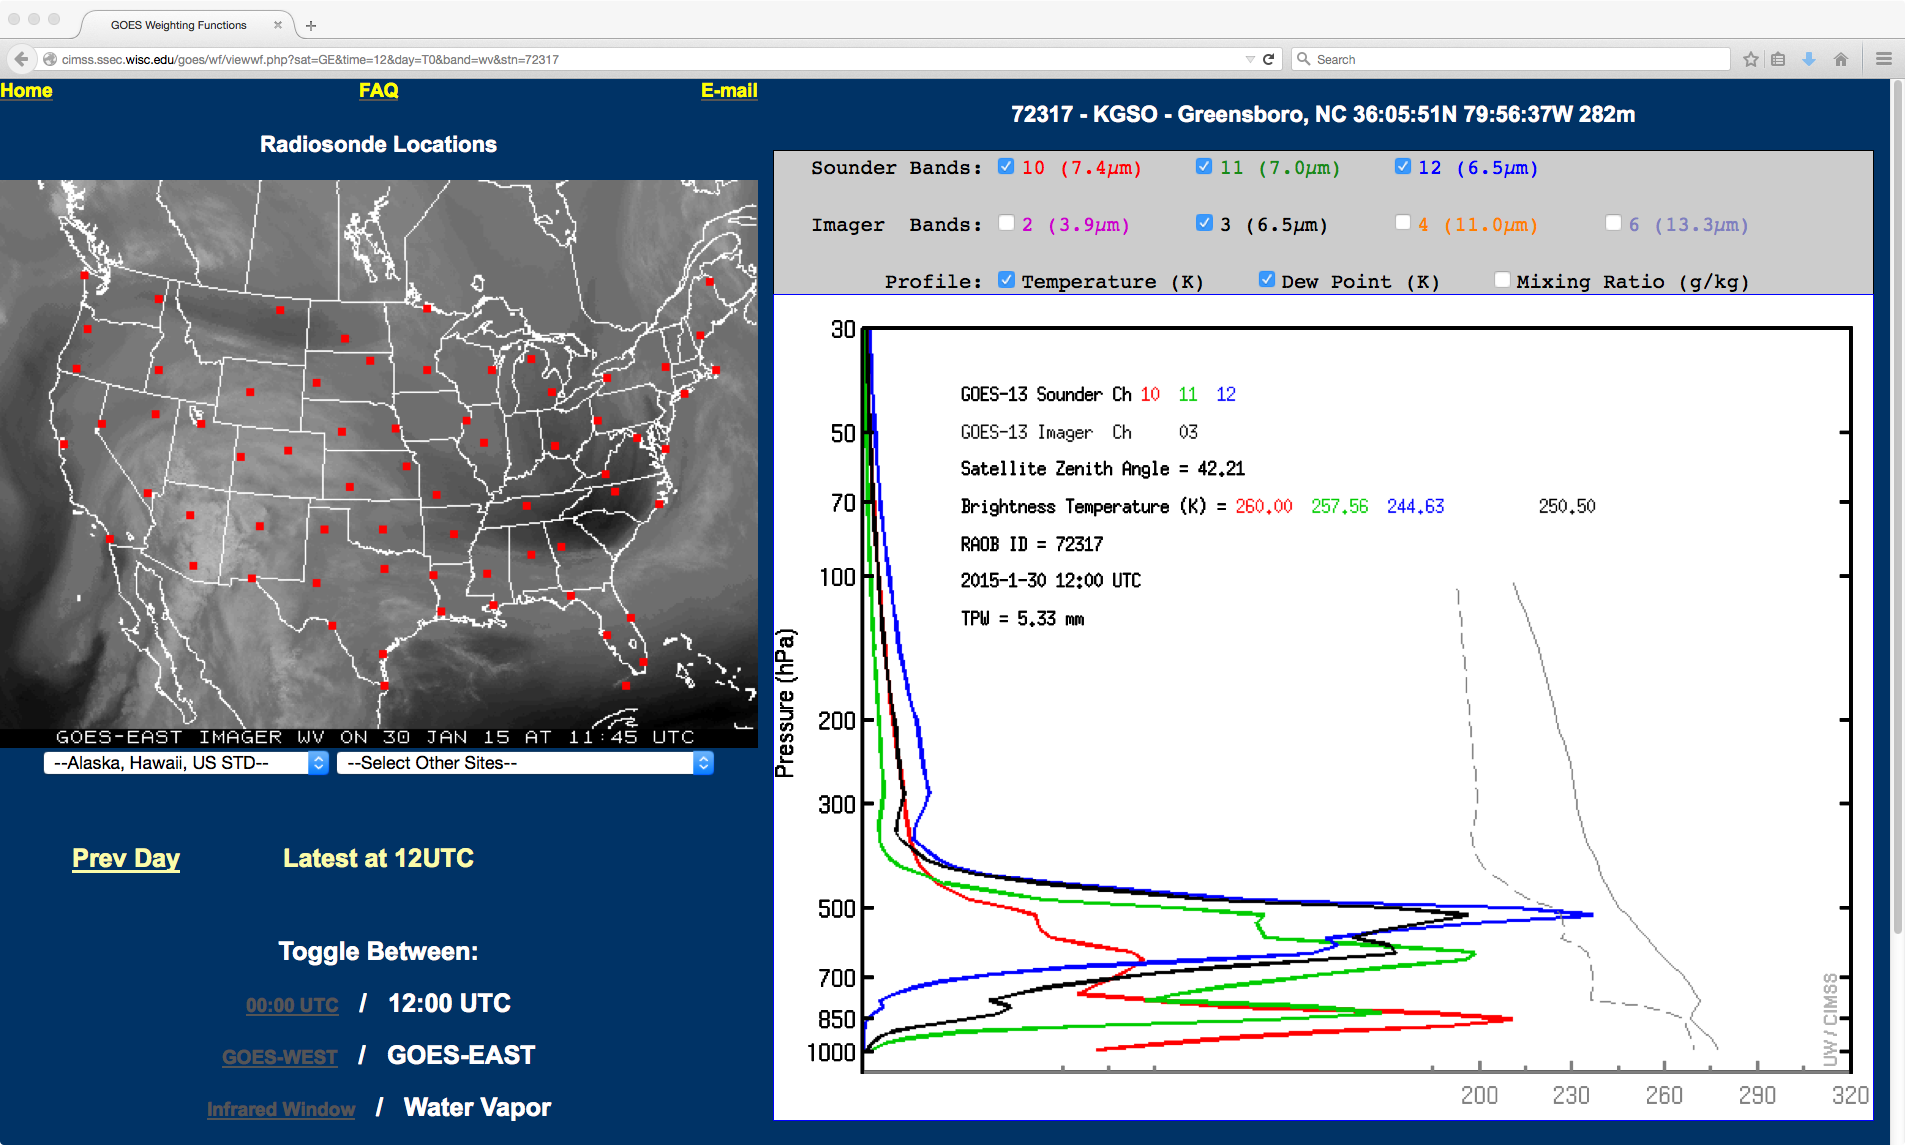
Greensboro, North Carolina water vapor channel weighting functions
Compare the 2 examples above with the altitude peaks of the various GOES-13 Sounder and Imager water vapor channels under “normal” conditions, plotted using the US Standard Atmosphere as the sounding profile (below).
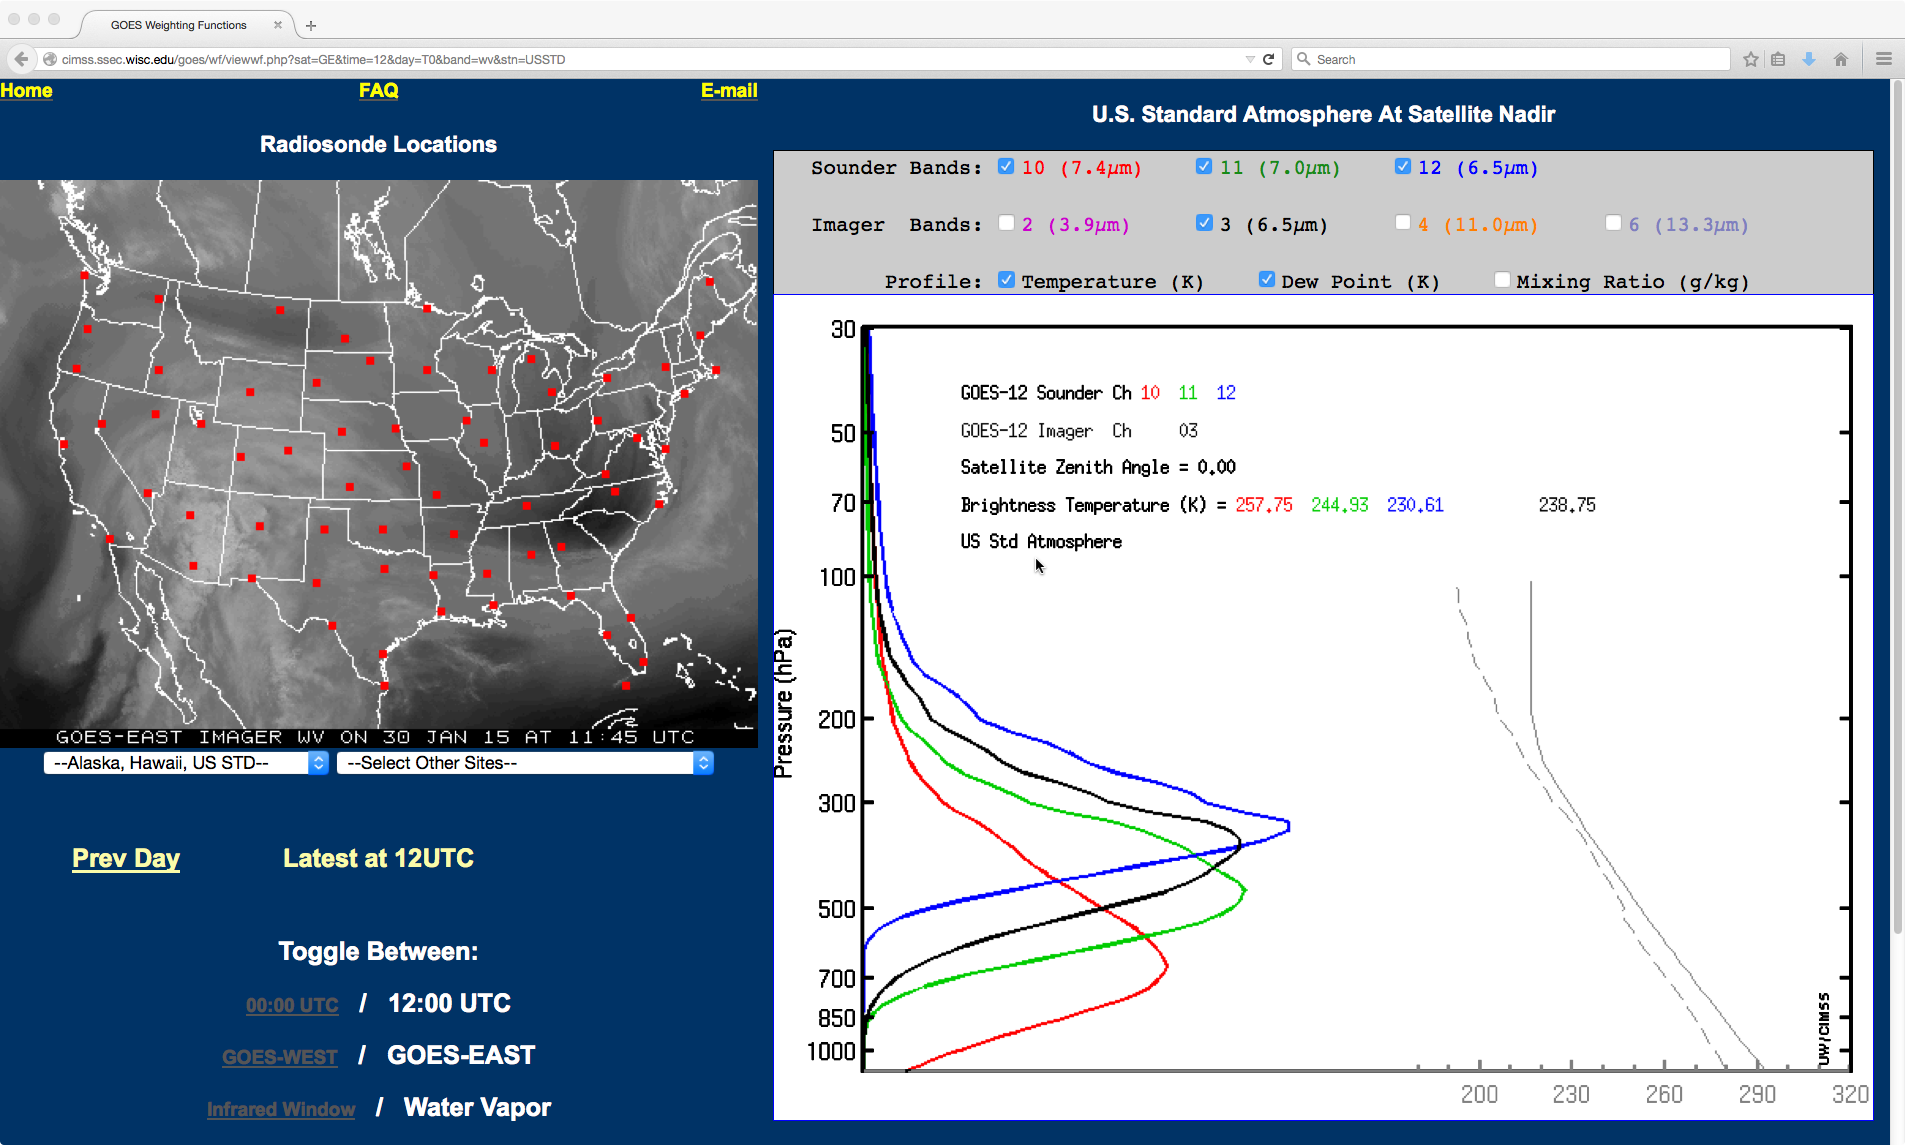
GOES-13 water vapor channel weighting functions, calculated using the US Standard Atmosphere sounding profilek
View only this post Read Less


