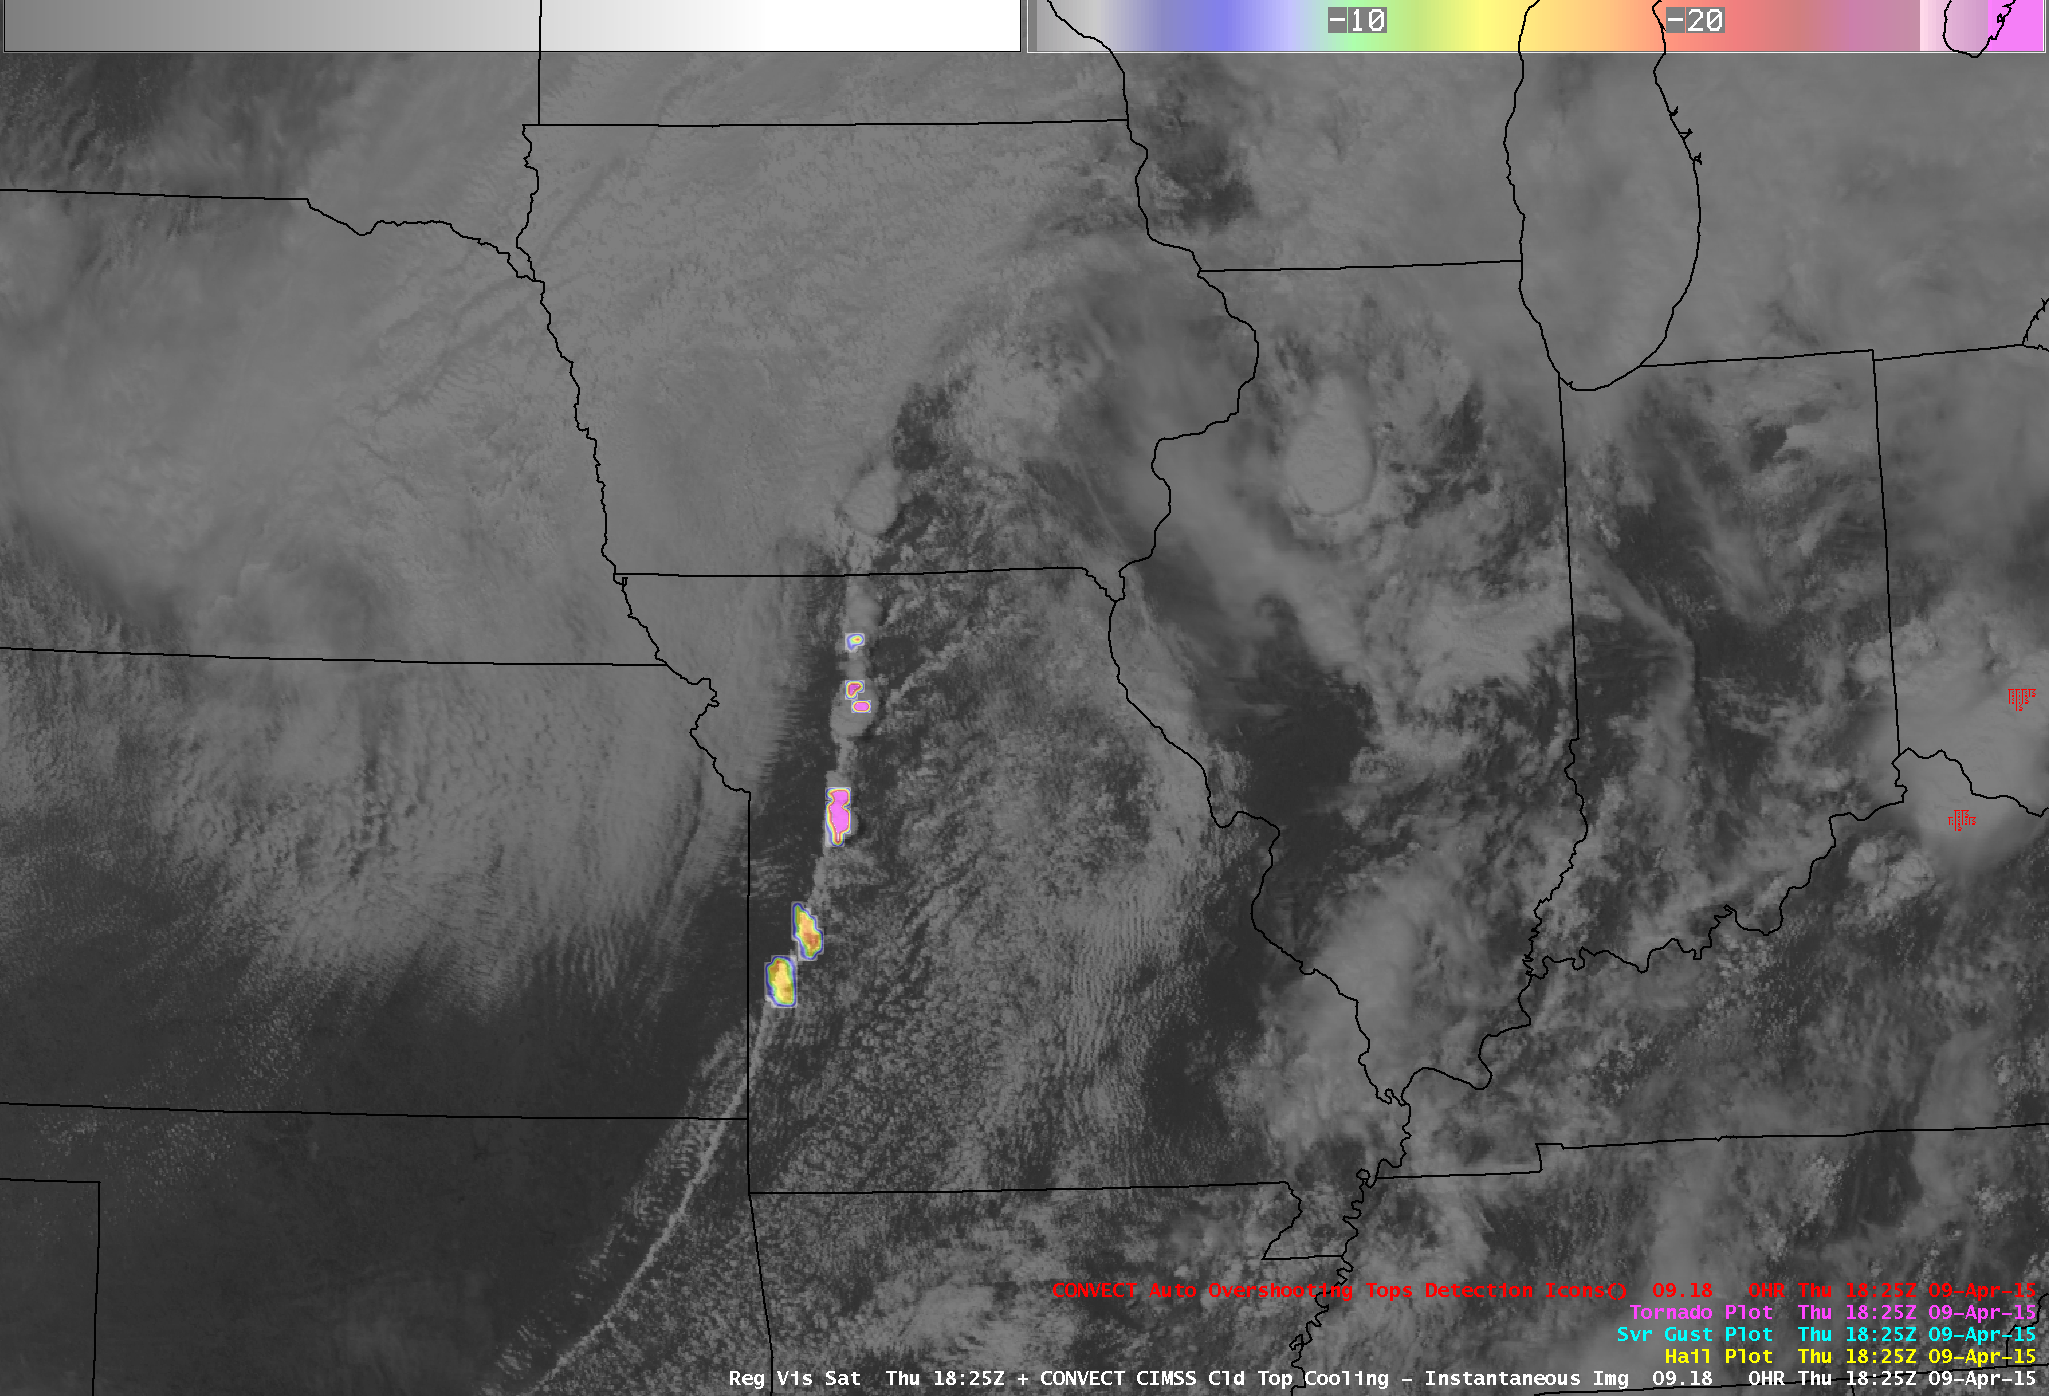
GOES-13 0.63 µm visible images, with Cloud-Top Cooling Rate, Overshooting Tops Detection, and SPC storm reports (click to play animation)
A deepening area of low pressure (21 UTC surface analysis) was moving northeastward across the Midwest region of the US on 09 April 2015; GOES-13 0.63 µm visible images combined with the Cloud-Top Cooling Rate and Overshooting Tops Detection products (above; click image to play animation) showed a line of severe thunderstorms which quickly developed along the associated cold frontal boundary as it moved eastward across Iowa and Missouri during the afternoon hours. Cloud-Top Cooling Rates with some of the storms in Missouri were in excess of 50º C per 15 minutes (violet color enhancement) during their early stage of development (18:25 UTC image).
A comparison of Suomi NPP VIIRS 0.64 µm visible channel and 11.45 µm IR channel images at 18:51 UTC or 1:51 PM local time (below) showed that the line of thunderstorms was beginning to produce a number of cloud-to-ground lightning strikes.
Suomi NPP VIIRS 11.45 µm IR channel image and 0.64 µm visible channel image with cloud-to-ground lightning strikes
Focusing our attention on eastern Iowa and northern Illinois — where there were widespread reports of large hail, damaging winds, and tornadoes (SPC storm reports) — the organization of large, discrete supercell thunderstorms can be seen on GOES-13 0.63 µm visible channel images (below; click image to play animation), which exhibited numerous overshooting tops.
GOES-13 0.63 µm visible channel images, with SPC storm reports (click to play animation)
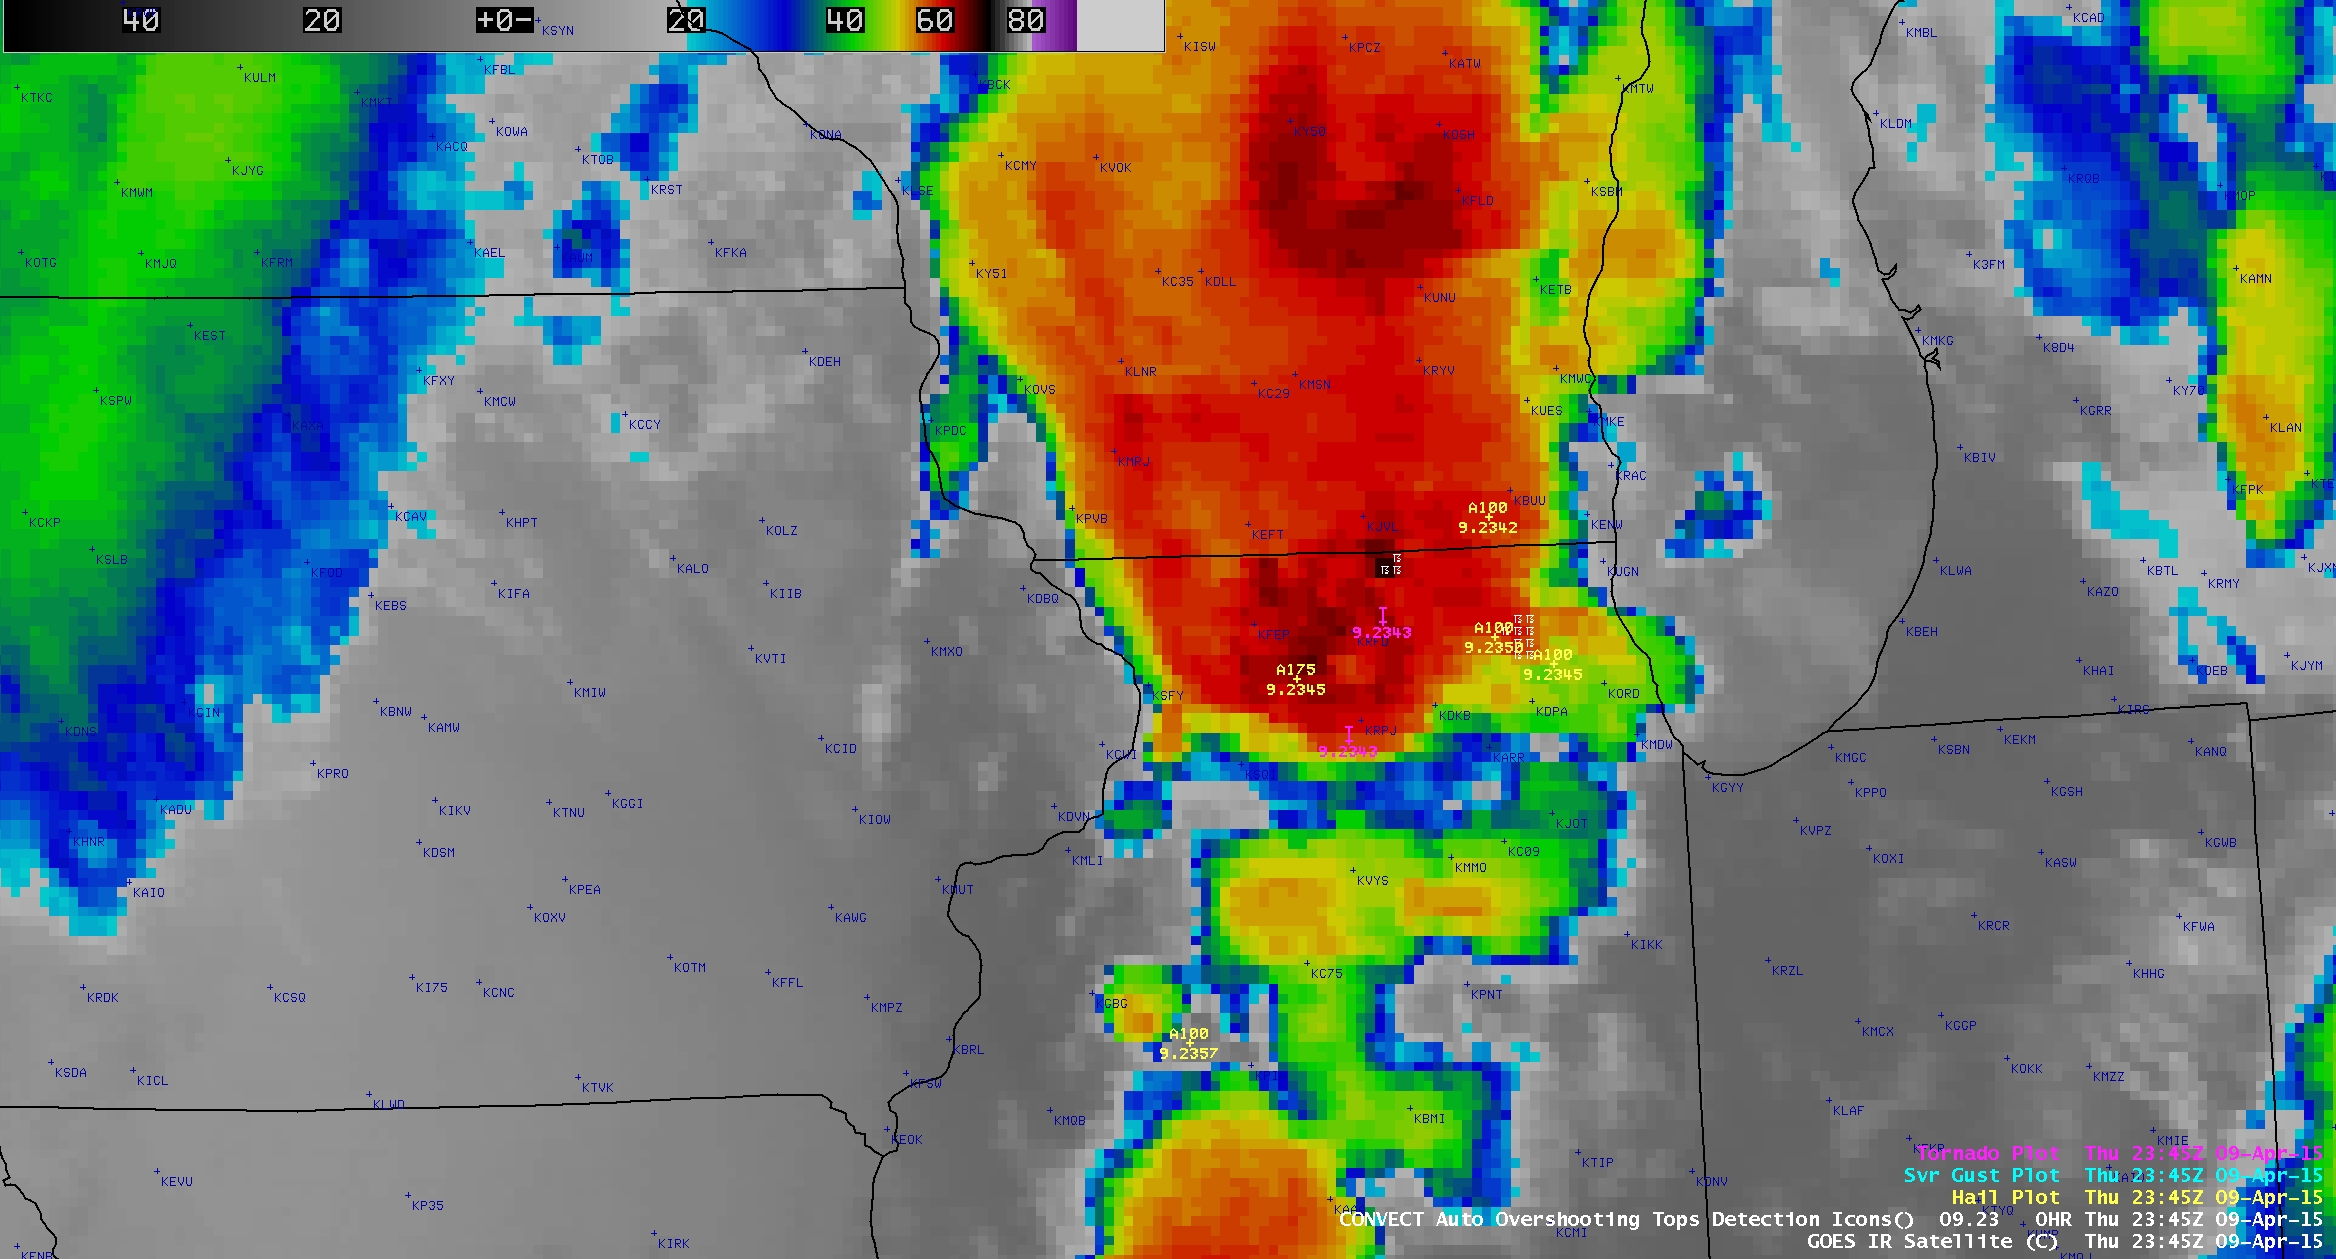
The corresponding GOES-13 10.7 µm IR channel images (below; click image to play animation) showed that the coldest cloud-top IR brightness temperatures were -67º C (darker black enhancement).
GOES-13 10.7 µm IR images, with Overshooting Top Detection and SPC storm reports (click to play animation)
The NOAA/CIMSS ProbSevere product (below; click image to play animation) gauges the likelihood of a storm first producing severe weather (of any kind) within the next 60 minutes. It combines information about the environment (Most Unstable CAPE, Environmental Shear) from the Rapid Refresh Model, information about the growing cloud (Vertical Growth Rate as a percentage of the troposphere per minute and Glaciation Rate, also as a percentage per minute), and Maximum Expected Hail Size (MESH) from the MRMS. In this event, the ProbSevere product performed well for the storm that spawned the EF-4 tornado, although due to the cloudiness of the satellite scene the ProbSevere model was unable to diagnose vertical growth rate and glaciation rate (which diminished the potential lead-time). Below is a chronological timeline of events for that storm:
2308 UTC: first ProbSevere > 50%
2310 UTC: first ProbSevere > 70%
2311 UTC: NWS Severe T-Storm Warning
2312 UTC: ProbSevere = 88%
2323 UTC: 1.00″ hail 2 SE Dixson (15 min lead-time for ProbSevere@50, 13 min for ProbSevere@70, 12 min for NWS Svr Warning)
2335 UTC: NWS Tornado Warning (ProbSevere = 94%)
2340 UTC: Tornado report 2 NE Franklin Grove
Radar reflectivity with NOAA/CIMSS ProbSevere model contours and NWS warning polygons (click to play animation)
In spite of widespread cloudiness, the GOES-13 Sounder single-field-of-view Lifted Index (LI), Convective Available Potential Energy (CAPE), and Total Precipitable Water (TPW) derived product images (below) were able to portray that the air mass in the warm sector of the low ahead of the strong cold front was was both unstable — LI values of -4 to -8º C (yellow to red color enhancement) and CAPE values of 3000-4000 J/kg (yellow to red color enhancement) — and rich in moisture, with TPW values of 30-40 mm or 1.2 to 1.6 inches (yellow to red color enhancement).

GOES-13 Sounder Lifted Index derived product images (click to play animation)
GOES-13 Sounder CAPE derived product images (click to play animation)
GOES-13 Sounder Total Precipatable Water (TPW) derived product images (click to play animation)
On the following day (10 April), it was cloud-free as the Landsat-8 satellite passed over northern Illinois at 16:41 UTC or 11:41 AM local time — and the 30.2 mile long southwest-to-northeast oriented tornado damage path that produced EF-4 damage and was responsible for 2 fatalities and 22 injuries (NWS Chicago event summary) was evident on 15-meter resolution Band 8 0.59 µm panchromatic visible images viewed using the SSEC RealEarth web map server (below). An aerial survey of part of the tornado damage path can be seen here.
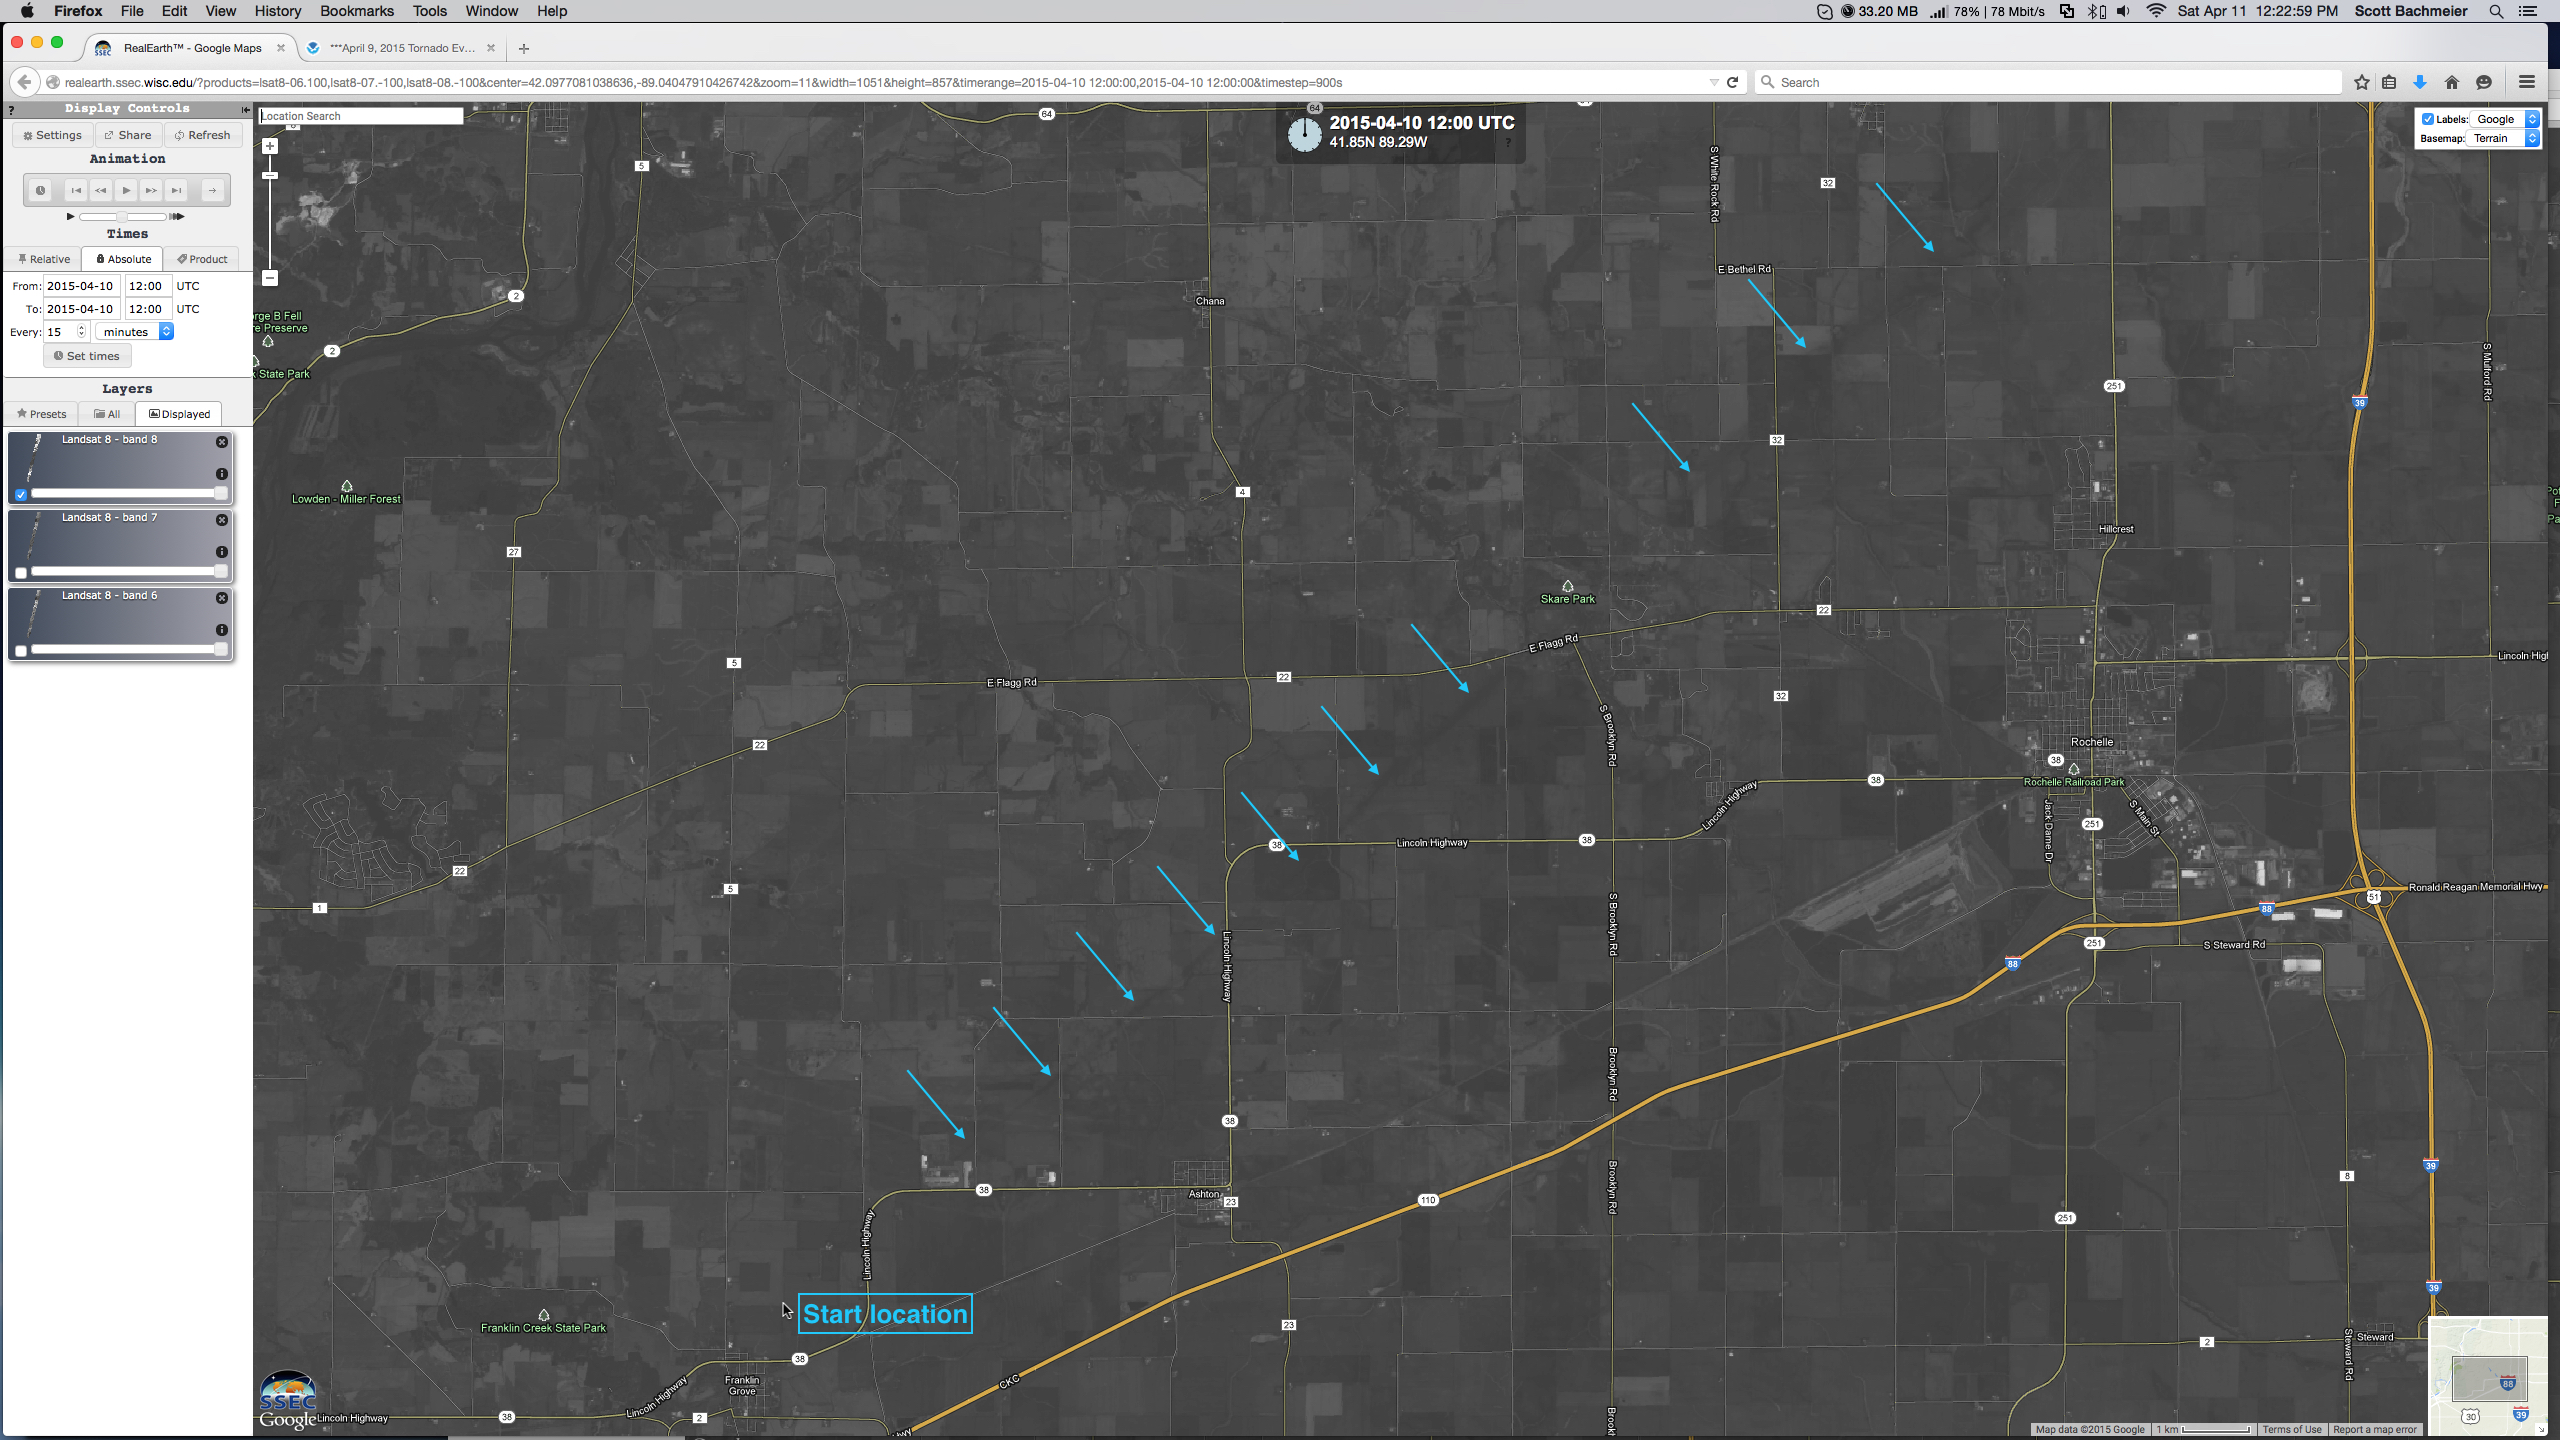
Landsat-8 0.59 µm panchromatic visible image of southwestern portion of tornado damage track (click to enlarge)
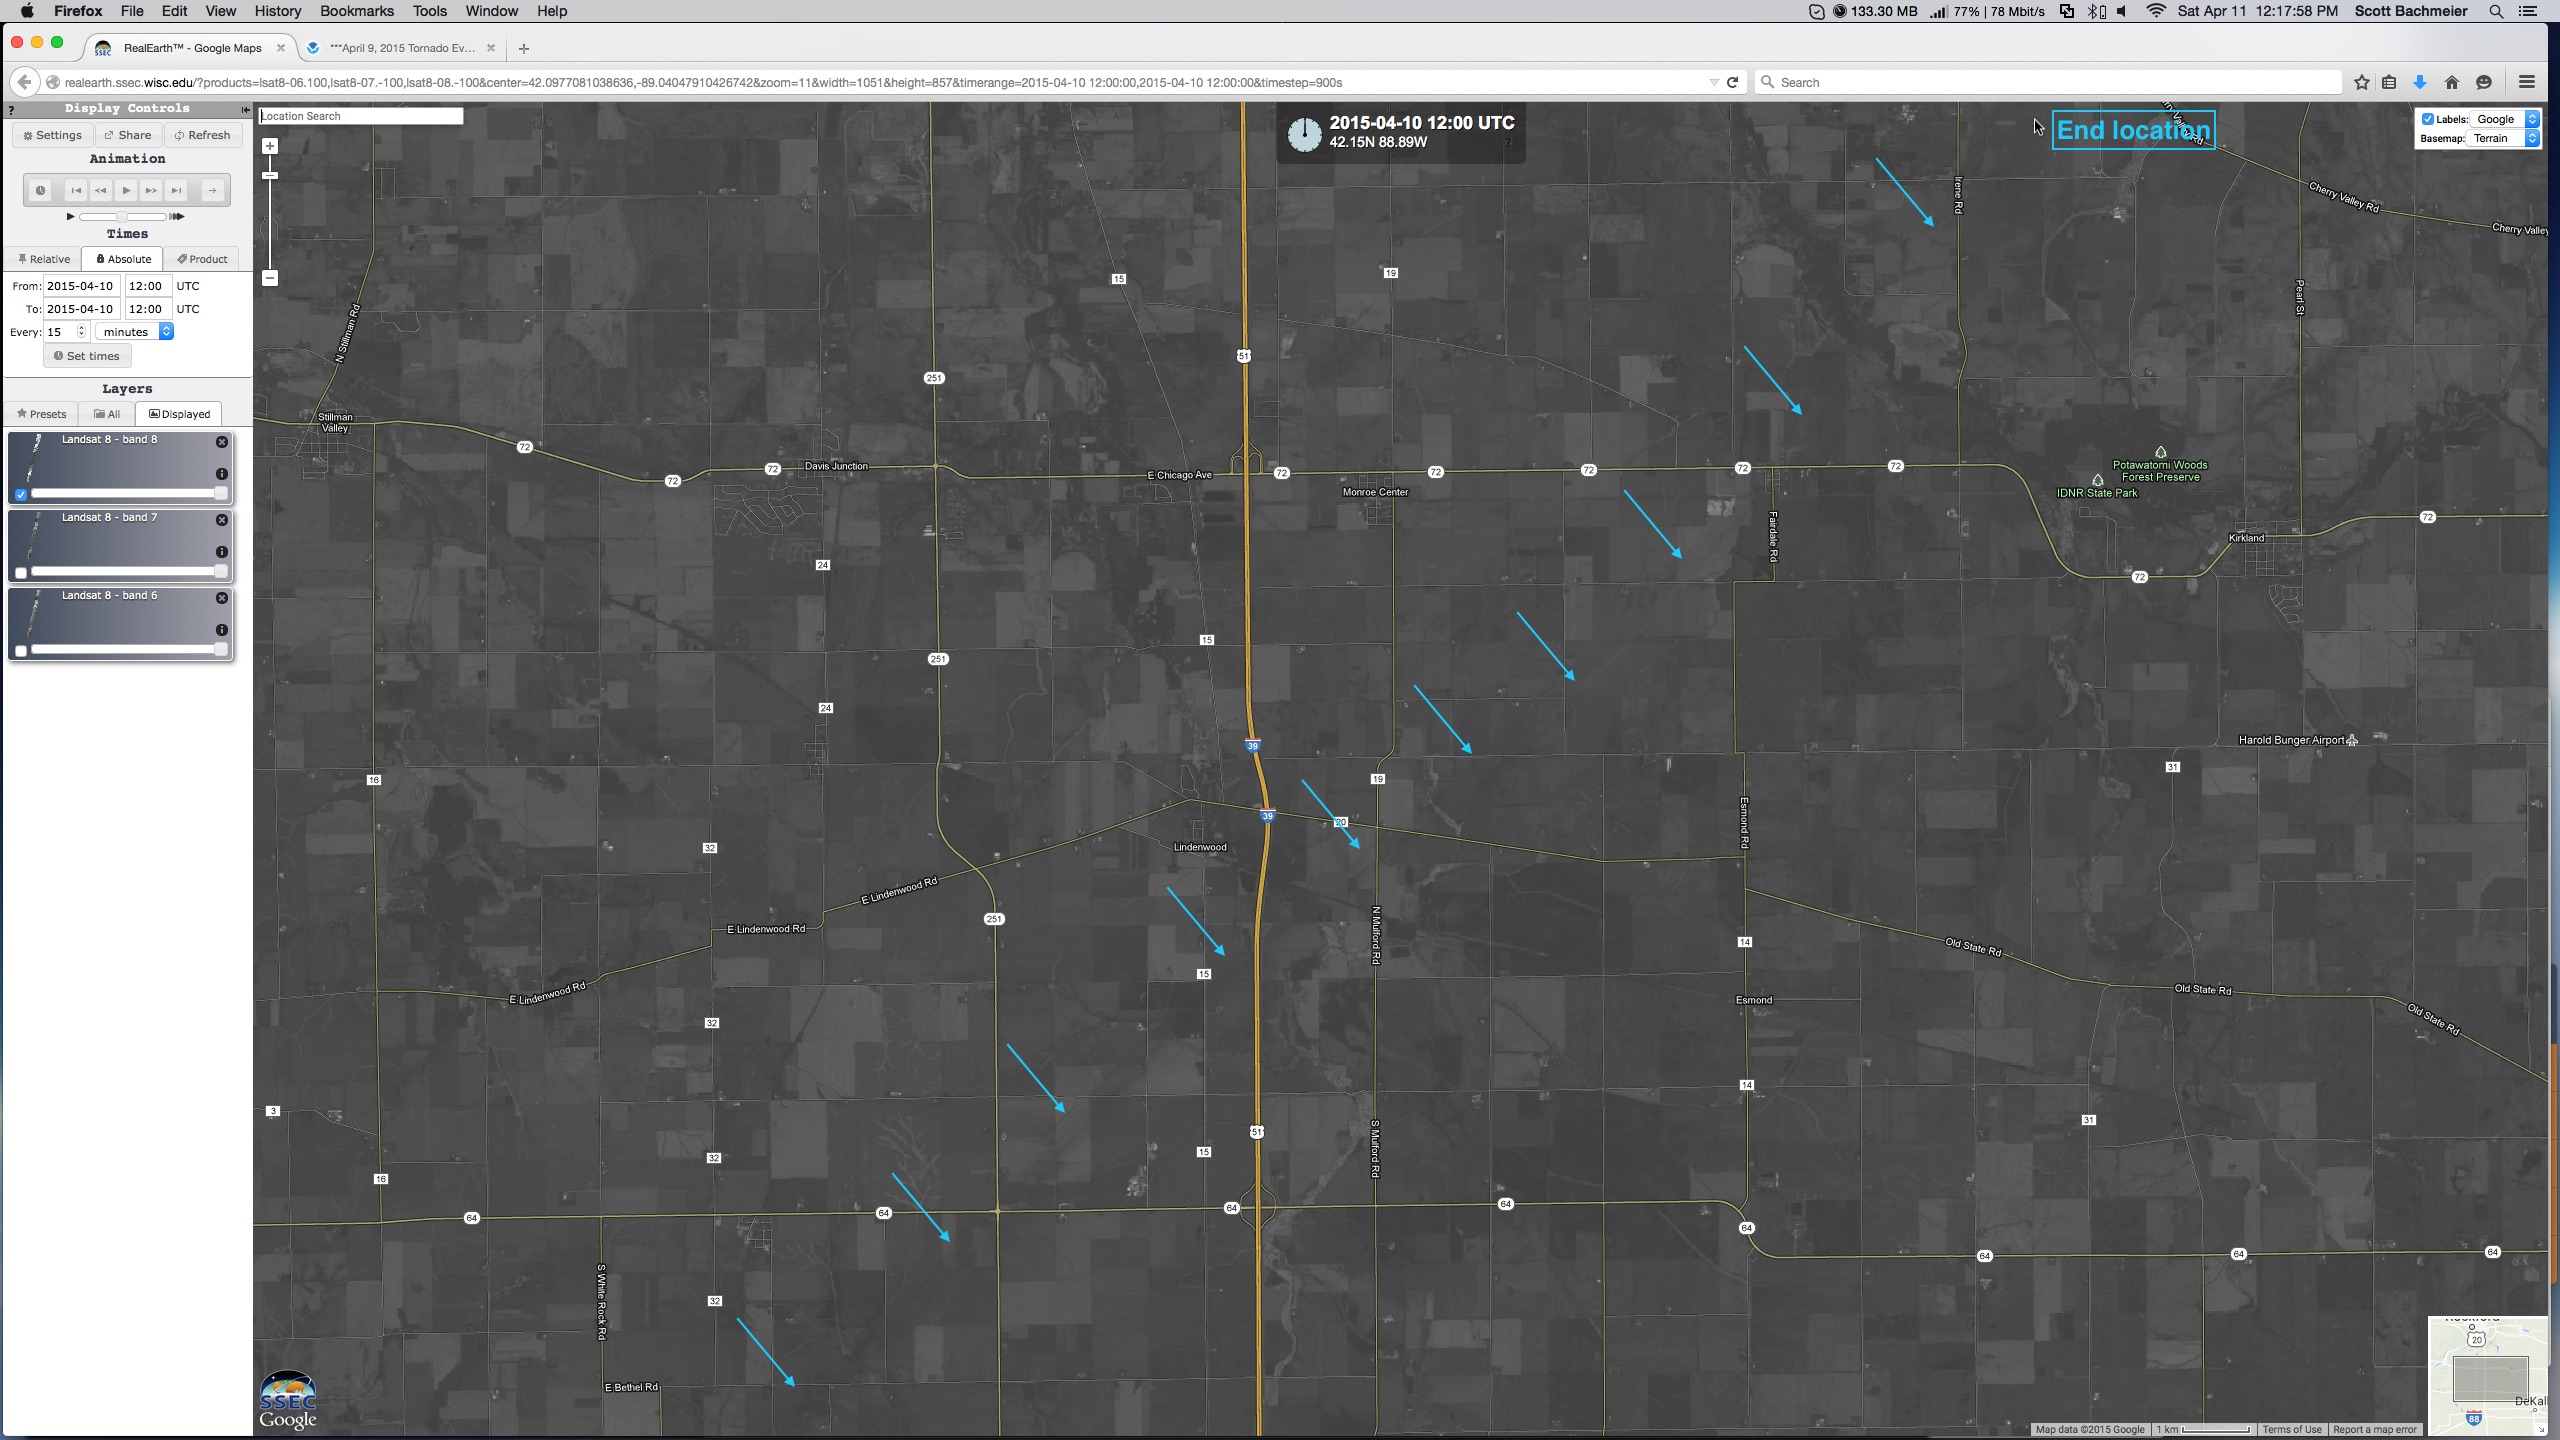
Landsat-8 0.59 µm panchromatic visible image of northeastern portion of tornado damage path (click to enlarge)
A Landsat-8 false-color image (using Bands 6/5/4 as Red/Green/Blue) is shown below. The 2 tornado-related fatalities occurred in Fairdale.
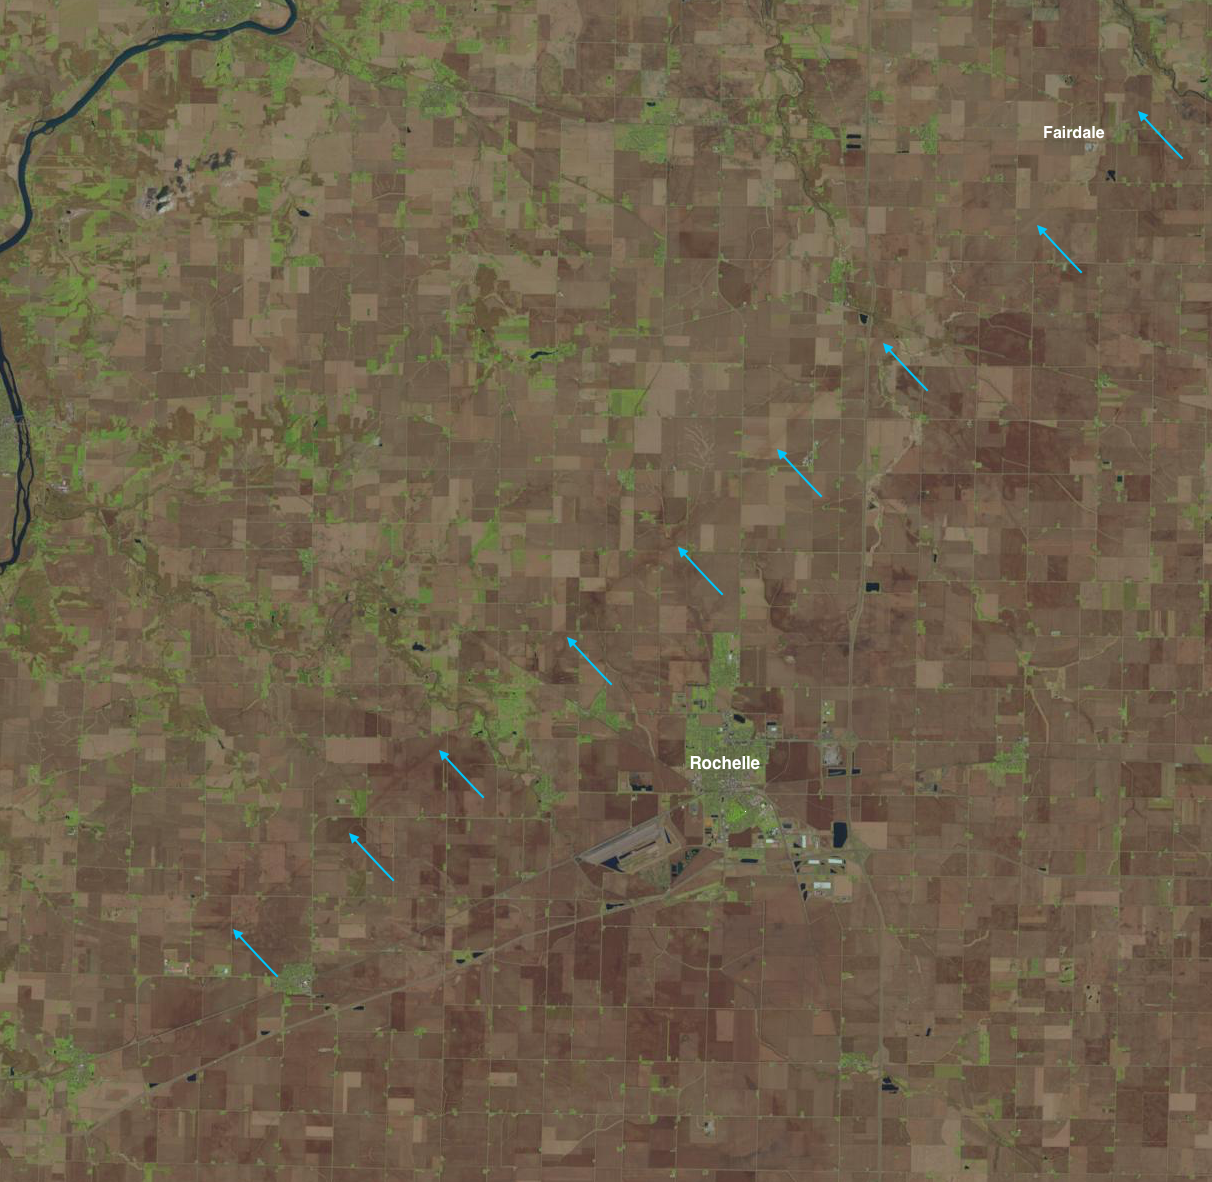
Landsat-8 false-color image (using Bands 6/5/4 as R/G/B)
On a side note, in the cold (northwestern) sector of the low it was cold enough for the precipitation type to be snow — and up to 4 inches of snow fell in western Iowa. GOES-13 0.63 µm visible channel images (below; click image to play animation) showed the swath of snow cover as it rapidly melted during the daytime hours on 10 April.
GOES-13 0.63 µm visible channel images (click to play animation)
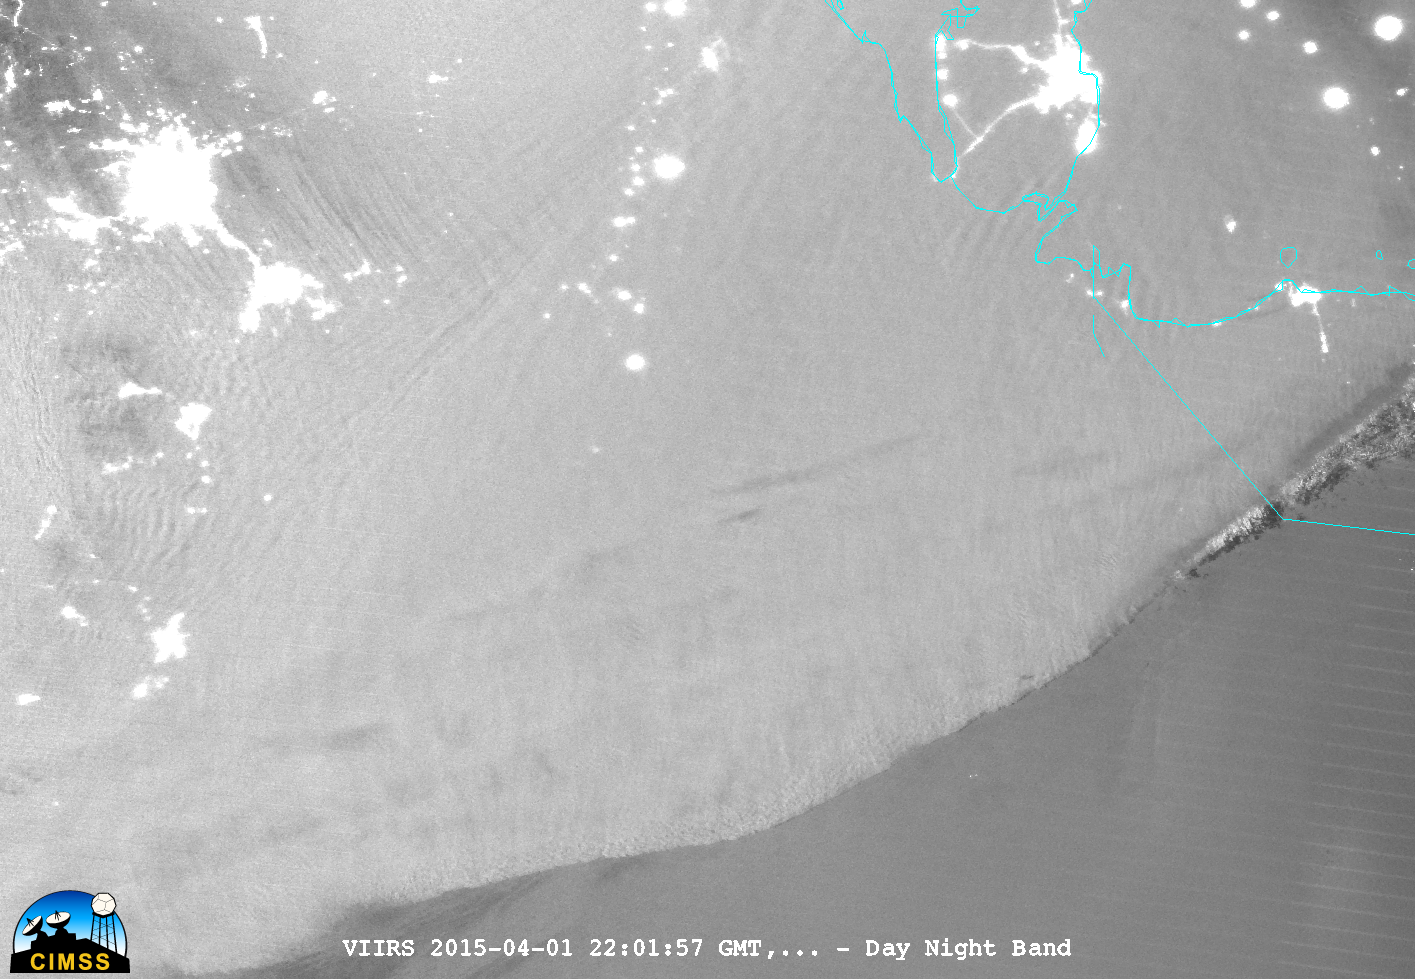
In fact, the swath of snow cover across eastern Nebraska and western/northern Iowa was also evident on a Suomi NPP VIIRS Day/Night Band (DNB) image at 08:49 UTC or 3:39 AM local time (below), highlighting the “visible image at night” capability of the DNB (given ample illumination from the Moon).
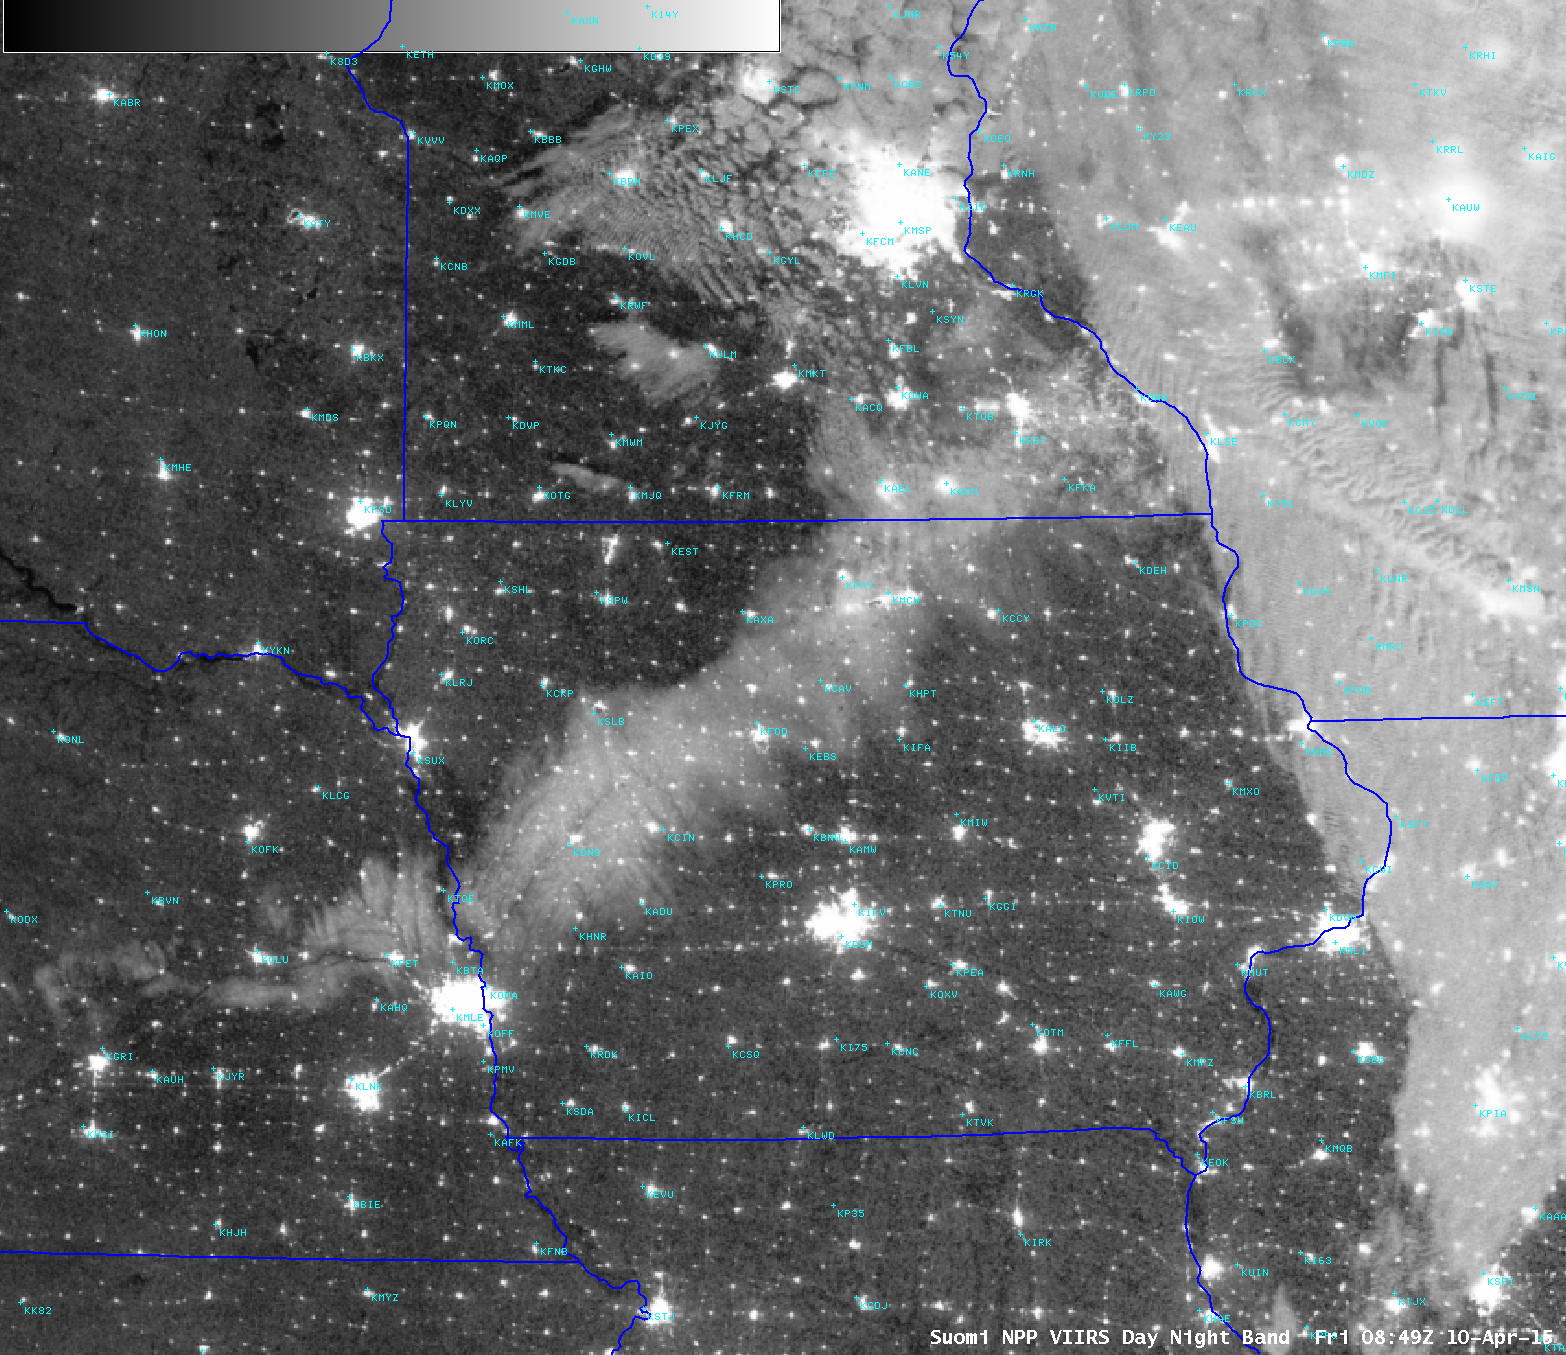
Suomi NPP VIIRS 0.7 µm Day/Night Band image
View only this post Read Less


