This website works best with a newer web browser such as Chrome, Firefox, Safari or Microsoft
Edge. Internet Explorer is not supported by this website.
After nearly 33 years of inactivity, a comparison of GOES-13 0.63 µm visible channel and 3.9 µm shortwave IR channel images (above; click to play animation; also available as an MP4 movie file) showed that the Wolf Volcano in the Galapagos Islands began to erupt sometime between 0645 and 0715 UTC on... Read More
GOES-13 0.63 µm visible channel (left) and 3.9 µm shortwave IR channel (right) images [click to play animation]
After nearly 33 years of inactivity, a comparison of GOES-13 0.63 µm visible channel and 3.9 µm shortwave IR channel images (above; click to play animation; also available as an MP4 movie file) showed that the Wolf Volcano in the Galapagos Islands began to erupt sometime between 0645 and 0715 UTC on 25 May 2015. A large thermal anomaly or “hot spot” (red-enhanced pixels) was quite apparent, along with what appeared to be a brief post-eruption “shock wave” (warmer, darker gray enhancement) propagating radially outward from the eruption site on the 0715 and 0745 UTC shortwave IR images. Two plumes of volcanic cloud could be seen: a small one at a lower altitude propagating northeastward, and a second larger plume at a higher altitude moving south-southwestward.
With the arrival of daylight at 1215 UTC, a portion of the volcanic cloud could be seen at times (although identification was difficult with widespread meteorological clouds present in the area).
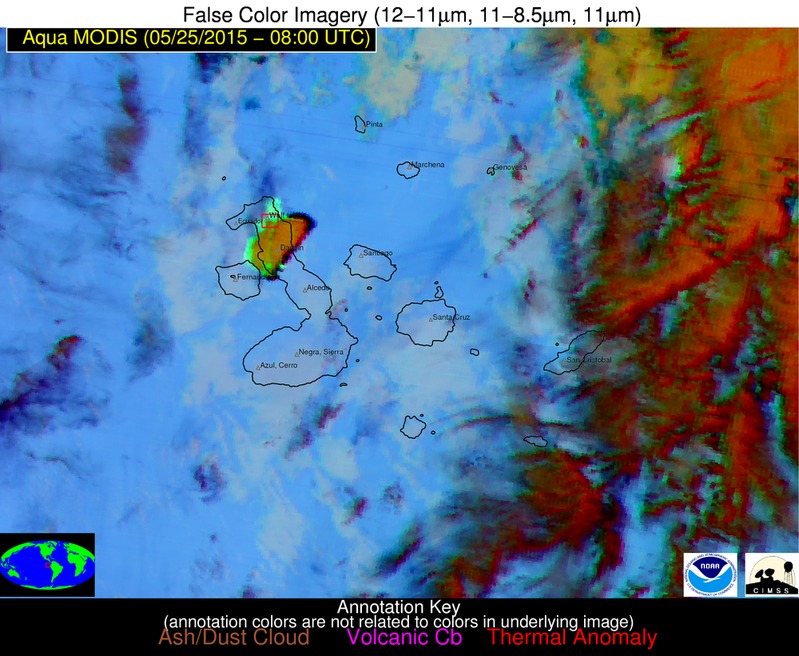
An Aqua MODIS false-color Red/Gren/Blue (RGB) image at 0800 UTC (below; courtesy of Michael Pavolonis, NOAA/NESDIS/CIMSS) displayed a signal of SO2 (green enhancement) along the edges of the larger volcanic cloud as it was moving southward.
Aqua MODIS false-color RGB image
GOES-13 10.7 µm IR channel images (below; click to play animation; also available as an MP4 movie file) indicated that the coldest cloud-top IR brightness temperature of -65º C appeared at 1015 UTC with the larger plume moving south-southwestward.
GOES-13 10.7 µm IR channel images [click to play animation]
According to the nearby San Cristobal rawinsonde report at 12 UTC, the altitude of the -65º C temperature was around 14 km, at the 157 hPa pressure level. The tropopause for this sounding was coded to be at 16.1 km or 109.0 hPa, where the air temperature was -80.7º C.
San Cristobal, Galapagos Islands rawinsonde data profile
The latest advisories issued by the Washington Volcanic Ash Advisory Center can be found here.
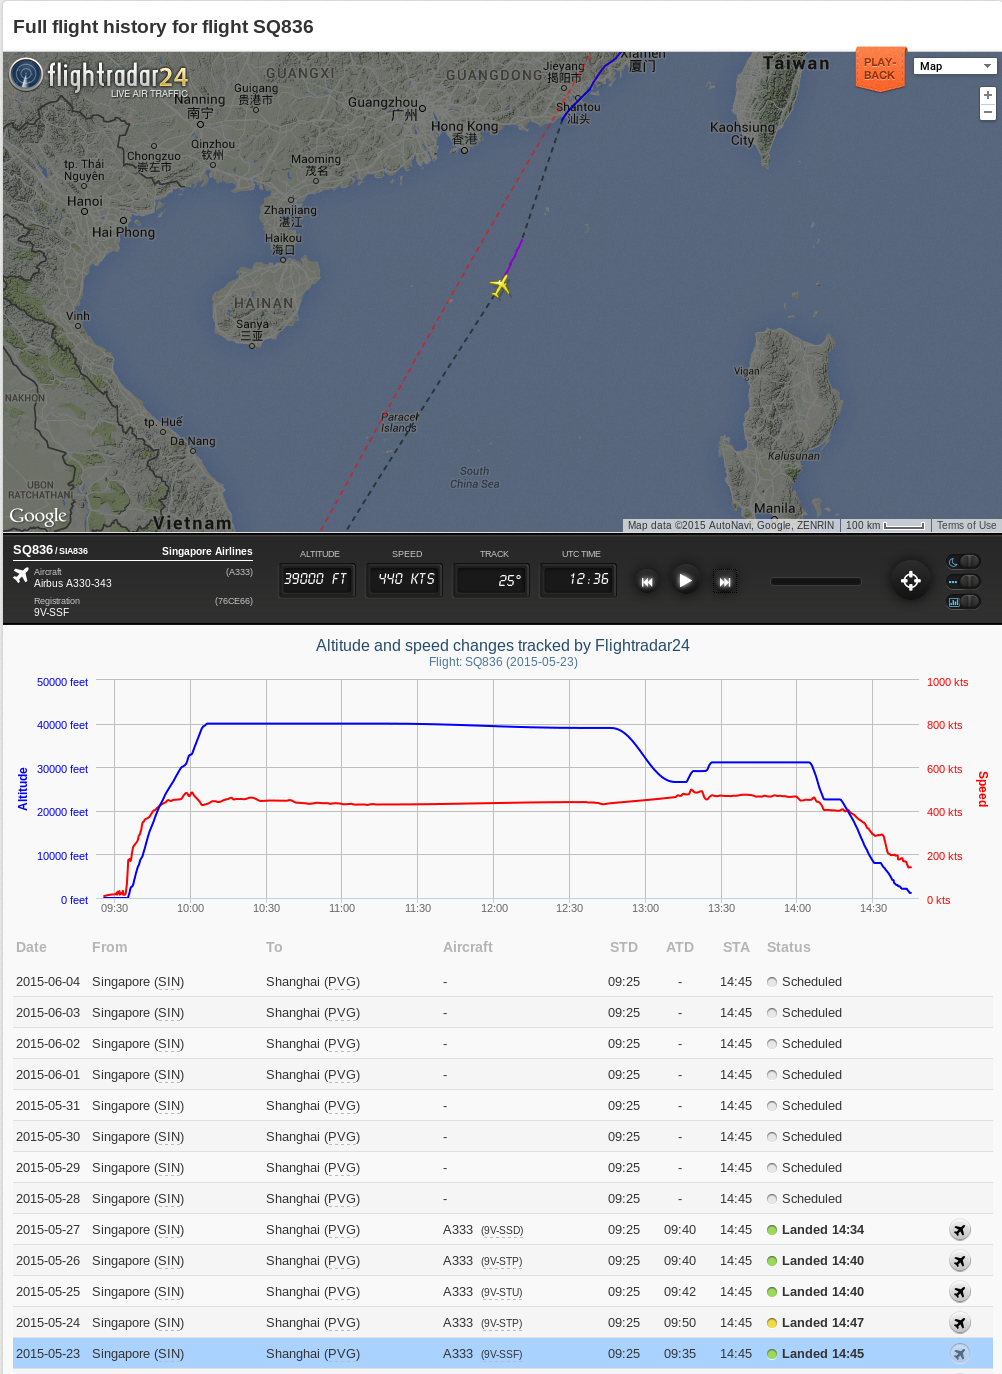
Singapore Airlines Flight SQ836 was en route to Shanghai from Singapore on 23 May 2015 when it lost power from both engines at an altitude of 39,000 feet over the South China Sea, not far south-southeast of Hong Kong (Aviation Herald). The aircraft lost about 13,000 feet in altitude (above) before... Read More
Singapore Airlines Flight SQ836 path, altitude, and airspeed (from flightradar24)
Singapore Airlines Flight SQ836 was en route to Shanghai from Singapore on 23 May 2015 when it lost power from both engines at an altitude of 39,000 feet over the South China Sea, not far south-southeast of Hong Kong (Aviation Herald). The aircraft lost about 13,000 feet in altitude (above) before the engines were successfully re-started. The violet portion of the flight path denotes the period when no ADS-B data were received, from 1246 to 1311 UTC.
Himawari-8 11.2 um IR channel images (click to play animation)
Himawari-8 AHI 11.2 um IR channel images (above; click image to play animation; also available as an MP4 movie file) and 6.2 um water vapor channel images (below; click image to play animation; also available as an MP4 movie file) showed a broken line of vigorous deep convection to the north of where the engine power loss first occurred (approximately within the yellow circle; VHHH is the airport identifier for Hong Kong). On the IR imagery, the coldest cloud-top brightness temperatures were in the -80 to -90 C range (shades of violet), and anvil debris could be seen drifting south-southwestward. This convective cloud debris may have contributed to a phenomenon known as ice crystal icing, which affected the engines of the aircraft.
Himawari-8 6.2 um water vapor channel images (click to play animation)
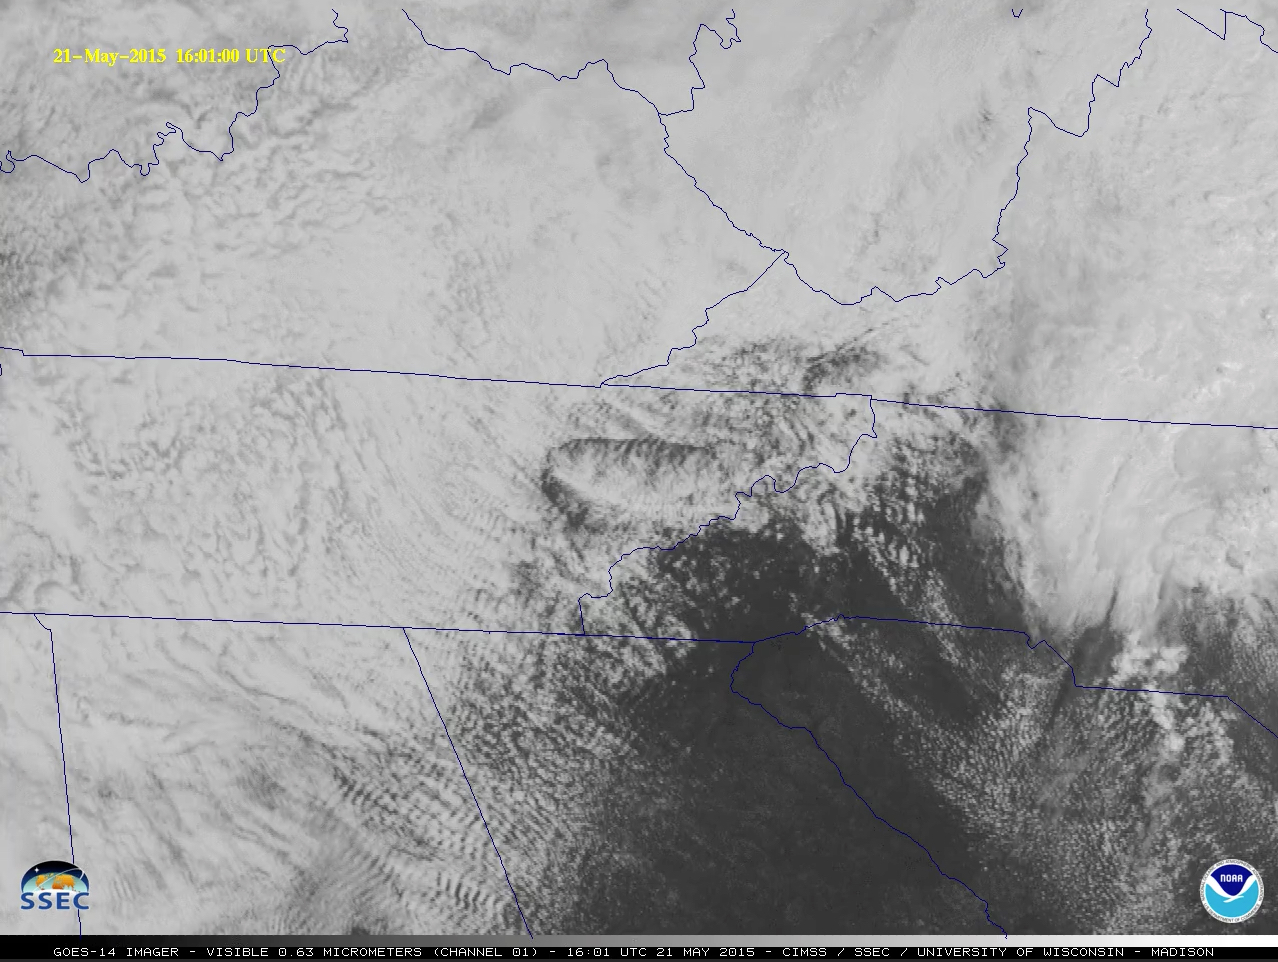
GOES-14 remained in Super Rapid Scan Operations for GOES-R (SRSO-R) demonstration mode on 21 May 2015, providing 1-minute images for much of the eastern US (see this blog post) — and another interesting feature was seen over eastern Tennessee that was rather perplexing. Since this easily qualified for the “What the... Read More
GOES-14 remained in Super Rapid Scan Operations for GOES-R (SRSO-R) demonstration mode on 21 May 2015, providing 1-minute images for much of the eastern US (see this blog post) — and another interesting feature was seen over eastern Tennessee that was rather perplexing. Since this easily qualified for the “What the heck is this?” blog category, we thought it might be fun to have a contest of sorts and invite readers to submit their wild guesses and/or educated explanations. We will post more imagery later in the day on 22 May as to our explanation — but in the meantime, leave a comment on the blog (comments are moderated, so they will not appear until approved), or send your thoughts to our Twitter account.
—– 22 May Update —–
Thanks to all who submitted their suggestions here and on Twitter of an explanation of the “What the heck is this” feature; Here is our best guess:
GOES-13 (GOES-East) visible, 3.9 µm shortwave IR, 6.5 µm, and 10.7 µm IR images [click to play animation]
The first step in trying to understand what might be causing this interesting feature was to examine 4-panel images showing imagery from other GOES channels (or spectral bands): in this case, the 3.9 µm “shortwave IR” channel, the 6.5 µm “water vapor” channel, and the 10.7 µm “IR window channel” (above; click image to play animation). The 3.9 µm IR brightness temperatures of cloud features were in the +20 to +25º range, while the 10.7 µm IR brightness temperatures were in the +3 to +5º C range — the significantly warmer shortwave IR temperatures indicates that the clouds were comprised of liquid or supercooled cloud droplets. Otherwise, no significant clues were seen on the IR (or the water vapor) images.
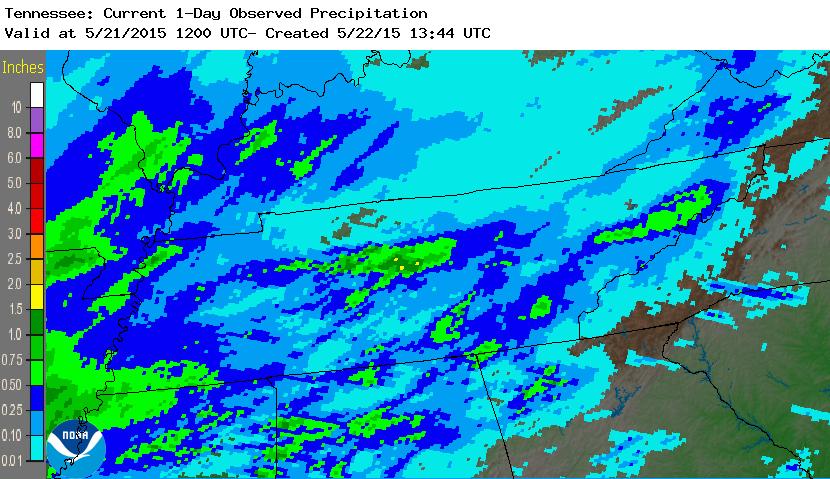
However, the METAR surface reports offer an important clue: a rain shower moved from southwest to northeast through the region during the preceding overnight hours with the passage of a weak low pressure system (surface analyses), with Knoxville (station identifier KTYS) receiving 0.23″ and Oak Ridge (KOQT) receiving 0.10″ of rainfall (radar-estimated 24-hour precipitation). Therefore, one plausible explanation of the feature seen on visible imagery is that it was a shallow pool of stable, rain-cooled air near the surface that was spreading out and flowing downslope (westward) into the Great Valley of East Tennessee during the morning and early afternoon hours.
While the outer edges of this rain-cooled stable air feature remained generally cloud-free, the inner core exhibited a good deal of cloud development (including what appeared to be a more dense northwest-to-southeast oriented cloud band through the middle). An overlay of hourly RTMA surface winds (below; click image to play animation) indicated that there was convergence within the feature (to the lee of higher terrain within the Cumberland Plateau), which along with daytime heating of the moist soil would have helped to promote such shallow cloud development.
GOES-13 0.63 µm visible channel images, with RTMA surface winds [click to play animation]
For clouds within expanding the rain-cooled boundary at 1534 UTC, the CLAVR-x POES AVHRR Cloud Type was liquid, with Cloud Top Height values of 1-3 km and Cloud Top Temperature values of +2 to +10º C (below).
CLAVR-x POES AVHRR Cloud Type, Cloud Top Height, and Cloud Top Temperature products
GOES-14 0.62 µm visible imagery, above, (here as an mp4, and here as a very large (220+ megabytes) animated gif) shows the development of convection over eastern North Carolina in a region of slight risk according to SPC (below). ==================================================================================Mesoscale Discussion #713 from SPC, below, referenced the Super-Rapid scan imagery:MESOSCALE DISCUSSION 0713 NWS STORM PREDICTION CENTER NORMAN... Read More
GOES-14 0.62 µm visible imagery, above, (here as an mp4, and here as a very large (220+ megabytes) animated gif) shows the development of convection over eastern North Carolina in a region of slight risk according to SPC (below).
Day 1 Outlook for Convection from SPC, issued at 1300 UTC 21 May 2015 [click to enlarge]
MESOSCALE DISCUSSION 0713
NWS STORM PREDICTION CENTER NORMAN OK
1111 AM CDT THU MAY 21 2015
AREAS AFFECTED…E-CNTRL AND ERN NC / SC GRAND STRAND
CONCERNING…SEVERE POTENTIAL…WATCH POSSIBLE
VALID 211611Z – 211745Z
PROBABILITY OF WATCH ISSUANCE…60 PERCENT
SUMMARY…SCATTERED STORMS ARE FORECAST TO DEVELOP OVER THE NEXT FEW
HOURS. AN ISOLATED SEVERE THREAT WILL LIKELY DEVELOP AND A WATCH
WILL STRONGLY BE CONSIDERED.
DISCUSSION…SUBJECTIVE SURFACE MESOANALYSIS PLACES A LOW 30 MI W
SOP WITH A WEST-EAST ORIENTED WARM FRONT AND A TRAILING COLD FRONT
ACROSS THE SC PIEDMONT. A PREFRONTAL CONFLUENCE/SURFACE TROUGH
EXTENDS FROM THE LOW SEWD THROUGH THE GRAND STRAND VICINITY.
OBSERVATIONS TO THE E OF THE SURFACE TROUGH AND LOCATED WITHIN THE
WARM SECTOR SHOW TEMPS WARMING TO NEAR 80 DEG F WITH BOUNDARY LAYER
DEWPOINTS IN THE MID-UPPER 60S INLAND AND AROUND 70 NEAR THE COAST. SUPER RAPIDSCAN VISIBLE IMAGERY SHOWS A BUILDING TCU FIELD
IMMEDIATELY E OF THE LOW AND ALONG THE PREFRONTAL TROUGH/CONFLUENCE.
WATER VAPOR IMAGERY LATE THIS MORNING IMPLIES A WEAK LEAD
DISTURBANCE MOVING ACROSS W-CNTRL NC AHEAD OF THE MID MS VALLEY
SHORTWAVE TROUGH FORECAST TO APPROACH THE CNTRL APPALACHIANS LATER
TODAY. IT SEEMS THE WEAK UPPER FORCING FOR ASCENT PROVIDED BY THE
LEAD IMPULSE COUPLED WITH ADDITIONAL DIABATIC HEATING WILL ERODE THE
CAP OVER THE NEXT 1-2 HOURS AND SCATTERED STORM COVERAGE IS PROBABLE
BY THE 18-19Z TIMEFRAME.
VEERING AND A GRADUAL STRENGTHENING OF WINDS WITH HEIGHT WILL
SUPPORT STORM ORGANIZATION ONCE A FEW VIGOROUS UPDRAFTS BECOME
ESTABLISHED. FORECAST SOUNDINGS DEPICT MODERATE BUOYANCY AS OF 16Z
ACROSS THE WARM SECTOR AND THIS SHOULD FAVOR STORM INTENSIFICATION
OVER THE NEXT SEVERAL HOURS ONCE INITIATION COMMENCES. ISOLD LARGE
HAIL AND DMGG WINDS WILL BE THE PRIMARY THREATS. DESPITE TEMPERED
LOW-LEVEL SHEAR…A TORNADO MAY ALSO BE POSSIBLE ESPECIALLY IF A
SUPERCELL CAN DEVELOP AND FAVORABLY TRACK ALONG THE WARM FRONT.
The GOES-13 Sounder captured some of the destabilization that occurred ahead of the developing line of convection. Values less than -5 are widespread over southeastern North Carolina at 1600 UTC, after which time cirrus blowoff obscured the satellite view.
GOES-13 Sounder DPI values of Lifted Index, 1600 UTC 21 May 2015 [click to enlarge]
Suomi NPP’s orbits on 21 May allowed successive views of the developing convection, once at 1725 UTC and once near 1905 UTC. The convection developed near the edge of the swath in both images, however, so NUCAPS soundings did not view the environment closest to the storms. Infrared imagery, below, shows the quick evolution of convection.
Suomi NPP VIIRS 11.45 µm infrared imagery and NUCAPS Sounding Points (in green), ~1730 and ~1900 UTC 21 May 2015 [click to enlarge]
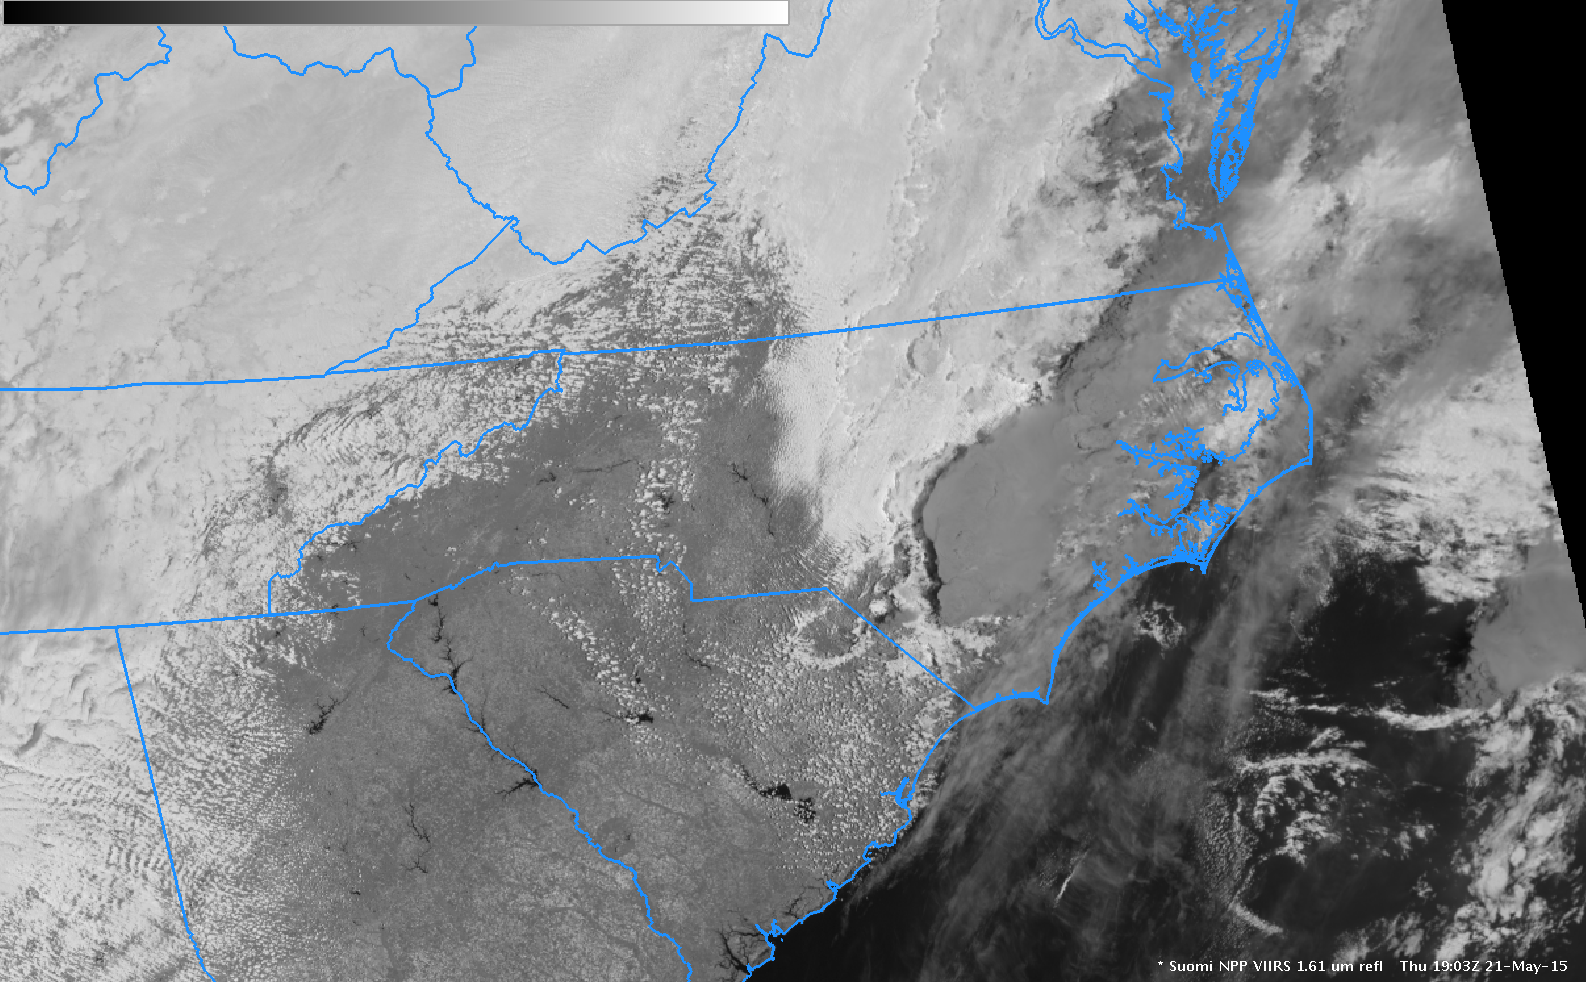
VIIRS visible (0.64 µm) and near-infrared (1.61 µm) imagery, below, shows that the developing storms glaciated quickly; the 1.61 µm imagery over the convection shows the darker grey values characteristic of regions where ice crystals are strongly absorbing radiation. Water-based clouds — over Kentucky, for example — appear as bright white in both channels.
Suomi NPP VIIRS 0.64 µm visible imagery and 1.61 µm near-infrared imagery 1903 UTC 21 May 2015 [click to enlarge]
![GOES-13 0.63 µm visible channel (left) and 3.9 µm shortwave IR channel (right) images [click to play animation]](https://cimss.ssec.wisc.edu/satellite-blog/wp-content/uploads/sites/5/2015/05/150525_goes13_visible_shortwaveIR_Wolf_Galapagos_anim.gif)
![GOES-13 10.7 µm IR channel images [click to play animation]](https://cimss.ssec.wisc.edu/satellite-blog/wp-content/uploads/sites/5/2015/05/150525_goes13_IR_Wolf_Galapagos_anim.gif)
![GOES-13 (GOES-East) visible, 3.9 µm shortwave IR, 6.5 µm, and 10.7 µm IR images [click to play animation]](https://cimss.ssec.wisc.edu/satellite-blog/wp-content/uploads/sites/5/2015/05/150521_goes13_4panel_anim.gif)
![GOES-13 0.63 µm visible channel images, with RTMA surface winds [click to play animation]](https://cimss.ssec.wisc.edu/satellite-blog/wp-content/uploads/sites/5/2015/05/150521_goes13_visible_rtma_surface_winds_anim.gif)
![Day 1 Outlook for Convection from SPC, issued at 1300 UTC 21 May 2015 [click to enlarge]](https://cimss.ssec.wisc.edu/satellite-blog/wp-content/uploads/sites/5/2015/05/day1otlk_1300_21May2015.gif)
![GOES-13 Sounder DPI values of Lifted Index, 1600 UTC 21 May 2015 [click to enlarge]](https://cimss.ssec.wisc.edu/satellite-blog/wp-content/uploads/sites/5/2015/05/GOES_DPI_LI_1600UTC_21May2015.png)
![Suomi NPP VIIRS 11.45 µm infrared imagery and NUCAPS Sounding Points (in green), ~1730 and ~1900 UTC 21 May 2015 [click to enlarge]](https://cimss.ssec.wisc.edu/satellite-blog/wp-content/uploads/sites/5/2015/05/SNPP_11.45_NCUAPS_1700_1840UTC_21May2015toggle.gif)
![Suomi NPP VIIRS 0.64 µm visible imagery and 1.61 µm near-infrared imagery 1903 UTC 21 May 2015 [click to enlarge]](https://cimss.ssec.wisc.edu/satellite-blog/wp-content/uploads/sites/5/2015/05/SNPP_1.61_0.64_1900UTC_21May2015toggle.gif)
