After nearly 33 years of inactivity, a comparison of GOES-13 0.63 µm visible channel and 3.9 µm shortwave IR channel images (above; click to play animation; also available as an MP4 movie file) showed that the Wolf Volcano in the Galapagos Islands began to erupt sometime between 0645 and 0715 UTC on... Read More
![GOES-13 0.63 µm visible channel (left) and 3.9 µm shortwave IR channel (right) images [click to play animation]](https://cimss.ssec.wisc.edu/satellite-blog/wp-content/uploads/sites/5/2015/05/150525_G13_VIS_SWIR_WOLF_VOLCANO_13.GIF)
GOES-13 0.63 µm visible channel (left) and 3.9 µm shortwave IR channel (right) images [click to play animation]
After nearly 33 years of inactivity, a comparison of GOES-13 0.63 µm visible channel and 3.9 µm shortwave IR channel images
(above; click to play animation; also available as an MP4 movie file) showed that the Wolf Volcano in the Galapagos Islands began to erupt sometime between 0645 and 0715 UTC on 25 May 2015. A large thermal anomaly or “hot spot”
(red-enhanced pixels) was quite apparent, along with what appeared to be a brief post-eruption “shock wave”
(warmer, darker gray enhancement) propagating radially outward from the eruption site on the 0715 and 0745 UTC shortwave IR images. Two plumes of volcanic cloud could be seen: a small one at a lower altitude propagating northeastward, and a second larger plume at a higher altitude moving south-southwestward.
With the arrival of daylight at 1215 UTC, a portion of the volcanic cloud could be seen at times (although identification was difficult with widespread meteorological clouds present in the area).
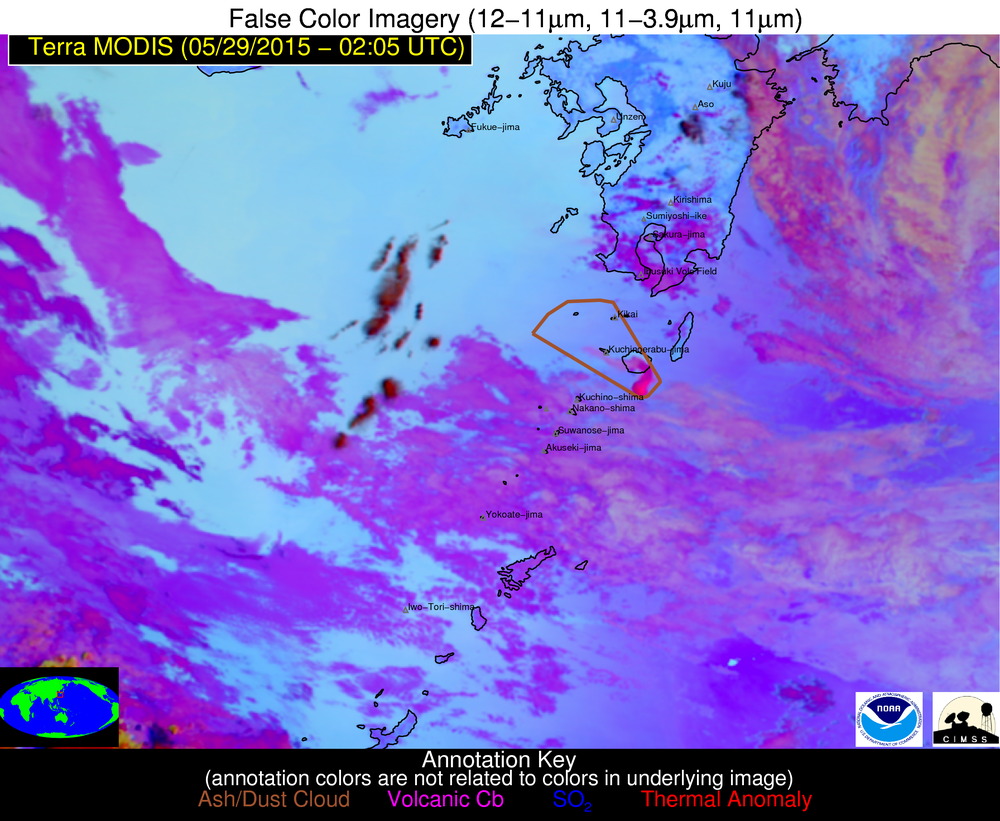
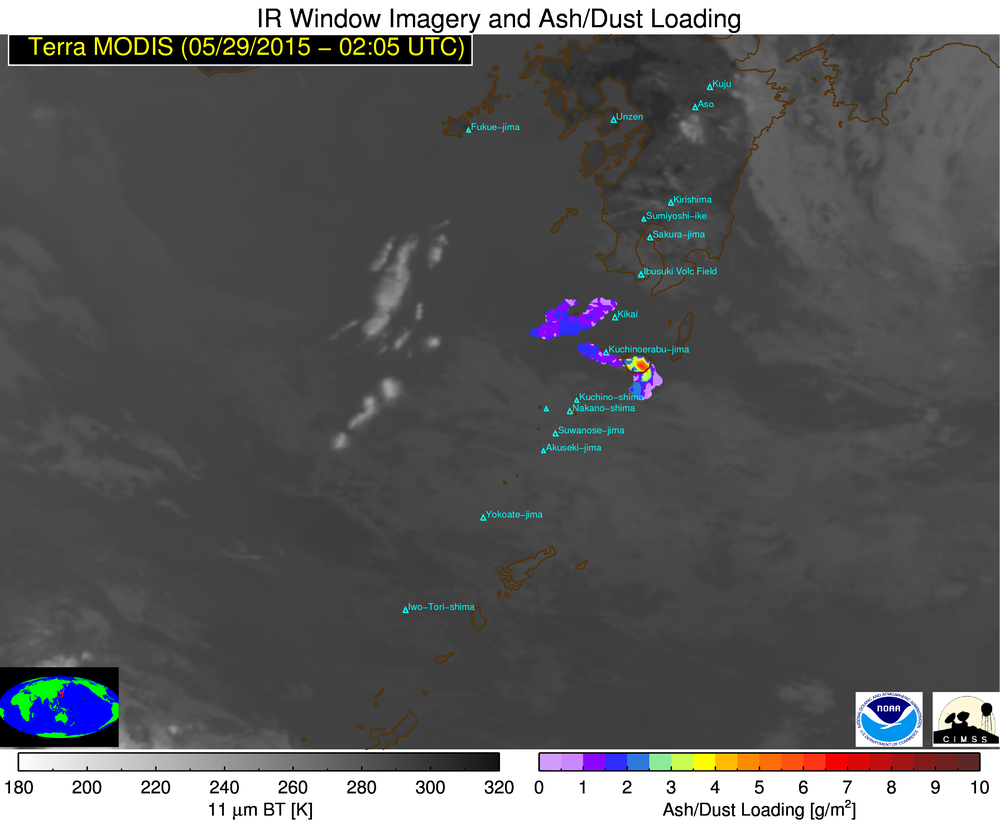
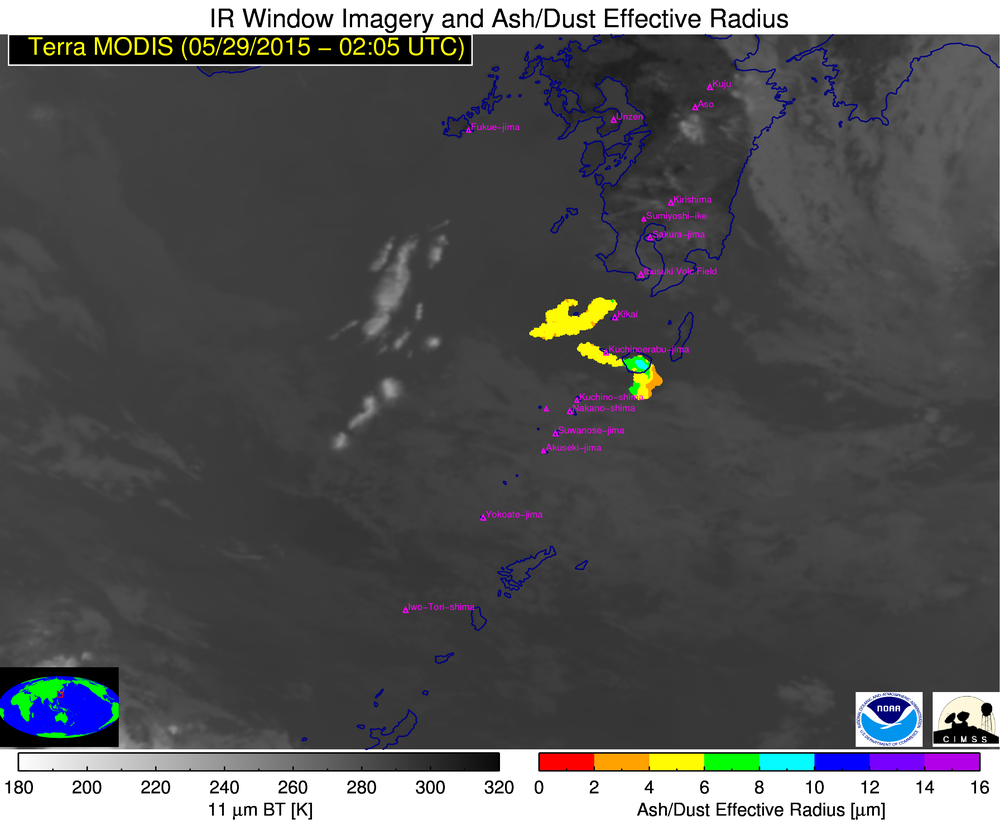
An Aqua MODIS false-color Red/Gren/Blue (RGB) image at 0800 UTC (below; courtesy of Michael Pavolonis, NOAA/NESDIS/CIMSS) displayed a signal of SO2 (green enhancement) along the edges of the larger volcanic cloud as it was moving southward.
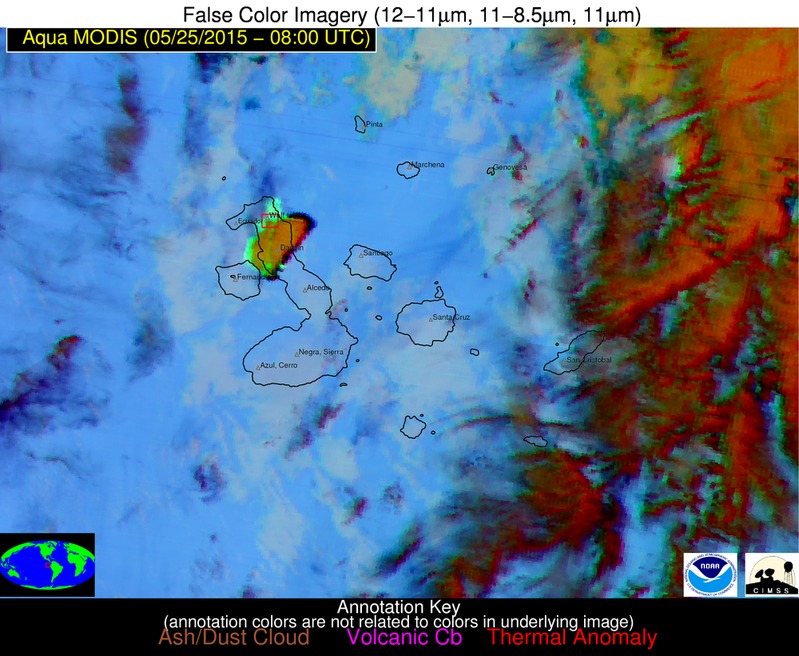
Aqua MODIS false-color RGB image
GOES-13 10.7 µm IR channel images (below; click to play animation; also available as an MP4 movie file) indicated that the coldest cloud-top IR brightness temperature of -65º C appeared at 1015 UTC with the larger plume moving south-southwestward.
![GOES-13 10.7 µm IR channel images [click to play animation]](https://cimss.ssec.wisc.edu/satellite-blog/wp-content/uploads/sites/5/2015/05/150525_G13_IR_WOLF_VOLCANO_08.GIF)
GOES-13 10.7 µm IR channel images [click to play animation]
According to the nearby San Cristobal rawinsonde report at 12 UTC, the altitude of the -65º C temperature was around 14 km, at the 157 hPa pressure level. The tropopause for this sounding was coded to be at 16.1 km or 109.0 hPa, where the air temperature was -80.7º C.
San Cristobal, Galapagos Islands rawinsonde data profile
The latest advisories issued by the Washington Volcanic Ash Advisory Center can be found here.
View only this post
Read Less
![NOAA/CIMSS ProbSevere Product, 1902-1922 UTC on 27 May 2015 [click to play very very large animation]](https://cimss.ssec.wisc.edu/satellite-blog/wp-content/uploads/sites/5/2015/05/GOES14_SC_CO_27May_1708_28May_0059.gif)
![NOAA/CIMSS ProbSevere Product, 1902-1922 UTC on 27 May 2015 [click to play animation]](https://cimss.ssec.wisc.edu/satellite-blog/wp-content/uploads/sites/5/2015/05/ProbSevere_1922_1922anim_27May2015.gif)
![GOES-13 0.63 µm visible channel (left) and 3.9 µm shortwave IR channel (right) images [click to play animation]](https://cimss.ssec.wisc.edu/satellite-blog/wp-content/uploads/sites/5/2015/05/150525_goes13_visible_shortwaveIR_Wolf_Galapagos_anim.gif)
![GOES-13 10.7 µm IR channel images [click to play animation]](https://cimss.ssec.wisc.edu/satellite-blog/wp-content/uploads/sites/5/2015/05/150525_goes13_IR_Wolf_Galapagos_anim.gif)
