

0.64 µm, 0.86 µm and 1.61 µm imagery and the computed RGB from GOES-16. 1524 UTC on 15 March 2017 (Click to enlarge)
The GOES-16 data posted on this page are preliminary, non-operational data and are undergoing testing.
The ABI on GOES-16 contains 16 Channels, and those channels can be combined into RGB Imagery to highlight features that the individual channels can identify (Click here for general information on RGBs). For example, the ‘Icing RGB’ in AWIPS (also called the ‘Day Land Cloud’ RGB) uses 1.61 µm imagery for the Red component of the RGB, the 0.86 µm for the Green component and the 0.64 µm for the Blue. (This is similar to the oddly-named EUMETSAT ‘Natural Color’ RGB). The toggle above shows the three individual channels, and then the combination in the RGB. A version of the RGB was sent in this Tweet from NWS Lincoln IL.
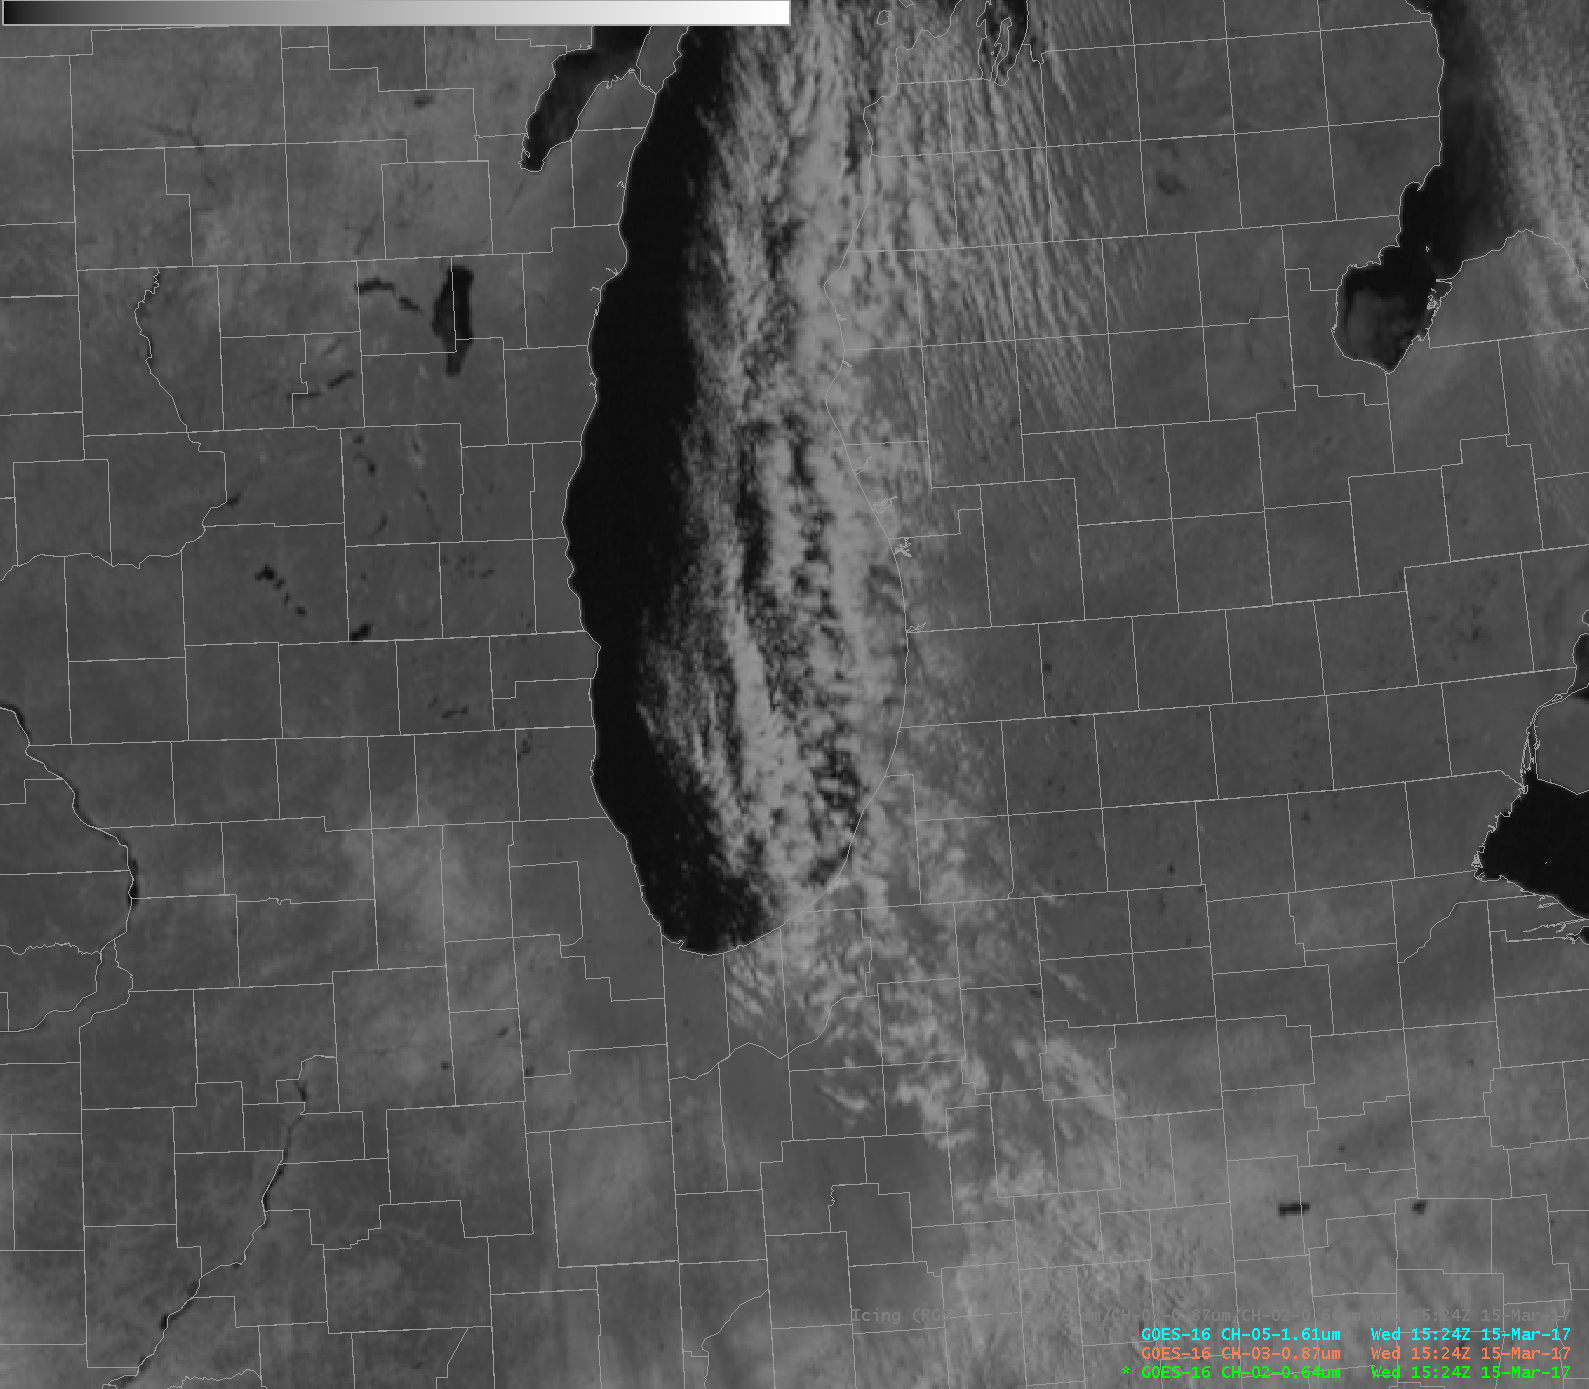
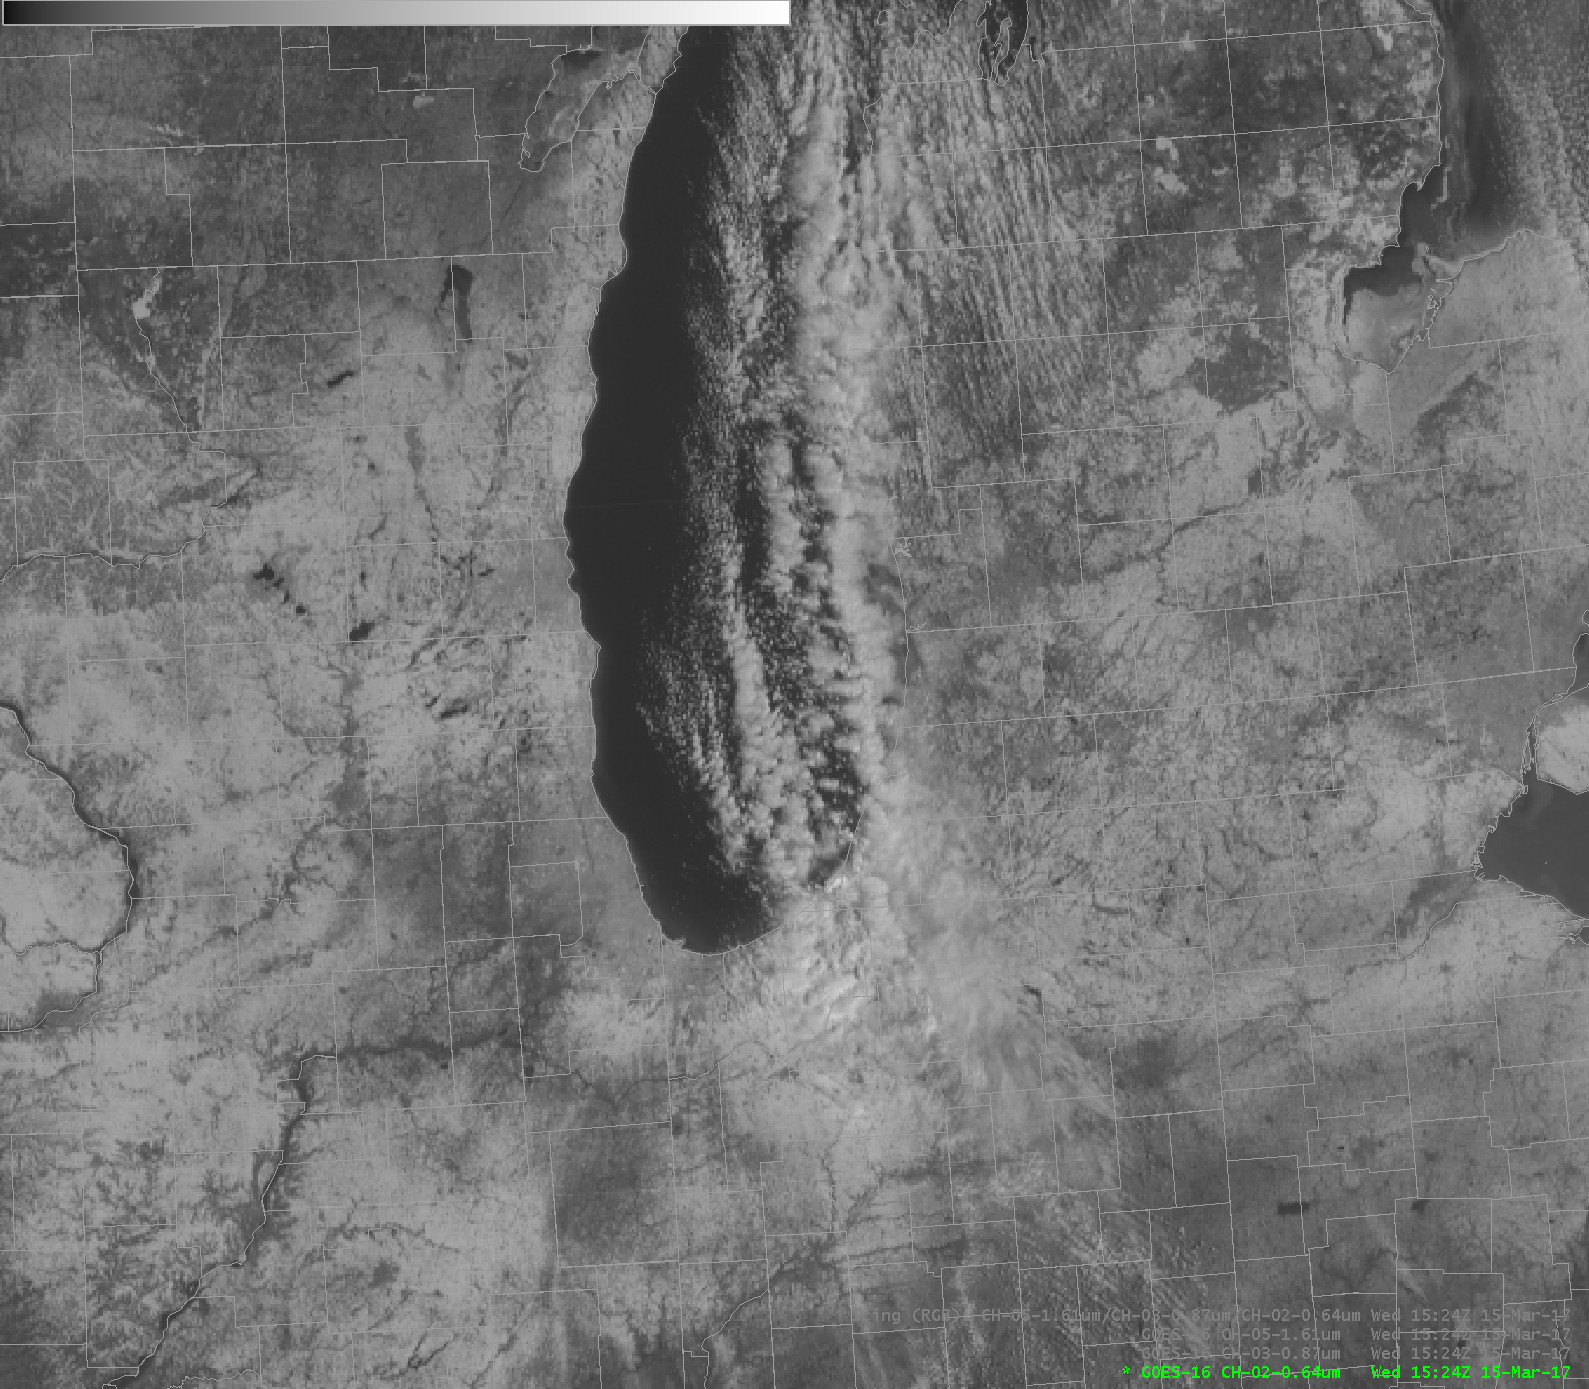
Cyan regions are those with high values from the green component (0.86 µm) and the blue component (0.64 µm) but little from the red (1.61 µm); such regions include snow on the ground, and/or glaciated clouds. Consider, for example, the toggle below between the 0.86 µm and 1.61 µm imagery. Lake Effect clouds are distinct over Lake Michigan in both channels, where they show up against the dark background. Snow on the ground and Water Clouds look very similar at 0.86 µm (or at 0.64 µm, part of the toggle at top of this blog post) and it’s difficult to distinguish clouds from snow over land in a still image. However, the 1.61 µm imagery is much darker in regions of snow (most of the Midwest United States had snow cover on 15 March 2017). Water-based clouds show up distinctly against the darker background in the 1.61 µm imagery, and the Lake Effect clouds can be seen easily over Indiana and Michigan. There is apparently some glaciation in the lake effect clouds over land, however, because they do have a cyan tint to them.
Note how the easternmost lake effect band over Lake Michigan shows evidence of glaciation in the clouds. There is a noticeable change in reflectance between 0.86 µm and 1.61 µm in the toggle below — and that region also shows cyan in the RGB.
0.86 µm and 1.61 µm imagery from GOES-16. 1524 UTC on 15 March 2017 (Click to enlarge)
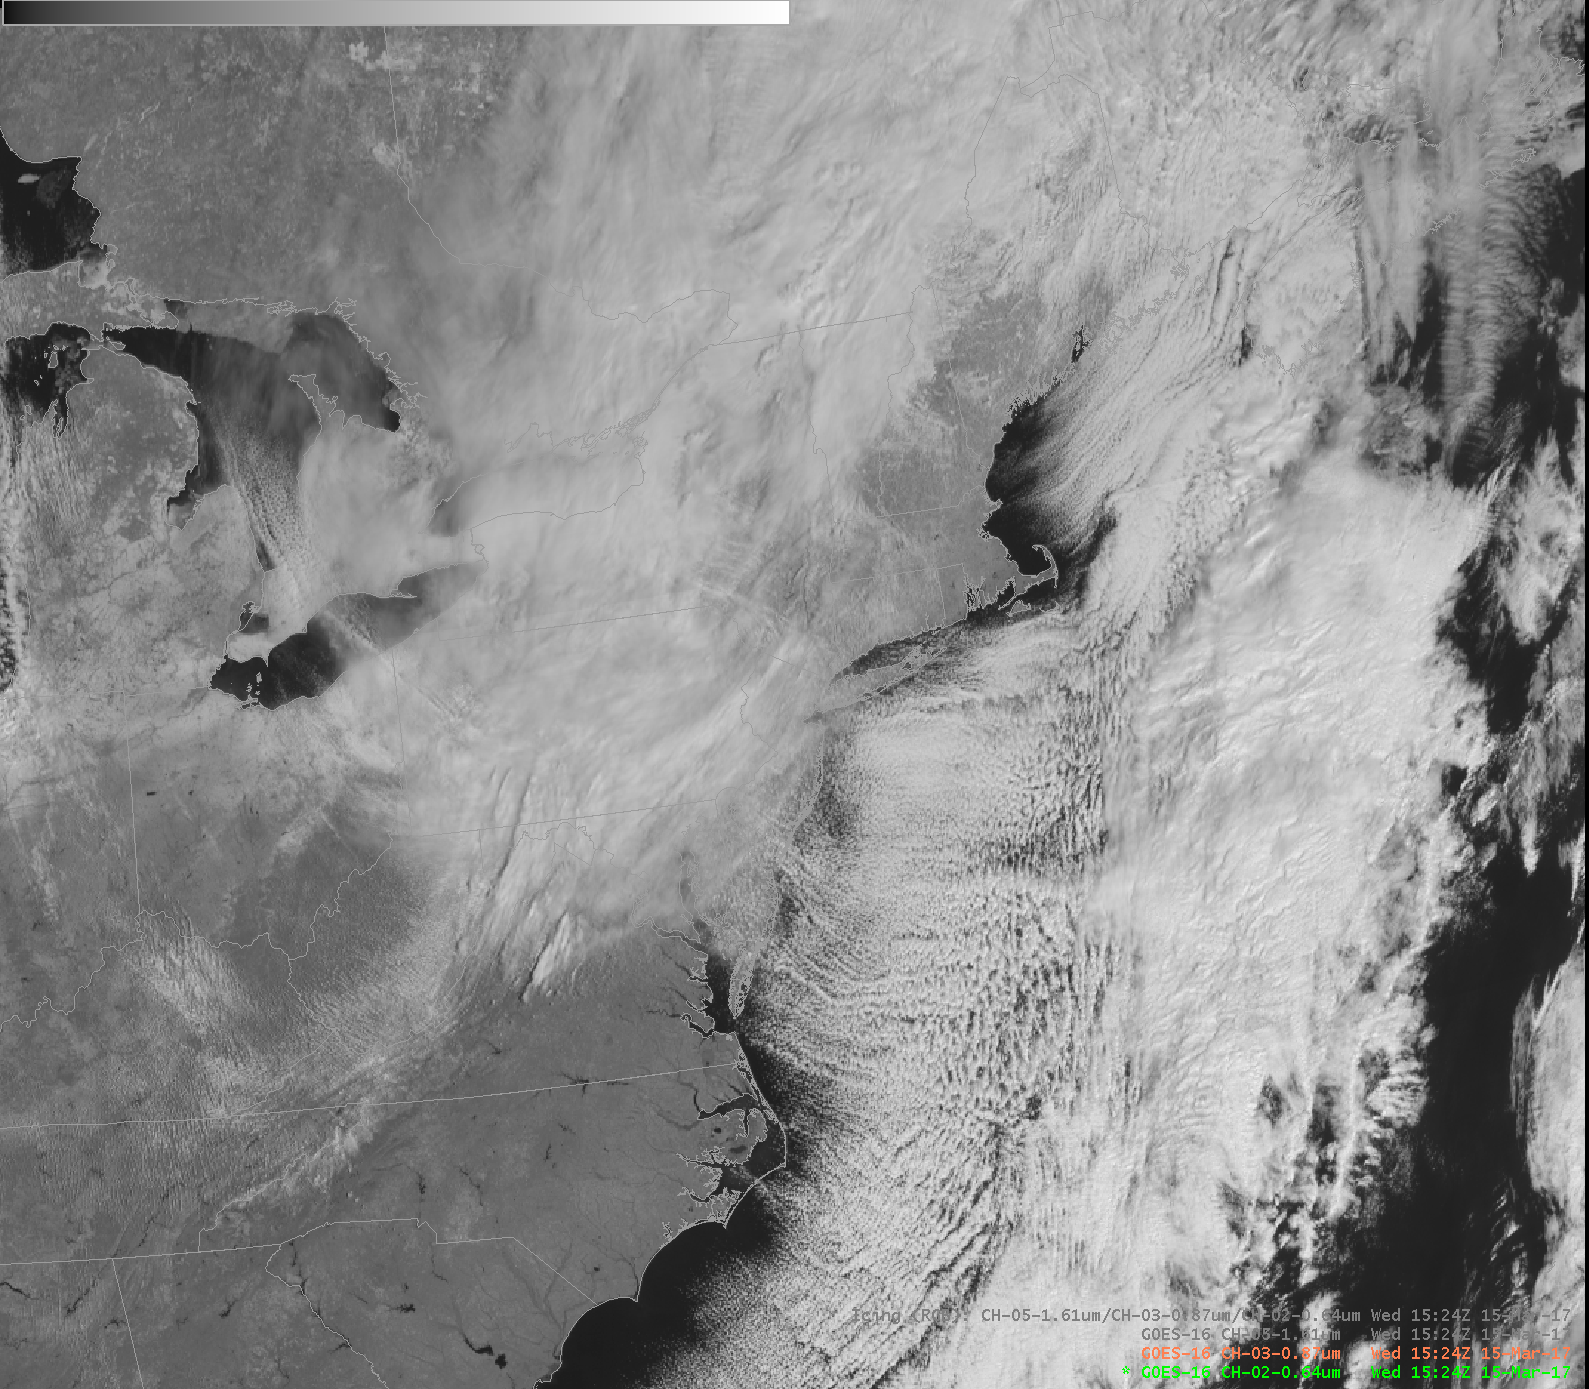
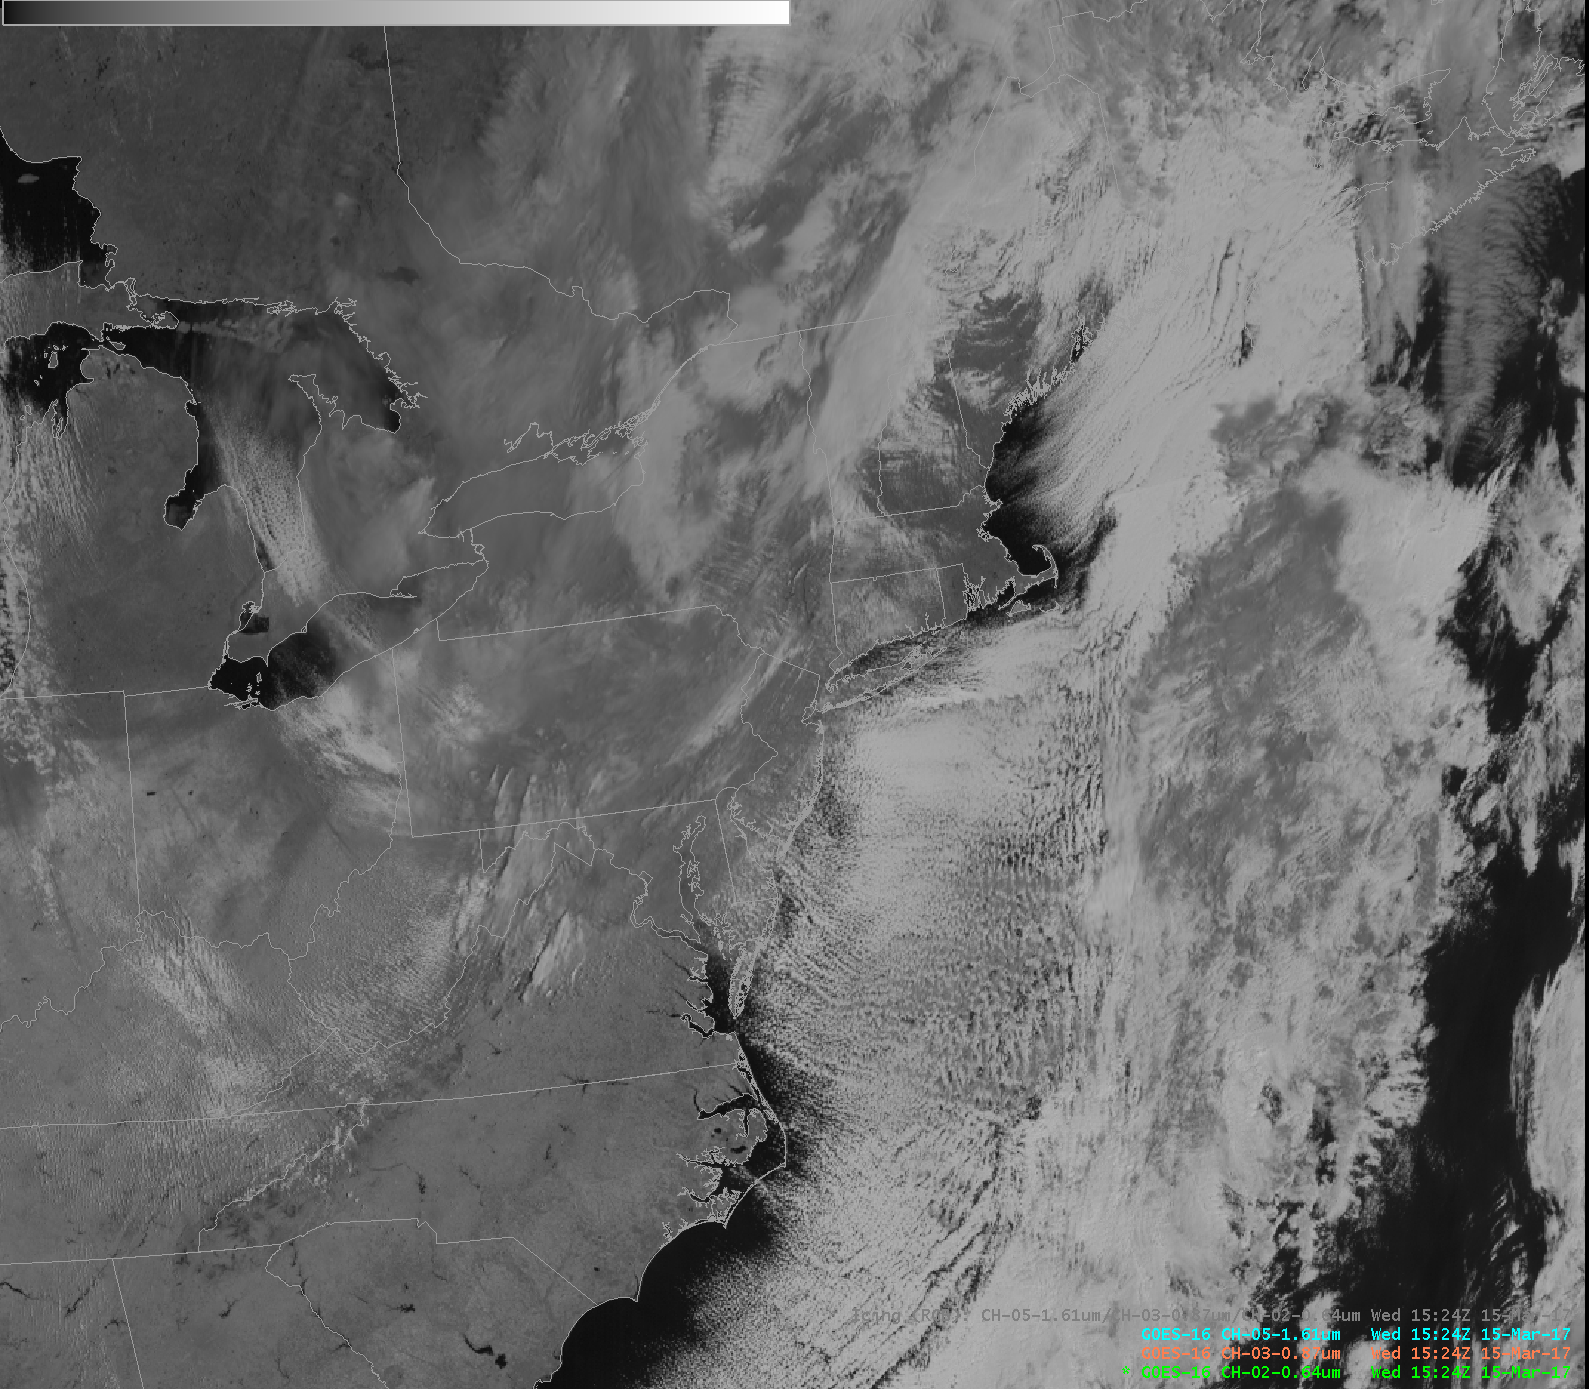
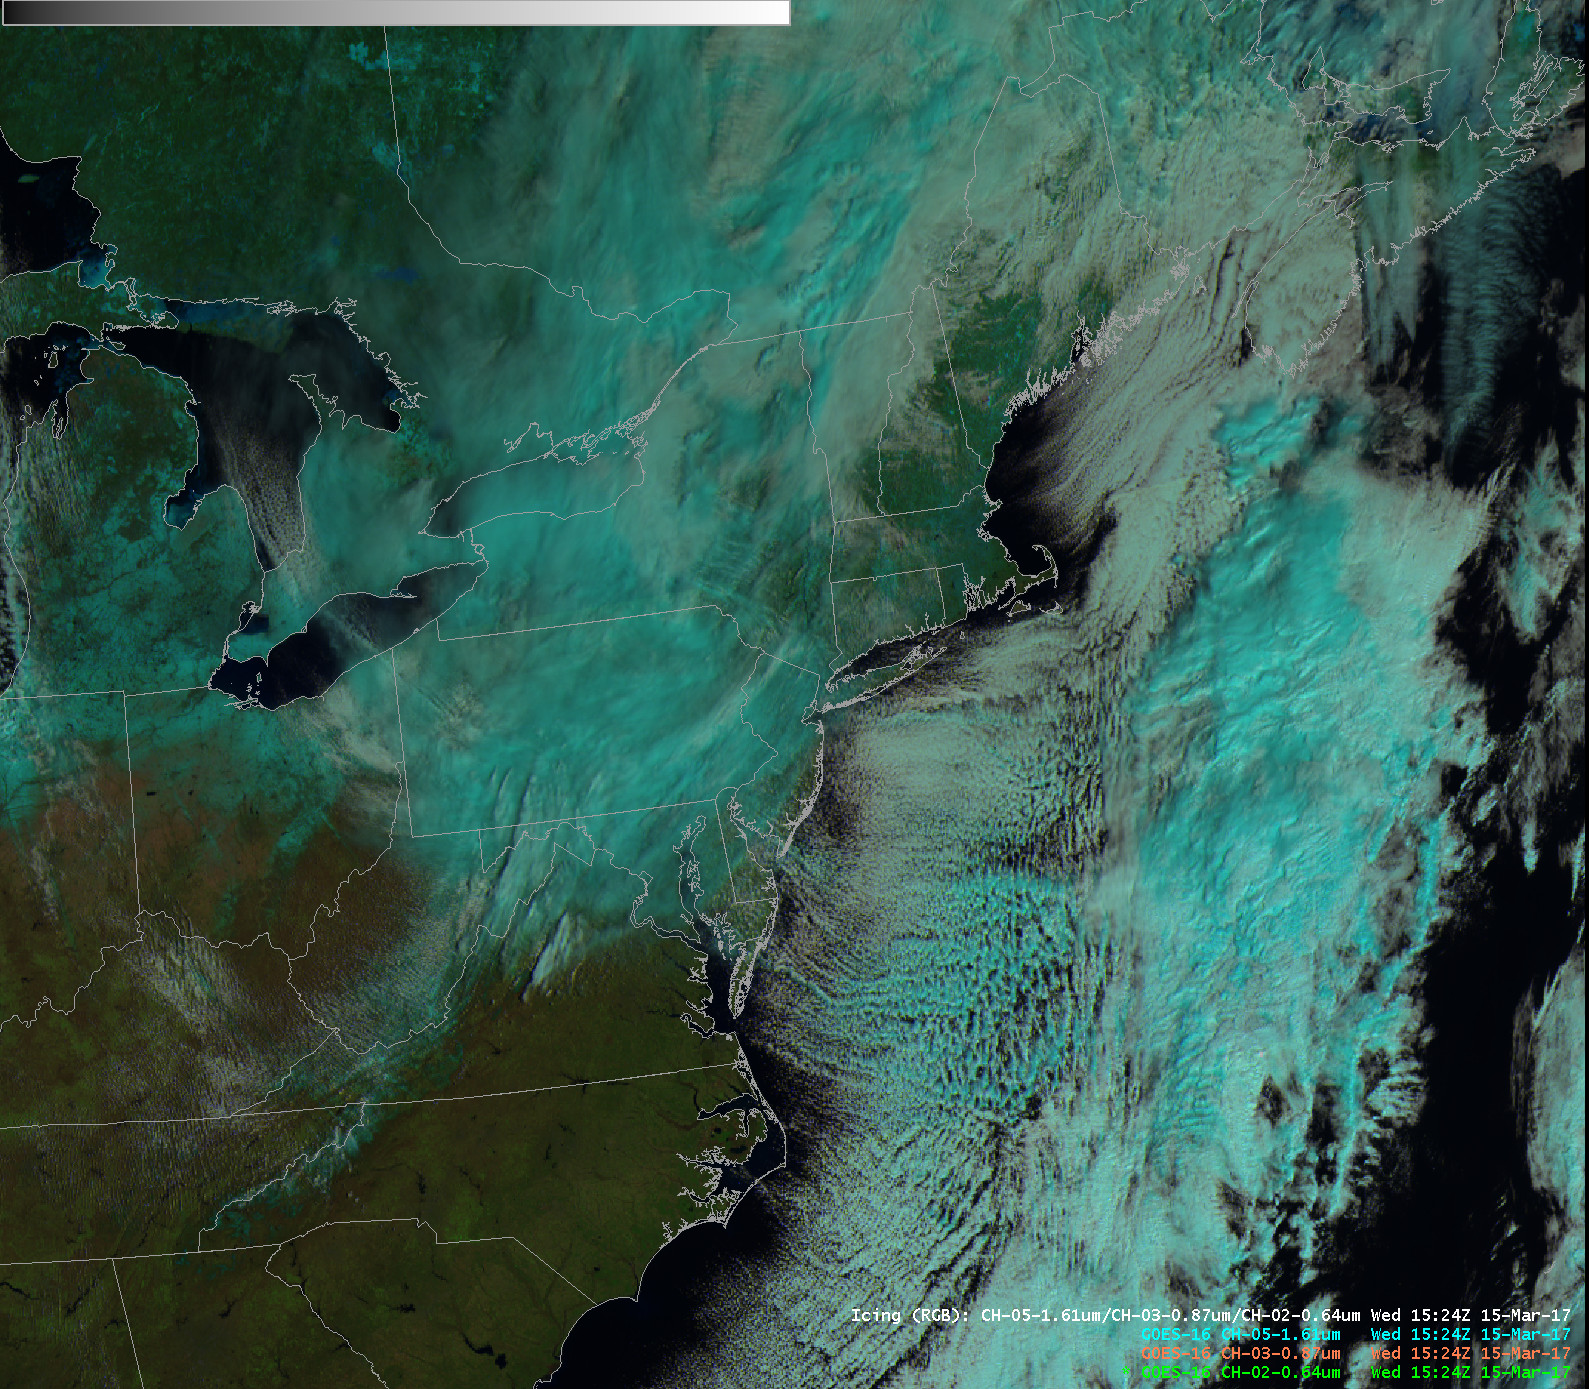
Over the East Coast, this RGB helps better discriminate between low clouds and high. The example below, also from 1524 UTC on 15 March, cycles through the three channels and then shows the RGB. The gradual glaciation of the ‘ocean effect’ clouds over the Atlantic is apparent east of New Jersey, as is the glaciation of some of the clouds in the north-south frontal band offshore. Low clouds are bright in all three channels (0.64 µm, 0.86 µm and 1.61 µm) and therefore appear white-ish in the RGB. Snow on the ground in clear skies is dark in the 1.61 µm imagery and cyan in the RGB.
0.64 µm, 0.86 µm and 1.61 µm imagery and the computed RGB from GOES-16. 1524 UTC on 15 March 2017 (Click to enlarge)
Long-time readers of this blog are familiar with a MODIS-based product that also uses the 1.61 µm channel (in the green and blue) and the visible channel in the red to produce a Snow RGB that has Red snow and cirrus clouds, as shown in this figure from this recent blog post. The key channel for snow-detecting or cirrus-detecting RGBs is the 1.61 µm Channel because ice crystals strongly absorb radiation at that wavelength, reducing the solar reflectance.
Fact sheets are available on the 0.64 µm, 0.86 µm and 1.61 µm Channels on ABI.
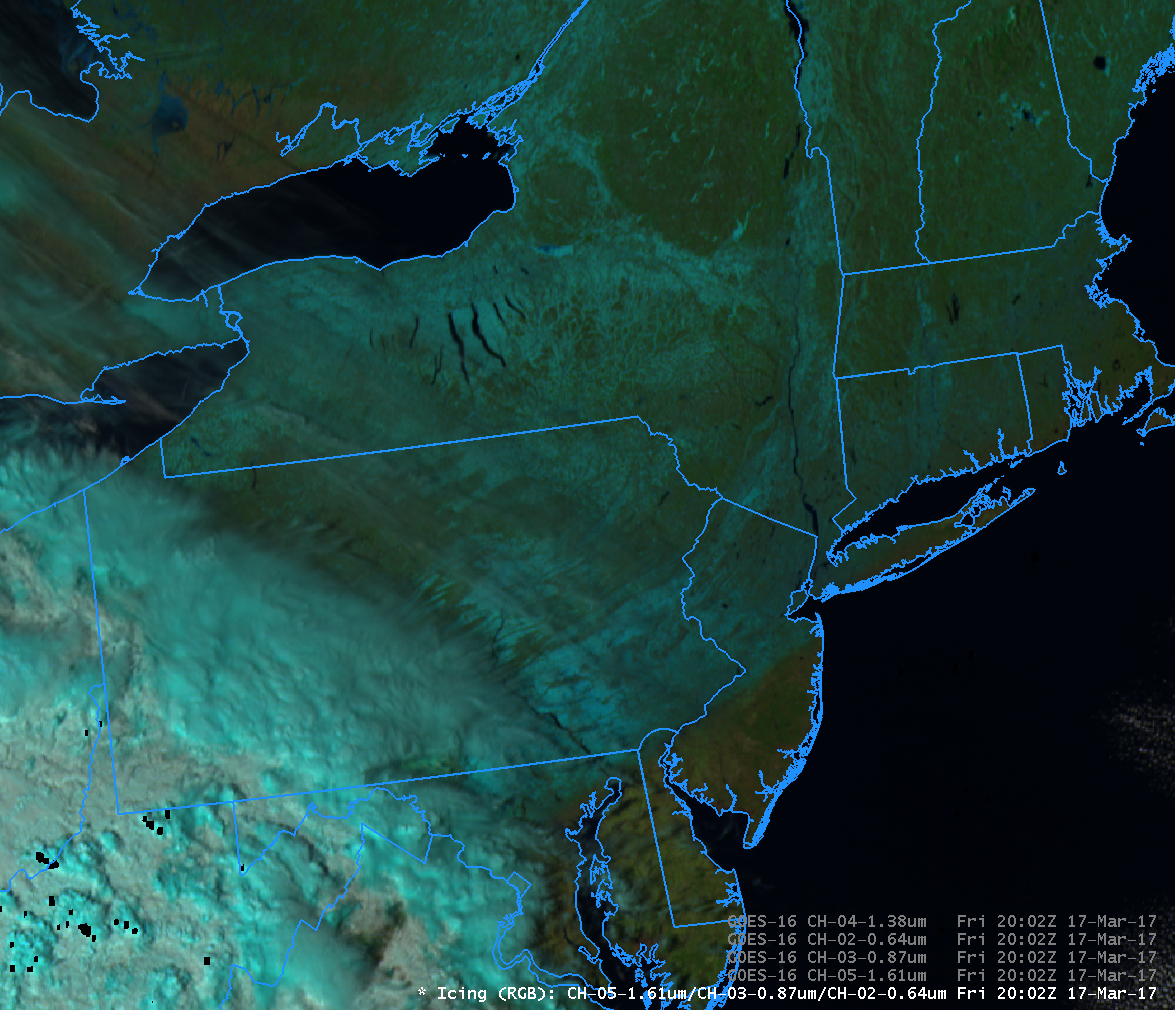
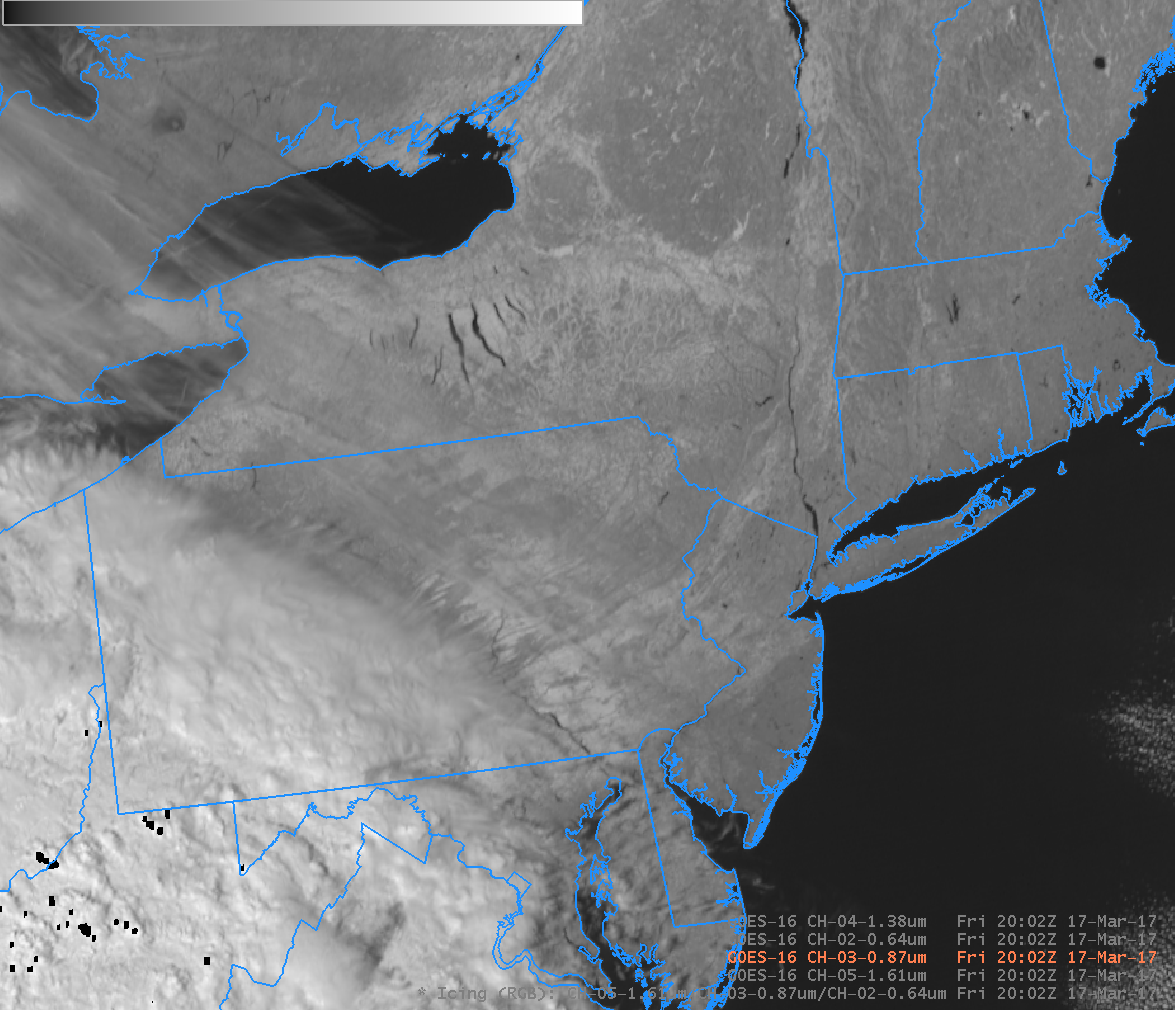
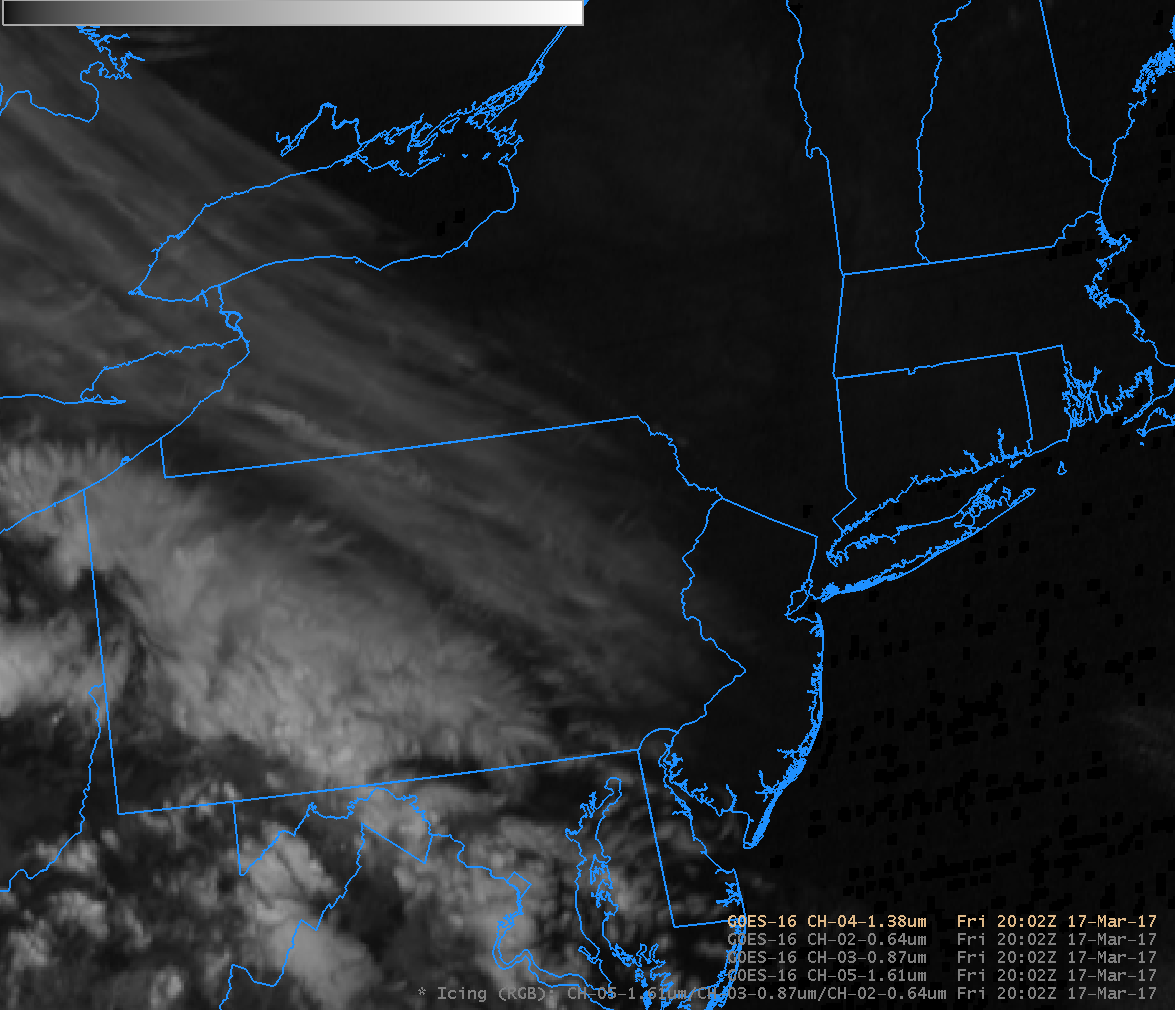
Icing RGB at 2002 UTC on 17 March 2017 (Click to enlarge)
The red visible (0.64 µm), veggie band (0.86 µm), snow/ice channel (1.61 µm) and RGB, above, gave information about snowcover in the Northeast in the wake of the strong winter storm on 13-15 March. The demarcation between snow and no snow is particularly apparent in central New Jersey. Note snow/land discrimination in the Veggie Band is reduced compared to the visible (click here for a toggle between the two channels) — because of very strong surface reflectance over bare ground. There are northwest-to-southeast streaks in the RGB imagery from southwestern Ontario into northeastern Pennsylvania. These are present because of cirrus clouds as highlighted by the Cirrus Channel at 1.38 µm. The RGB is also able to distinguish between low clouds over western Pennsylvania, West Virginia and eastern Ohio (that are mostly white in the RGB) and higher ice-laden clouds that are cyan.
AWIPS Note: Visible (0.47 µm and 0.64 µm) and Veggie Band (0.86 µm) imagery can show missing data in regions of high reflectance near solar Noon, because albedo values then can exceed 1. When those bands are then used in RGBs, the missing data points are apparent. A fix on this to allow an albedo >1 is in progress.
View only this post Read Less
![GOES-16 Visible (0.64 µm) images, with hourly surface reports [click to play animation]](https://cimss.ssec.wisc.edu/satellite-blog/wp-content/uploads/sites/5/2017/03/170312_goes16_visible_Lake_Michigan_mesovortex_anim.gif)
![GOES-16 Visible (0.64 µm) images, with hourly surface reports [click to play animation]](https://cimss.ssec.wisc.edu/satellite-blog/wp-content/uploads/sites/5/2017/03/170312_goes16_visible_meso_sector_Lake_Michigan_mesovortex_anim.gif)
![Time series plot of South Haven, Michigan surface observations [click to enlarge]](https://cimss.ssec.wisc.edu/satellite-blog/wp-content/uploads/sites/5/2017/03/170312_KLWA_SFCMG.GIF)

![GOES-16 Infrared 3.9 µm images on 7 March 2017 [click to enlarge]](https://cimss.ssec.wisc.edu/satellite-blog/wp-content/uploads/sites/5/2017/03/170307_goes16_shortwaveIR_KS_OK_TX_fires_anim.gif)
![GOES-16 0.86 µm (near infrared) and 0.47 µm (visible) imagery from 07 March 2017 [click to enlarge]](https://cimss.ssec.wisc.edu/satellite-blog/wp-content/uploads/sites/5/2017/03/NORMAN_0.47_0.86_2227_07March2017toggle.gif)
![GOES-16 imagery from 2227 UTC on 07 March 2017. Wavelengths indicated in the image [click to animate]](https://cimss.ssec.wisc.edu/satellite-blog/wp-content/uploads/sites/5/2017/03/StepBands12357_07March_2227anim.gif)
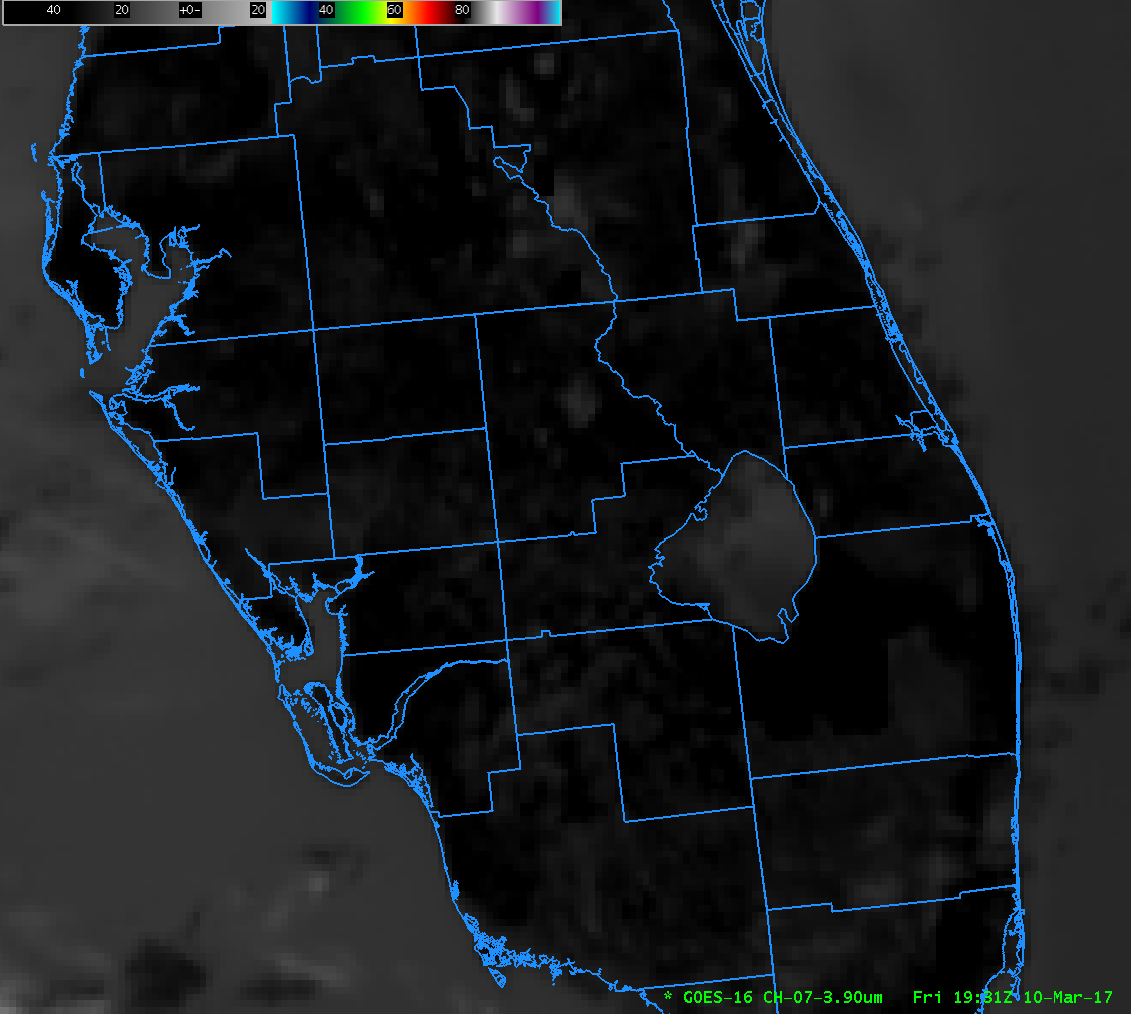
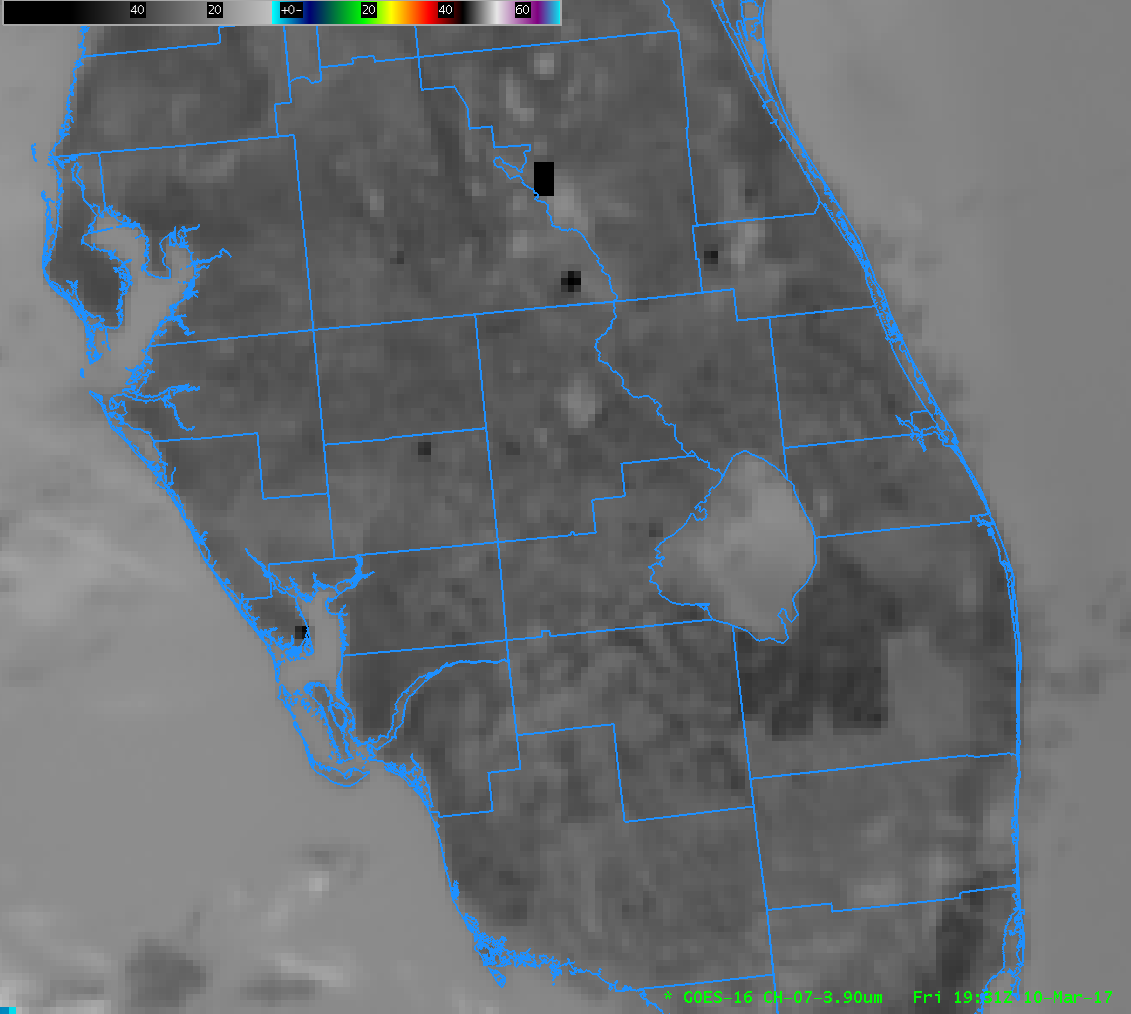
![GOES-16 imagery from 1931 UTC on 10 March 2017. [click to animate]](https://cimss.ssec.wisc.edu/satellite-blog/wp-content/uploads/sites/5/2017/03/G16_1931_10March2017_4BandStep_7_1_2_3toggle.gif)
