GOES-16 data posted on this page are preliminary, non-operational data and are undergoing testing.One of the two GOES-16 Mesoscale Sectors was moved from its default position over the eastern United States and placed over the west coast of the United States on 4 May 2017. This allowed 1-minute imagery of a... Read More
GOES-16 Visible (0.64 µm) from 1245 through 2200 UTC on 4 May 2017 (Click to play mp4 animation)
GOES-16 data posted on this page are preliminary, non-operational data and are undergoing testing.
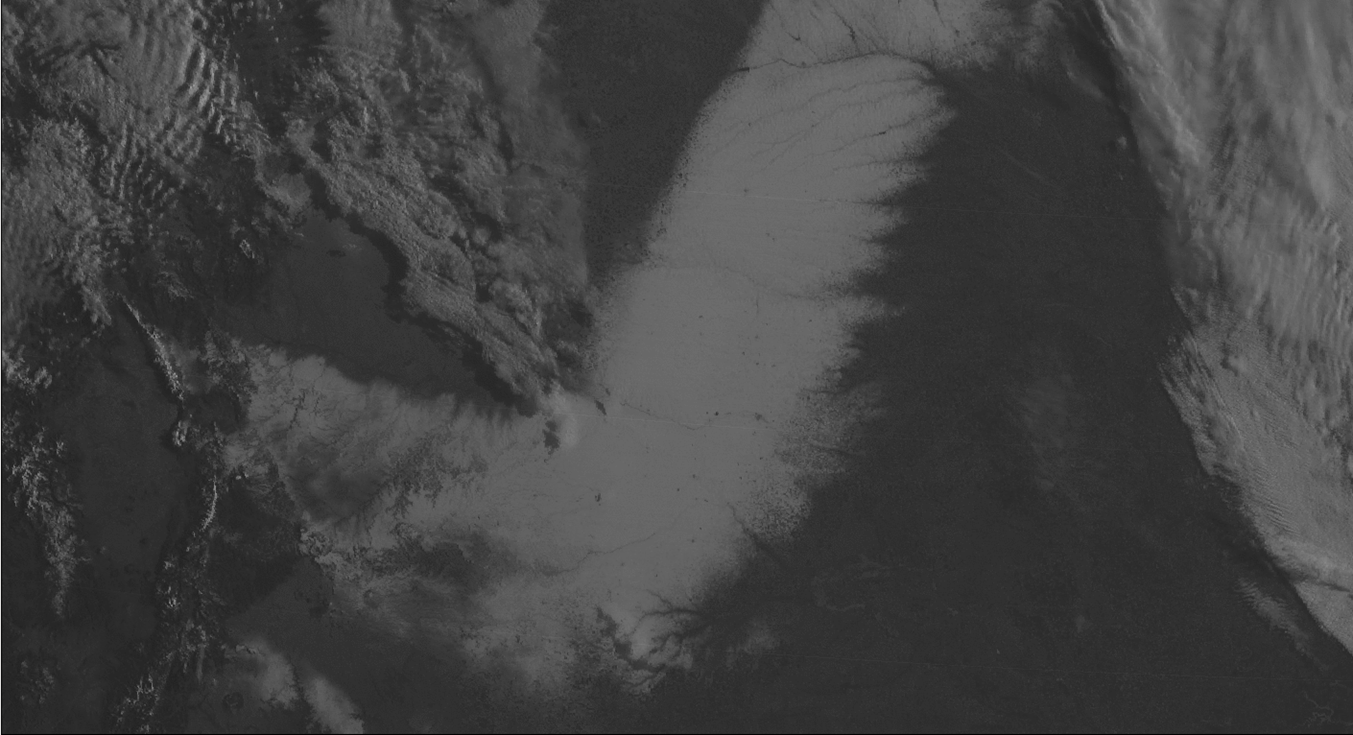
One of the two GOES-16 Mesoscale Sectors was moved from its default position over the eastern United States and placed over the west coast of the United States on 4 May 2017. This allowed 1-minute imagery of a small-scale coastal eddy between Cape Mendocino and Pt. St. George near Crescent City, above, and an associated coastal jet. (Click here to play 300-meg Animated Gif; alternatively, this animation shows the eddy from 1600-1900 UTC as displayed in AWIPS (courtesy Dan Miller, WFO DLH))
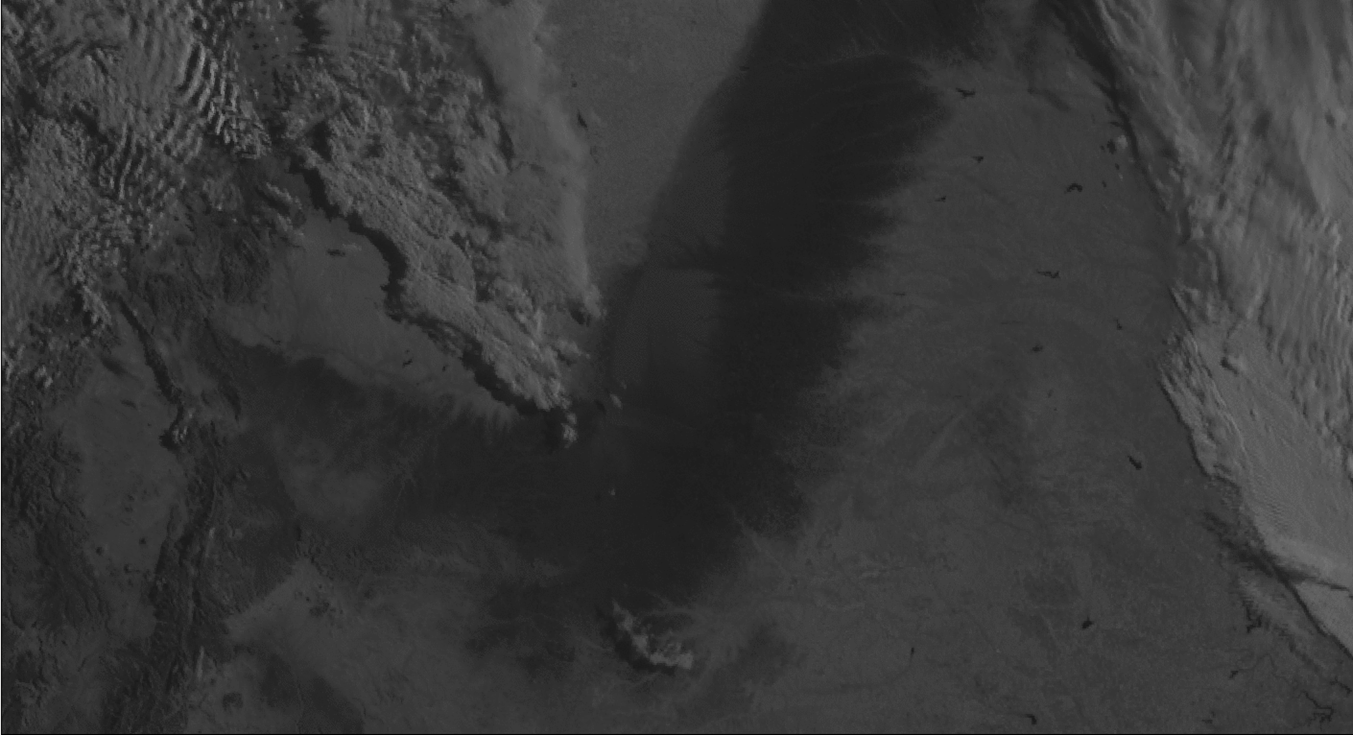
A zoomed-in Visible animation of the coastal eddy is shown below; NWS Eureka described it as “one of the best examples of these coastal eddies seen in quite a while”.
GOES-16 Visible (0.64 µm) images, with hourly surface reports plotted in yellow (Click to animate)
GOES-16 Visible 0.64 µm imagery is able to capture not only the eddy, but also the northerly low-level jet that develops off the coast of Cape Mendocino, swiftly moving clouds southward around that feature. A small eddy also develops south of Cape Mendocino. Note also the abundance of cirrus clouds flowing northward along the coast.
The dimensions of this eddy are approximately 70 km in the along-shore direction and 55 km perpendicular to the shore, yet GOES-16 is able to capture and resolve many small-scale cloud bands. The small cloud band streaming south around Cape Mendocino, for example, is only about 6 km wide and is well-resolved; if GOES-16 becomes GOES-East at 75 W Longitude, this is the type of resolution that can be expected in Salt Lake City.
It should be noted that none of the models (including the hourly RTMA, below) resolved this eddy feature.
Suomi NPP VIIRS Visible (0.64 µm) image, with RTMA surface winds {Click to enlarge)
Thanks to Dan Miller, Science and Operations Officer (SOO) in Duluth for calling this awesome feature to our attention!
View only this post
Read Less
![Himawari-8 Infrared Window (10.4 µm) images [click to play MP4 animation]](https://cimss.ssec.wisc.edu/satellite-blog/wp-content/uploads/sites/5/2017/05/960x1280_AHIM08_B13_HIM08_IR_DONNA_03-06MAY2017_2017123_180000_0001PANEL.GIF)
![Himawari-8 Infrared Window (10.4 µm) images [click to play MP4 animation]](https://cimss.ssec.wisc.edu/satellite-blog/wp-content/uploads/sites/5/2017/05/960x1280_AHIM08_B13_HIM08_IR_DONNA_07MAY2017_2017127_121000_0001PANEL.GIF)
![GMI Microwave (85 GHz) and Himawari-8 Infrared Window (10.4 µm) images [click to enlarge]](https://cimss.ssec.wisc.edu/satellite-blog/wp-content/uploads/sites/5/2017/05/170507_1400utc_himawari8_infrared_GMI_microwave_Cyclone_Donna_anim.gif)
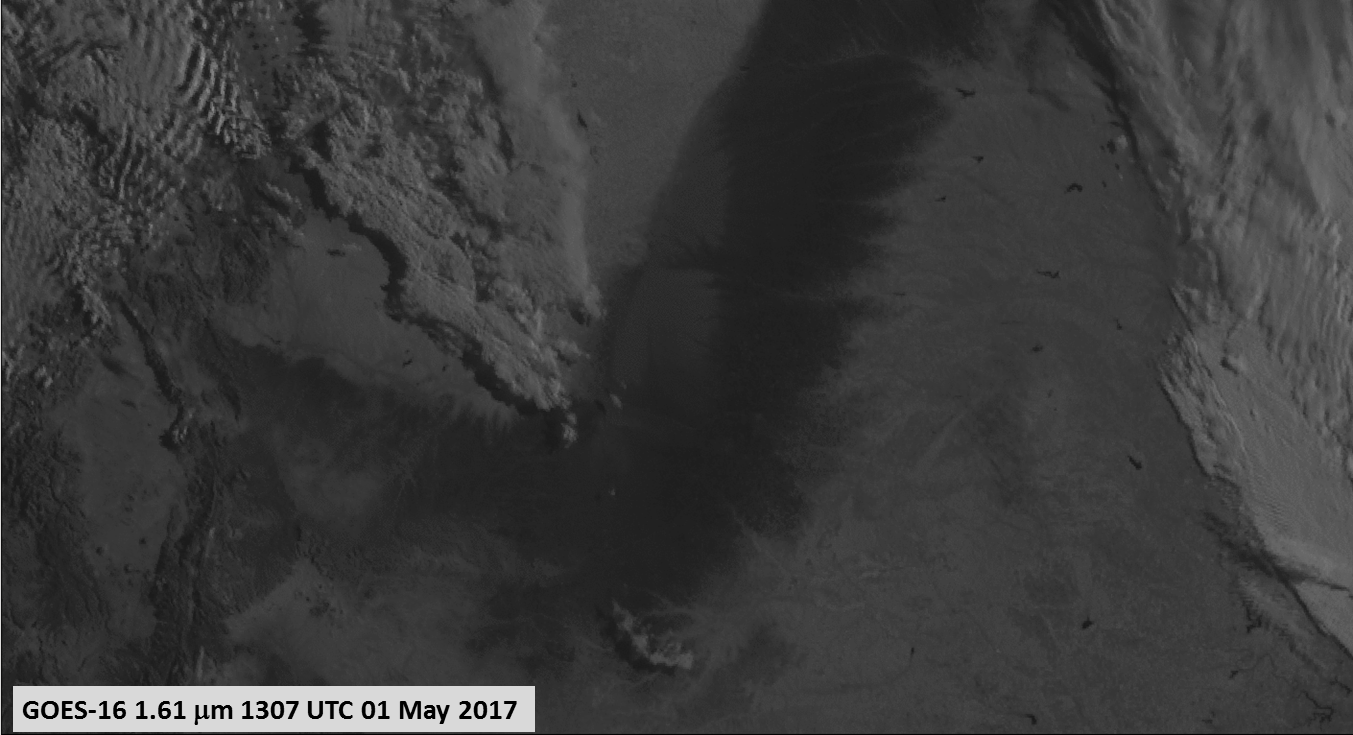
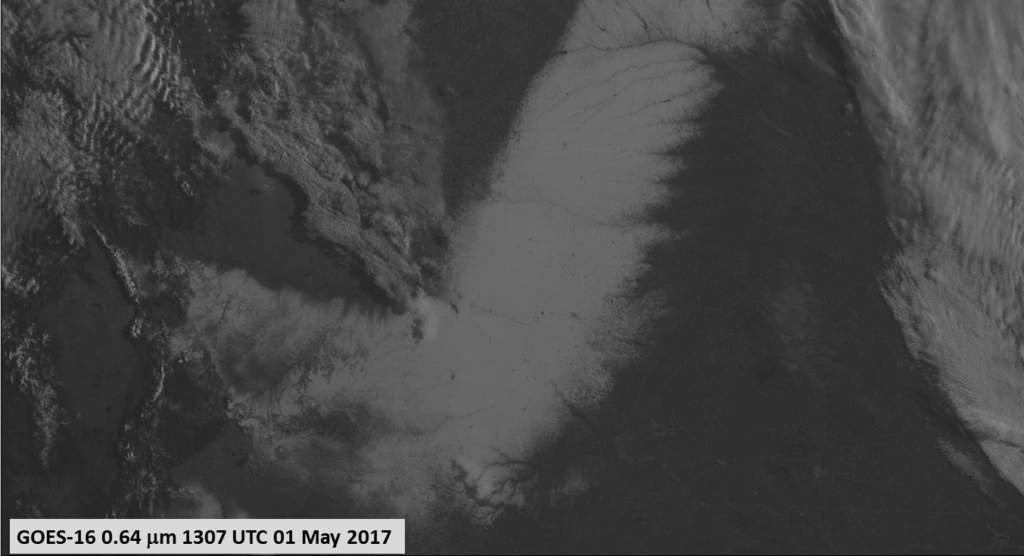

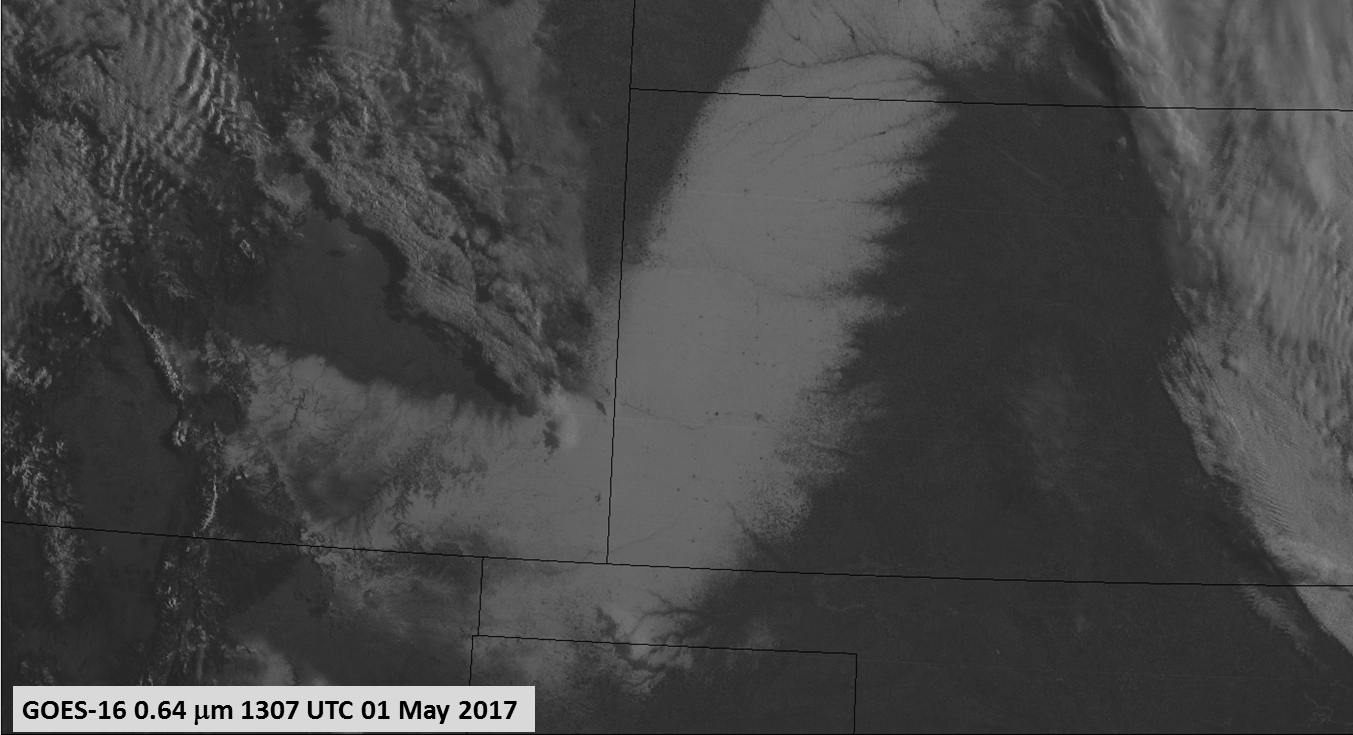
![GOES-16 Visible (0.64 µm, left) and Snow/Ice (1.61 µm, right) images [click to animate]](https://cimss.ssec.wisc.edu/satellite-blog/wp-content/uploads/sites/5/2017/05/170501_goes16_visible_snow-ice_Plains_snowmelt_anim.gif)
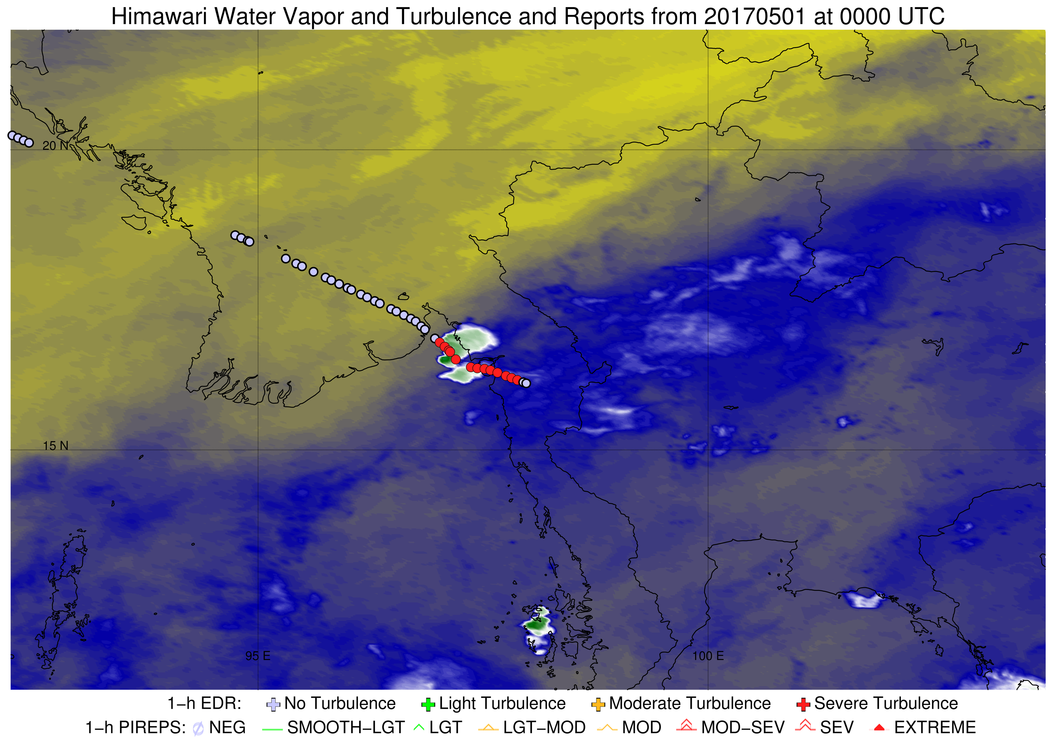
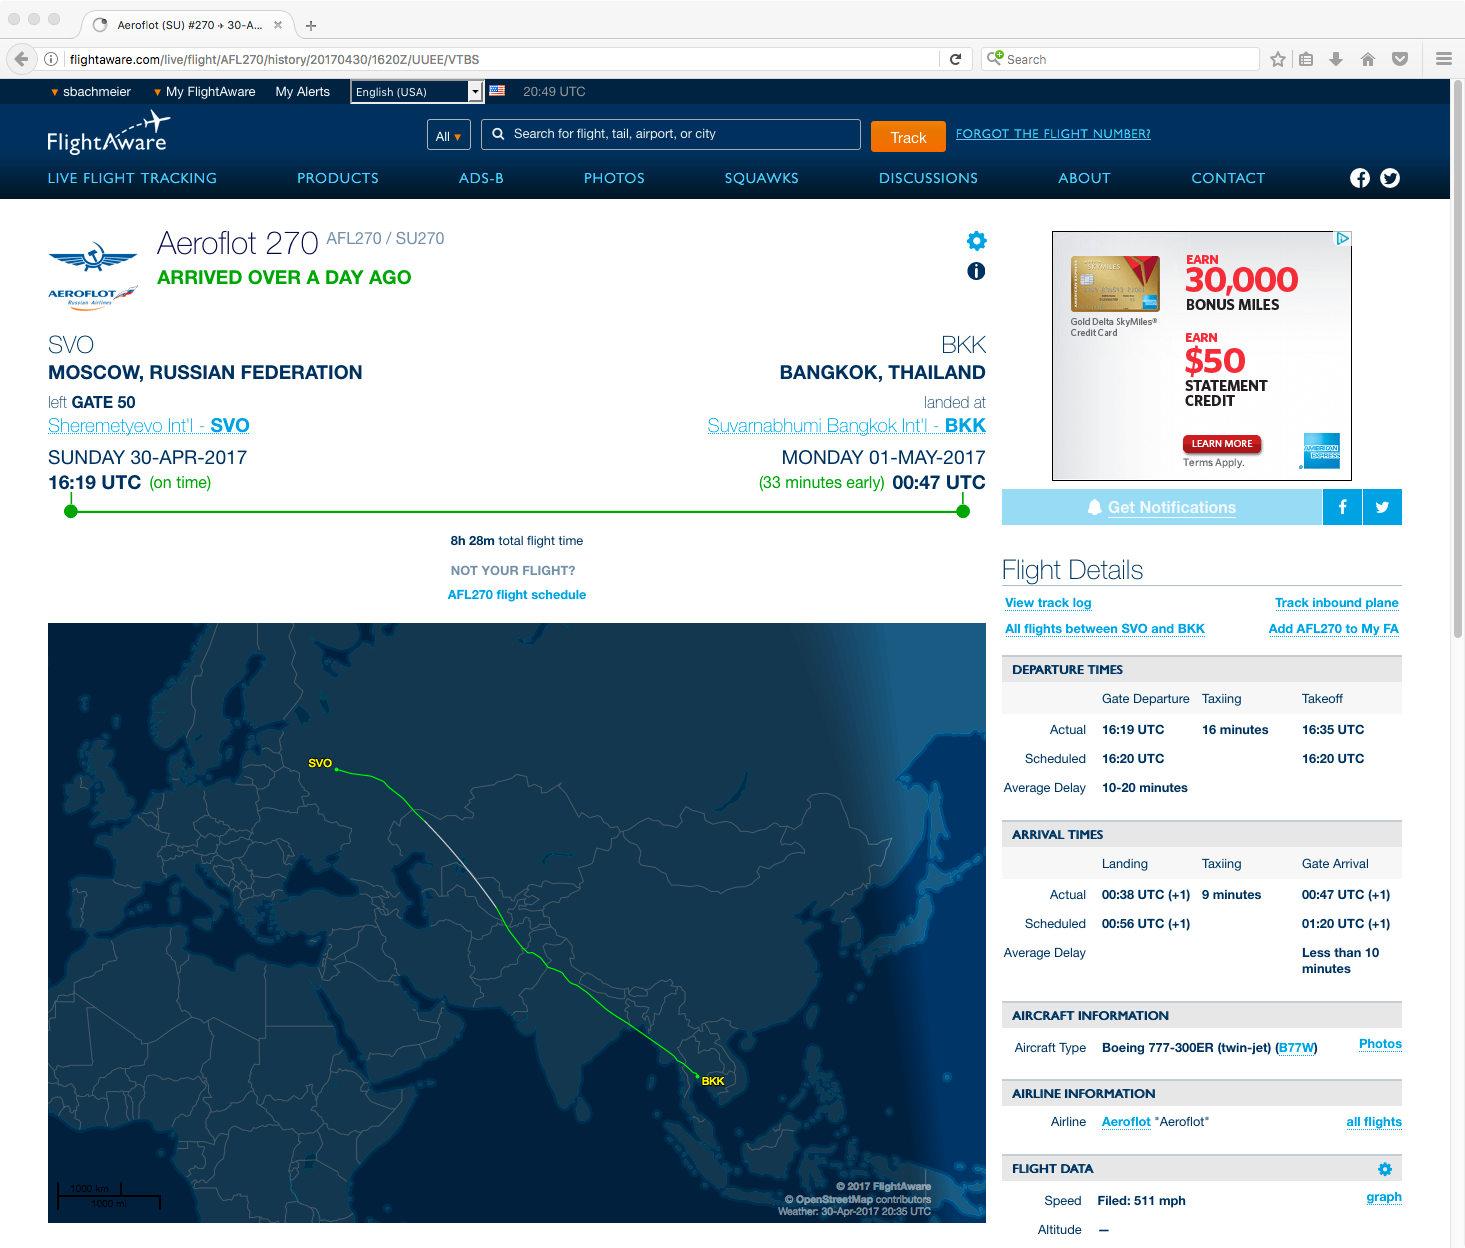
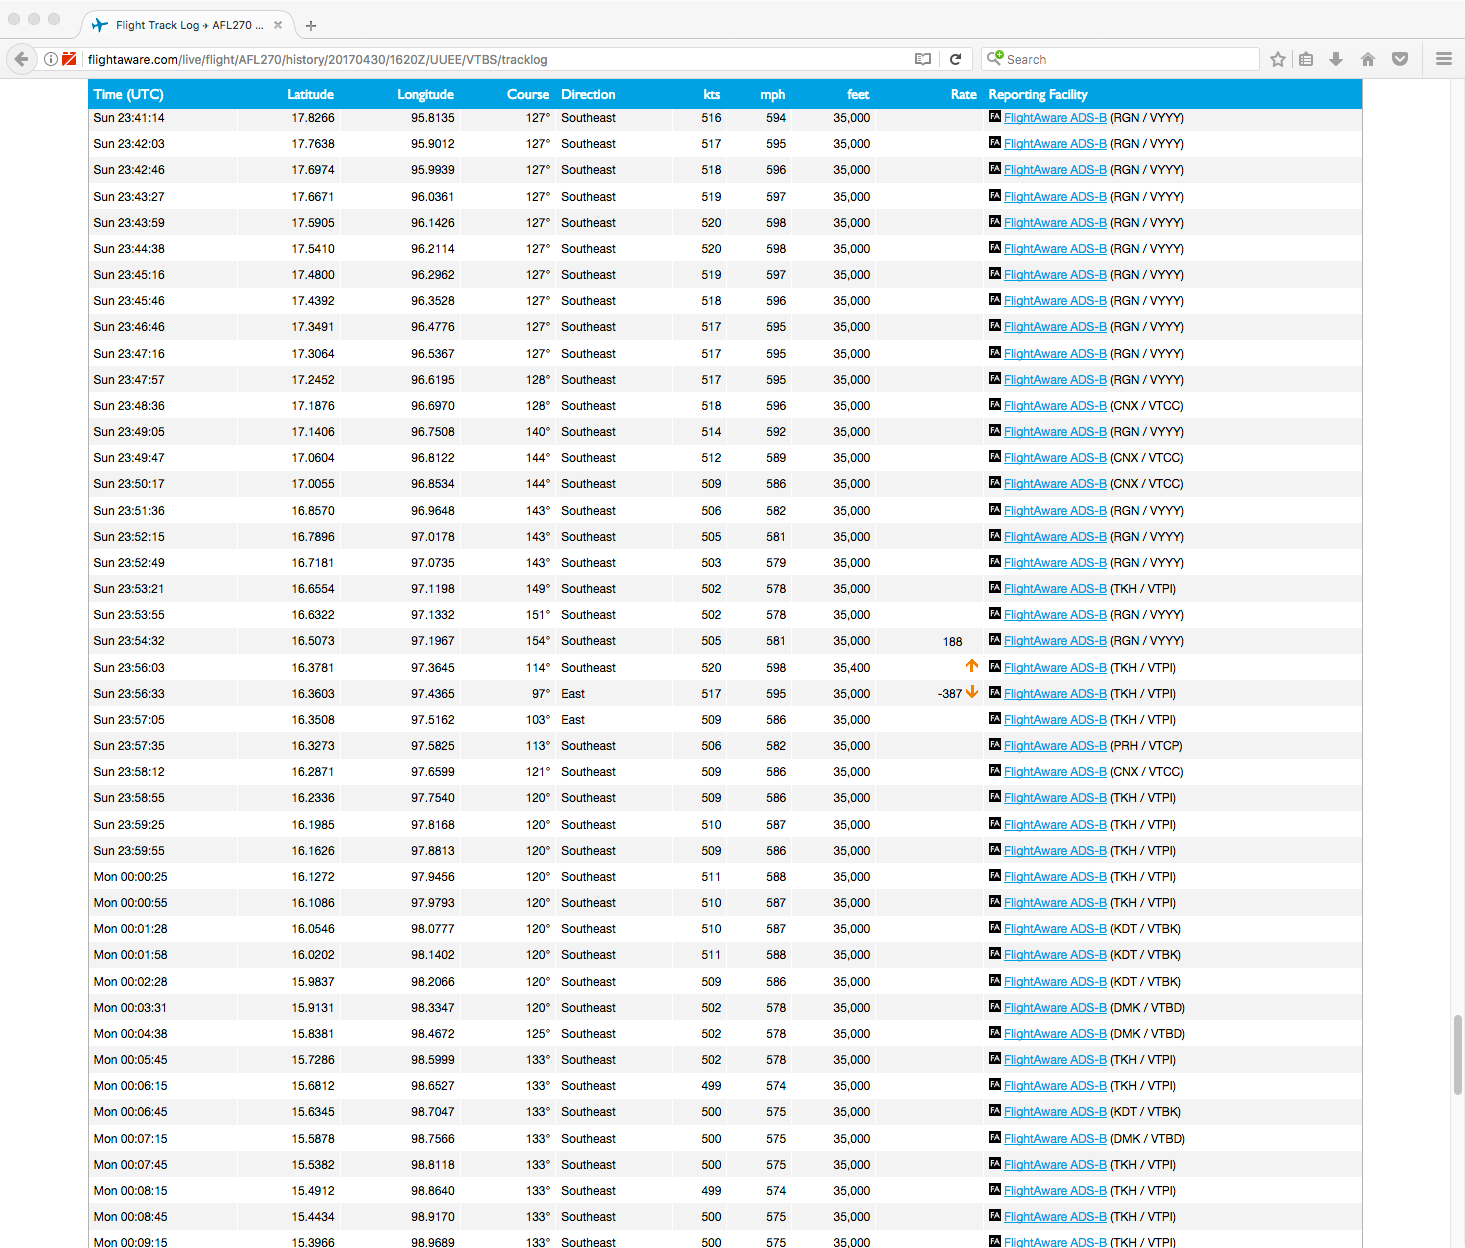
![Himawari-8 Water Vapor (6.9 µm) images, with plots of turbulence intensity along the flight path [click to enlarge]](https://cimss.ssec.wisc.edu/satellite-blog/wp-content/uploads/sites/5/2017/05/170501_himawari8_water_vapor_Aeroflot_270_turbulence_anim.gif)
![Himawari-8 Visible (0.64 µm, top), Water Vapor (6.9 µm, middle) and Infrared Window (10.4 µm, bottom) images [click to enlarge]](https://cimss.ssec.wisc.edu/satellite-blog/wp-content/uploads/sites/5/2017/05/170501_himawari8_visible_watervapor_infrared_AFL270_severe_turbulence_anim.gif)
