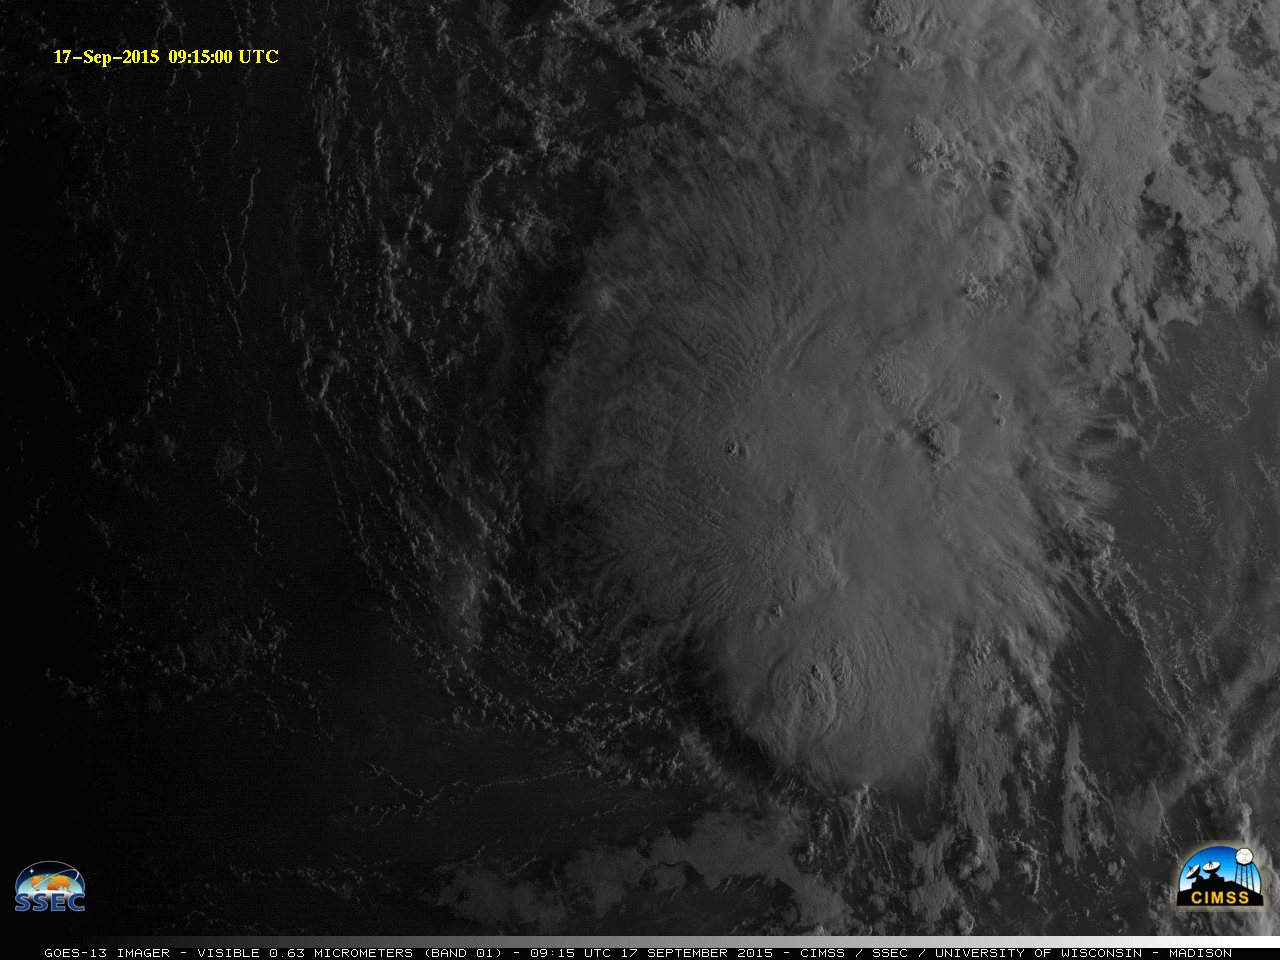
Tropical Depression Nine in the Atlantic Ocean, above, shows characteristics of a heavily sheared storm (longer sunrise-to-sunset animations: gif | mp4). The low-level circulation is displaced south and west of the strongest convection (which is vigorous enough to produce occasional overshooting tops, below, as shown on this page).Metop-B overflew Tropical Depression Nine’s... Read More
![GOES-13 Visible (0.63 µm) images [click to play animation]](https://cimss.ssec.wisc.edu/satellite-blog/wp-content/uploads/sites/5/2015/09/GOES13_VIS_17SEP2015_1615.GIF)
GOES-13 Visible (0.63 µm) images [click to play animation]
Tropical Depression Nine in the Atlantic Ocean, above, shows characteristics of a heavily sheared storm (longer sunrise-to-sunset animations:
gif |
mp4). The low-level circulation is displaced south and west of the strongest convection (which is vigorous enough to produce occasional
overshooting tops, below, as shown on
this page).
![Autodetected Overshooting Tops as a function of time, from GOES-13 data [click to enlarge]](https://cimss.ssec.wisc.edu/satellite-blog/wp-content/uploads/sites/5/2015/09/al092015_PG_OT_line_plot.png)
Autodetected Overshooting Tops as a function of time, from GOES-13 data [click to enlarge]
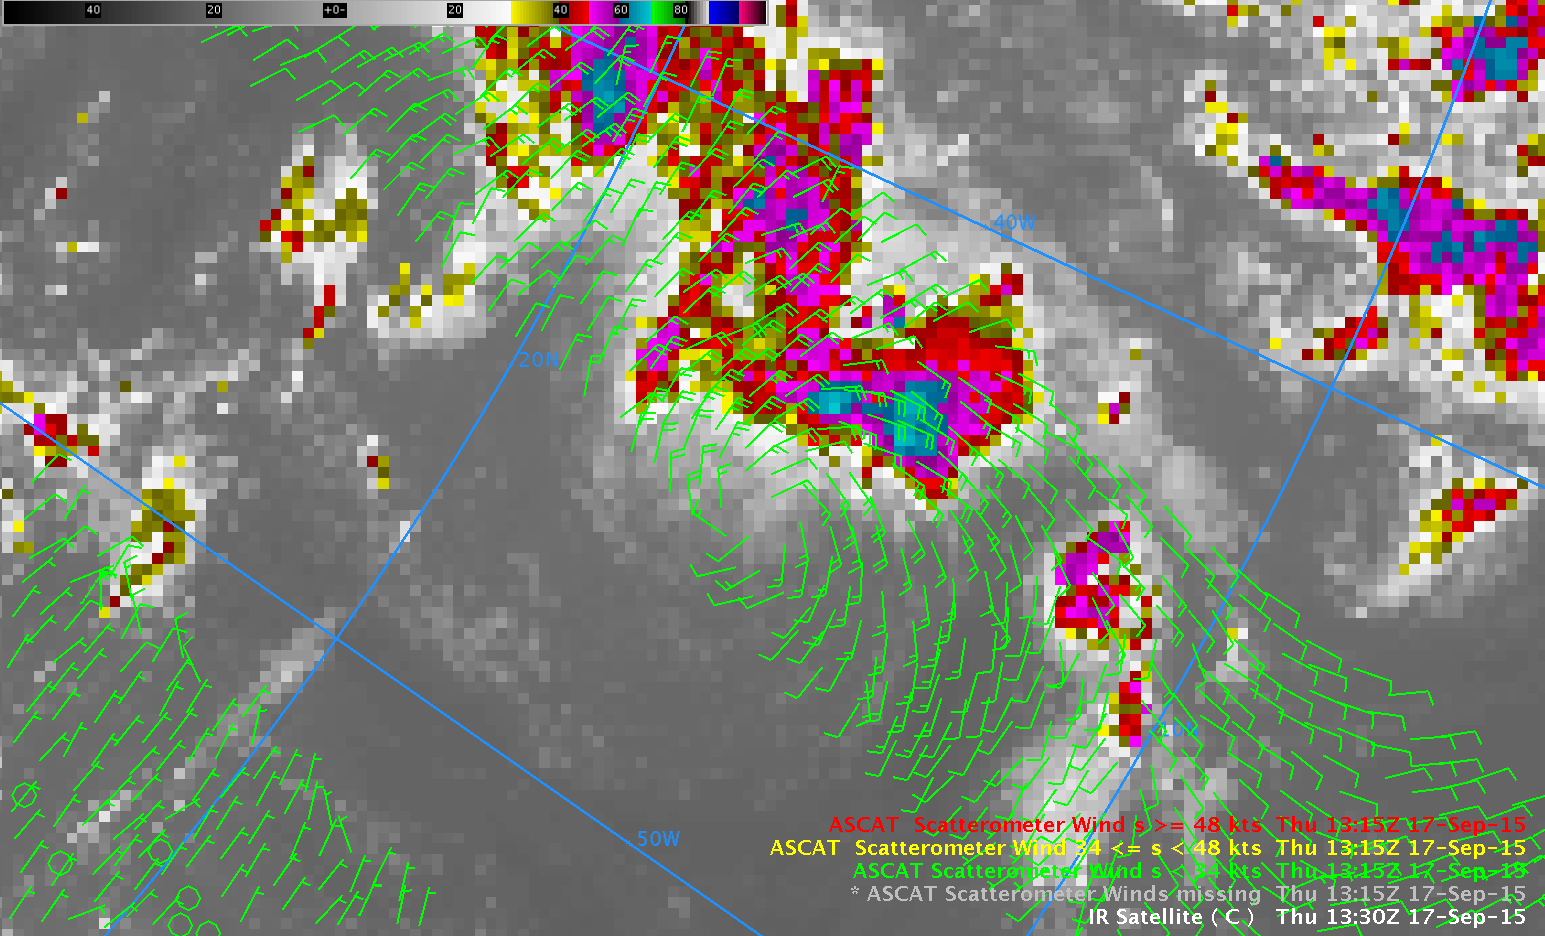
Metop-B overflew Tropical Depression Nine’s circulation just after 1300 UTC on 17 September (Orbital tracks for Metop-B are
here). The image below shows a circulation with 20-30 knot winds displaced to the south and west of cold 10.7 µm brightness temperatures indicating high cloud tops detected by the GOES-13 Imager.
![Metop-B ASCAT winds and GOES-13 10.7 µm Brightness Temperatures, ~1315 UTC [click to enlarge]](https://cimss.ssec.wisc.edu/satellite-blog/wp-content/uploads/sites/5/2015/09/ASCAT_IR_1315UTC_17Sept2015.png)
Metop-B ASCAT winds and GOES-13 10.7 µm Brightness Temperatures, ~1315 UTC [click to enlarge]
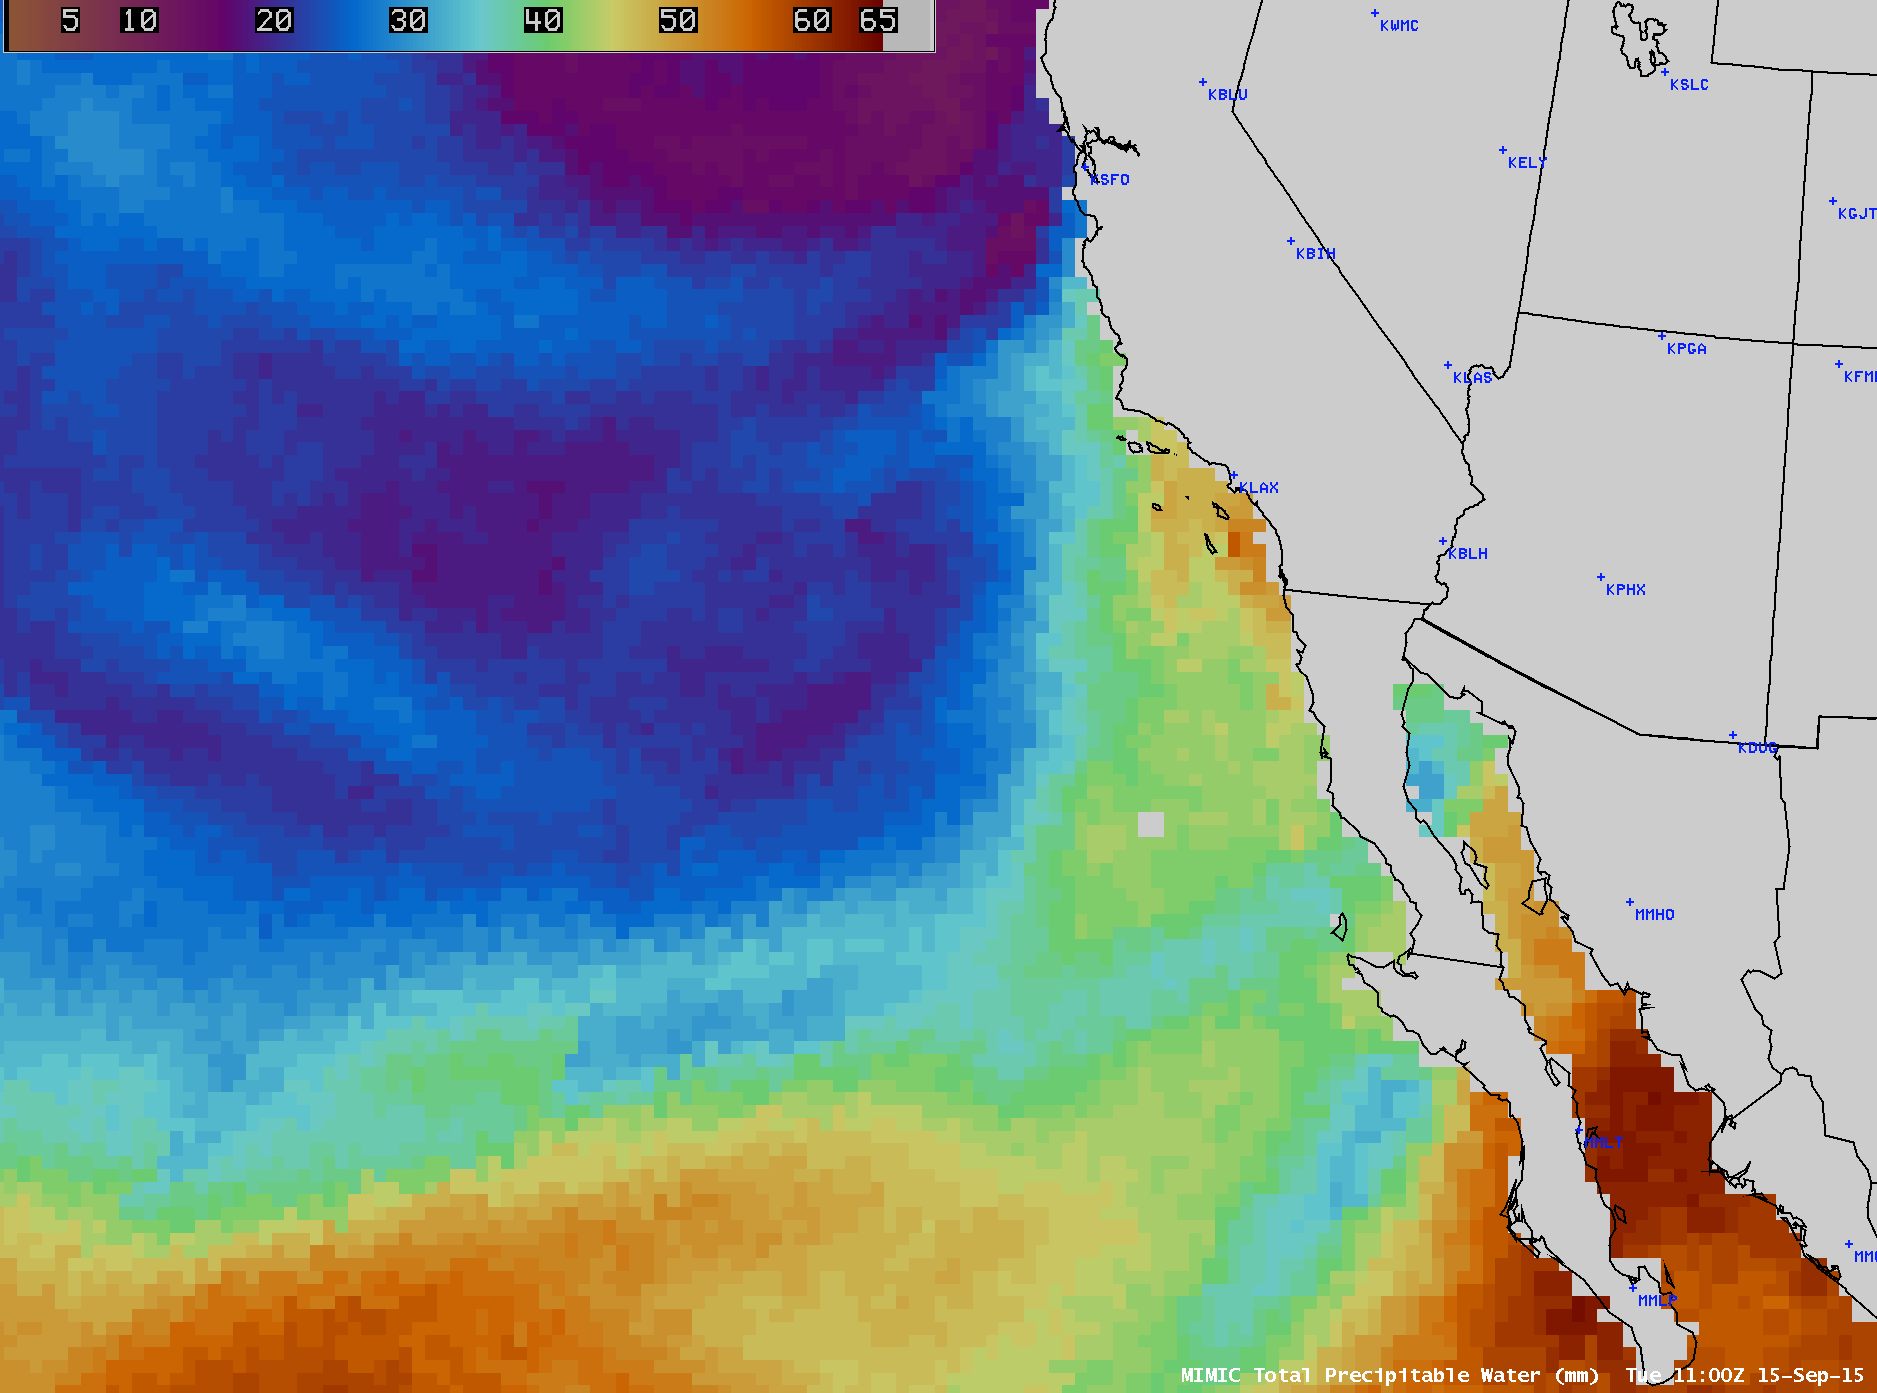
![MIMIC Total Precipitable Water for the 72 hours ending 1400 UTC 17 September 2015 [click to enlarge]](https://cimss.ssec.wisc.edu/satellite-blog/wp-content/uploads/sites/5/2015/09/MIMICTPW_Ending17Sept2015latest72hrs.gif)
MIMIC Total Precipitable Water for the 72 hours ending 1400 UTC 17 September 2015 [click to enlarge]
Total Precipitable Water images from
MIMIC (above) suggest the circulation of Tropical Depression Nine is on the northern edge of deep moisture in the Intertropical Convergence Zone. Its projected path to the north and west is towards dryer air. The projected path (below) does take the storm towards warmer waters; however, it also moves it towards a region of even higher deep-layer wind shear (plots below were taken from the
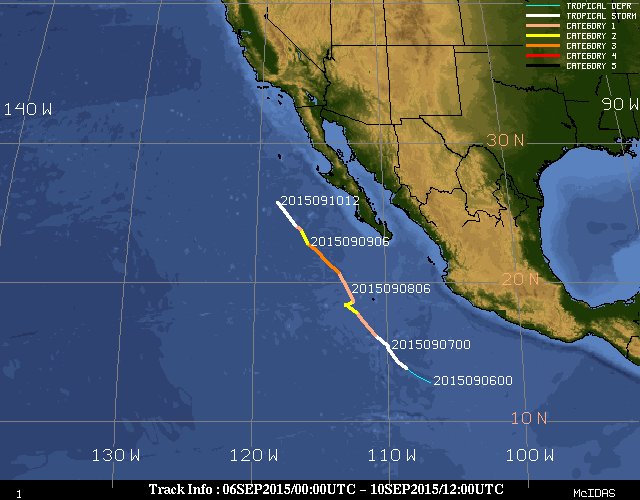
CIMSS Tropical Cyclones site). Only the warmer waters argue that this storm will persist; everything else suggests a struggle to survive. Several tropical cyclones this season have succumbed to wind shear while over the tropical Atlantic. Tropical Depression Nine may add to that total.
![Projected Path of Tropical Depression Nine superimposed on SST and Wind Shear [click to enlarge]](https://cimss.ssec.wisc.edu/satellite-blog/wp-content/uploads/sites/5/2015/09/TD9_Path_SST_Sheartoggle.gif)
Projected Path of Tropical Depression Nine superimposed on SST and Wind Shear [click to enlarge]
View only this post
Read Less
![GOES-13 Visible (0.63 µm) images [click to play animation]](https://cimss.ssec.wisc.edu/satellite-blog/wp-content/uploads/sites/5/2015/09/GOES13_VIS_17SEP2015anim.gif)
![Time series plot of weather conditions for Los Angeles International Airport [click to enlarge]](https://cimss.ssec.wisc.edu/satellite-blog/wp-content/uploads/sites/5/2015/09/150915_KLAX_SFCMG.GIF)
![MIMIC Total Precipitable Water product [click to play animation]](https://cimss.ssec.wisc.edu/satellite-blog/wp-content/uploads/sites/5/2015/09/150906-15_mimic_tpw_anim.gif)
![MIMIC Total Precipitable Water product [click to play animation]](https://cimss.ssec.wisc.edu/satellite-blog/wp-content/uploads/sites/5/2015/09/150915_mimic_tpw_LAX_anim.gif)
![GOES-15 Infrared (10.7 µm) images [click to play animation]](https://cimss.ssec.wisc.edu/satellite-blog/wp-content/uploads/sites/5/2015/09/150915_goes15_ir_LAX_anim.gif)
![Suomi NPP VIIRS Day/Night Band (0.7 µm) image composite [click to enlarge]](https://cimss.ssec.wisc.edu/satellite-blog/wp-content/uploads/sites/5/2015/09/150909_suomi_npp_viirs_dnb_North_America_aurora.jpg)
![Suomi NPP VIIRS Day/Night Band (0.7 µm) image at 0756 UTC [click to enlarge]](https://cimss.ssec.wisc.edu/satellite-blog/wp-content/uploads/sites/5/2015/09/150909_0756utc_viirs_dnb_aurora.png)
![Suomi NPP VIIRS Day/Night Band (0.7 µm) image at 0939 UTC [click to enlarge]](https://cimss.ssec.wisc.edu/satellite-blog/wp-content/uploads/sites/5/2015/09/150909_0939utc_viirs_dnb_aurora.png)
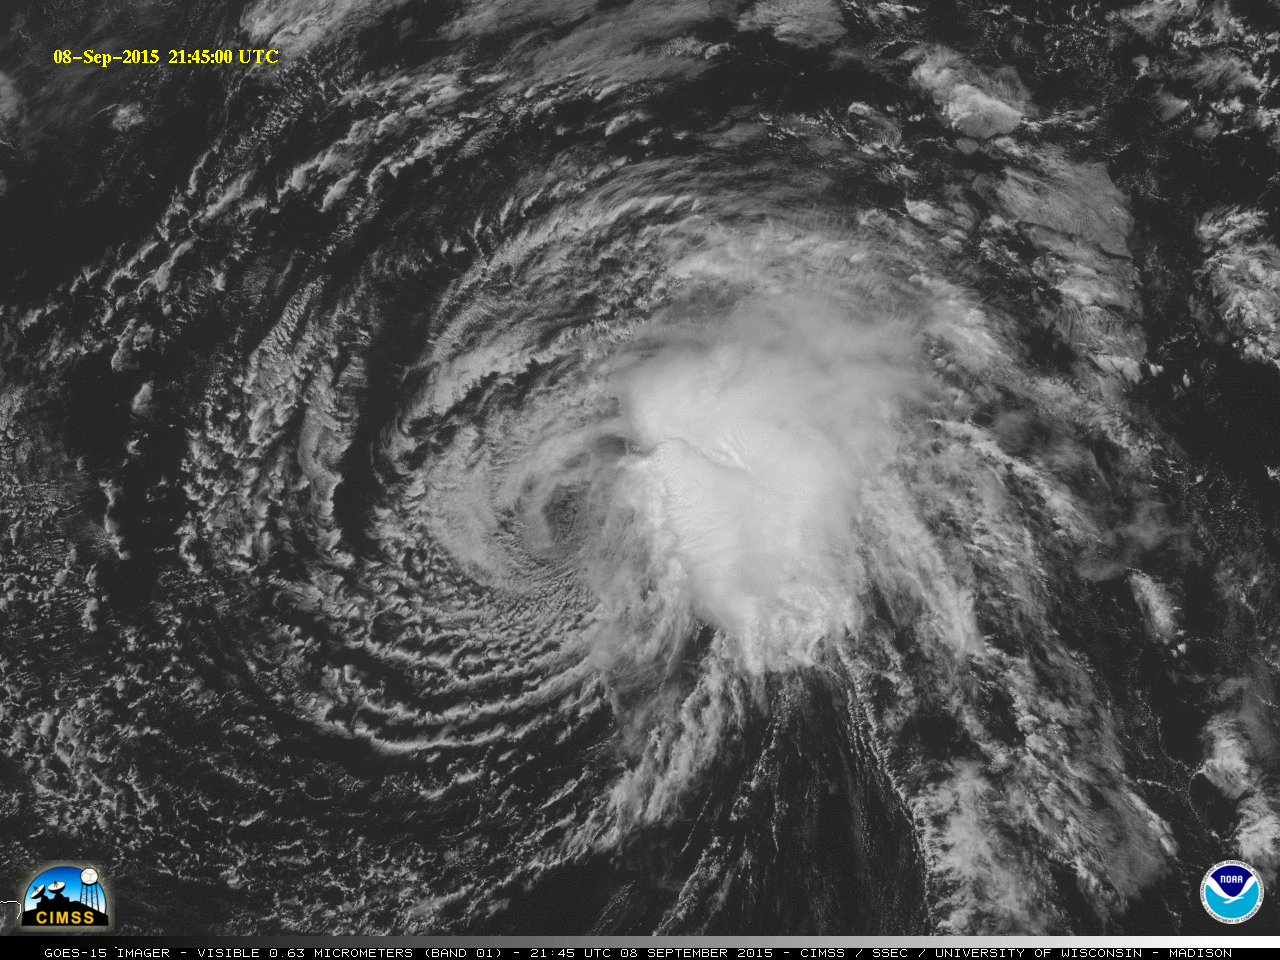
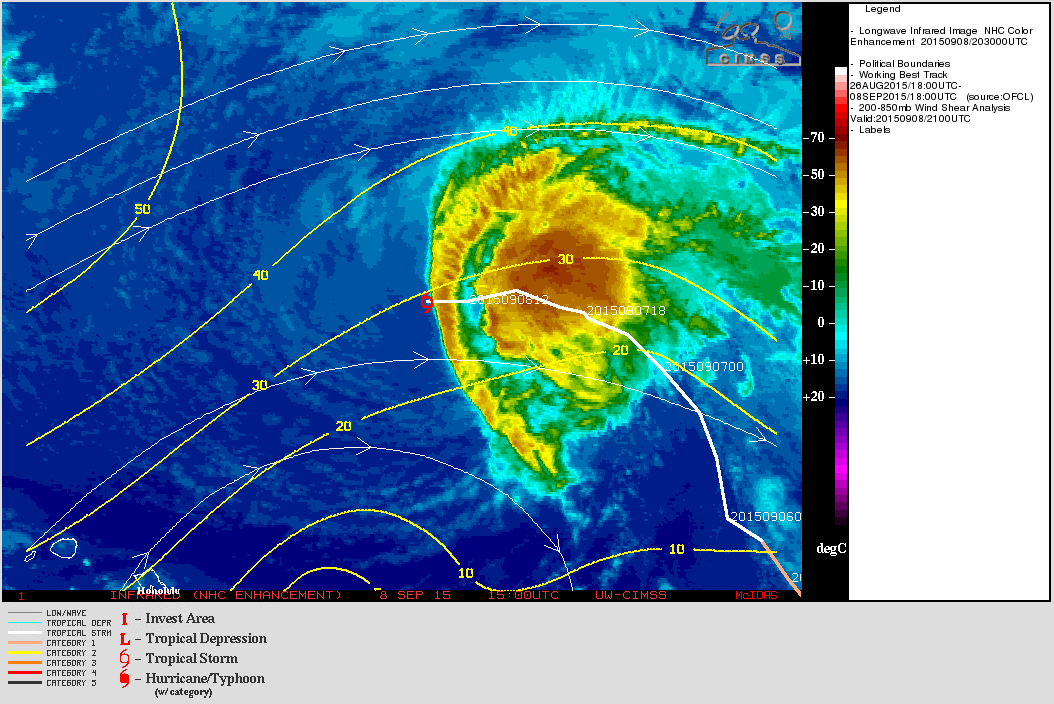
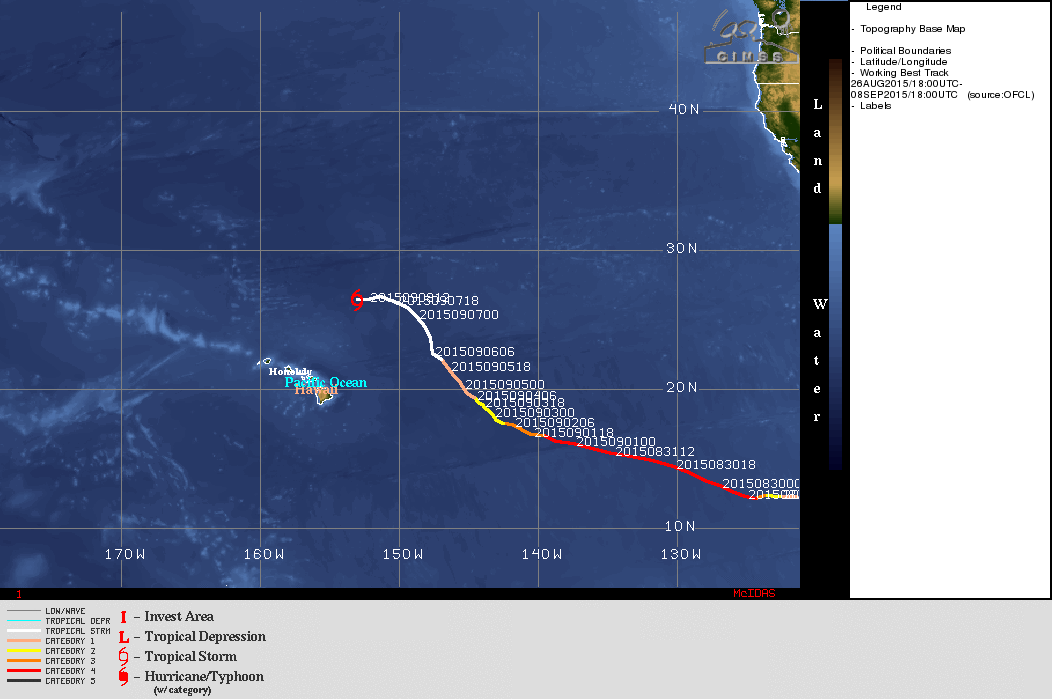
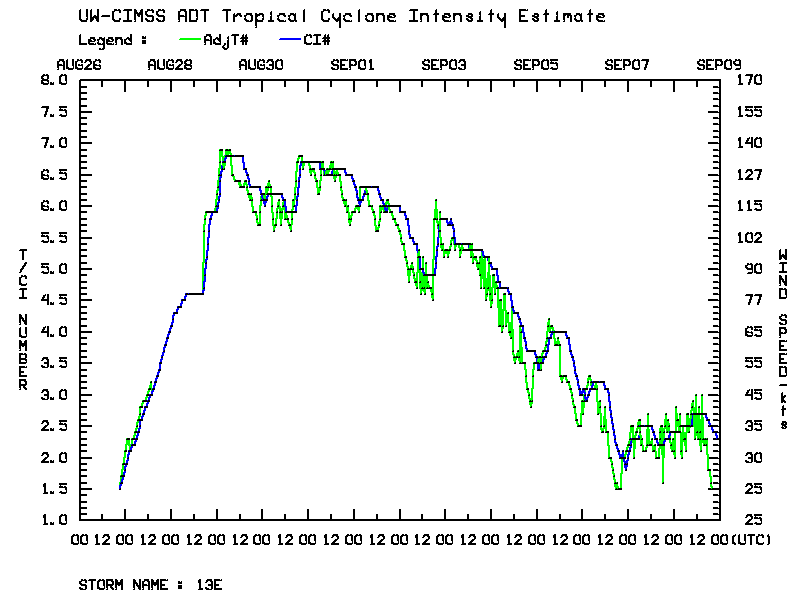
![GOES-15 Visible (0.63 um) images [click to play animation]](https://cimss.ssec.wisc.edu/satellite-blog/wp-content/uploads/sites/5/2015/09/150908_goes15_visible_Jimena_anim.gif)
![Suomi NPP VIIRS Day/Night Band (0.7 µm) and Infrared (11.45 µm) images [click to enlarge]](https://cimss.ssec.wisc.edu/satellite-blog/wp-content/uploads/sites/5/2015/09/150908_1146utc_suomi_npp_viirs_dnb_ir_Jimena_anim.gif)
![DMSP-18 SSMIS Microwave (85 GHz) image [click to enlarge]](https://cimss.ssec.wisc.edu/satellite-blog/wp-content/uploads/sites/5/2015/09/150908_1733utc_ssmis_mw_Jimena.gif)
