GOES-18 imagery from the CSPP Geosphere site, above, shows a thin line of trade wind cumulus from which strong convection develops over Tutuila (the main island of American Samoa). The heavy rains prompted the issuance of Flood Advisories. What products or imagery might have helped in anticipating this convective development?
LightningCast probabilities between 0000 and 0100 UTC on 8 June, below, computed using this CSPP Geo software, show small probabilities developing by 0100 UTC. A forecaster viewing these fields might see them and conclude that something bigger is about to commence.
The Clean Window infrared imagery below, from 0040 – 0110 UTC on 8 June 2025, shows the development of the convection at the western tip of Tutuila. Cooler brightness temperatures are apparent at 0050 UTC — that an the increase in LightningCast probability (shown above) might be enough to convince a forecaster that convection is starting.
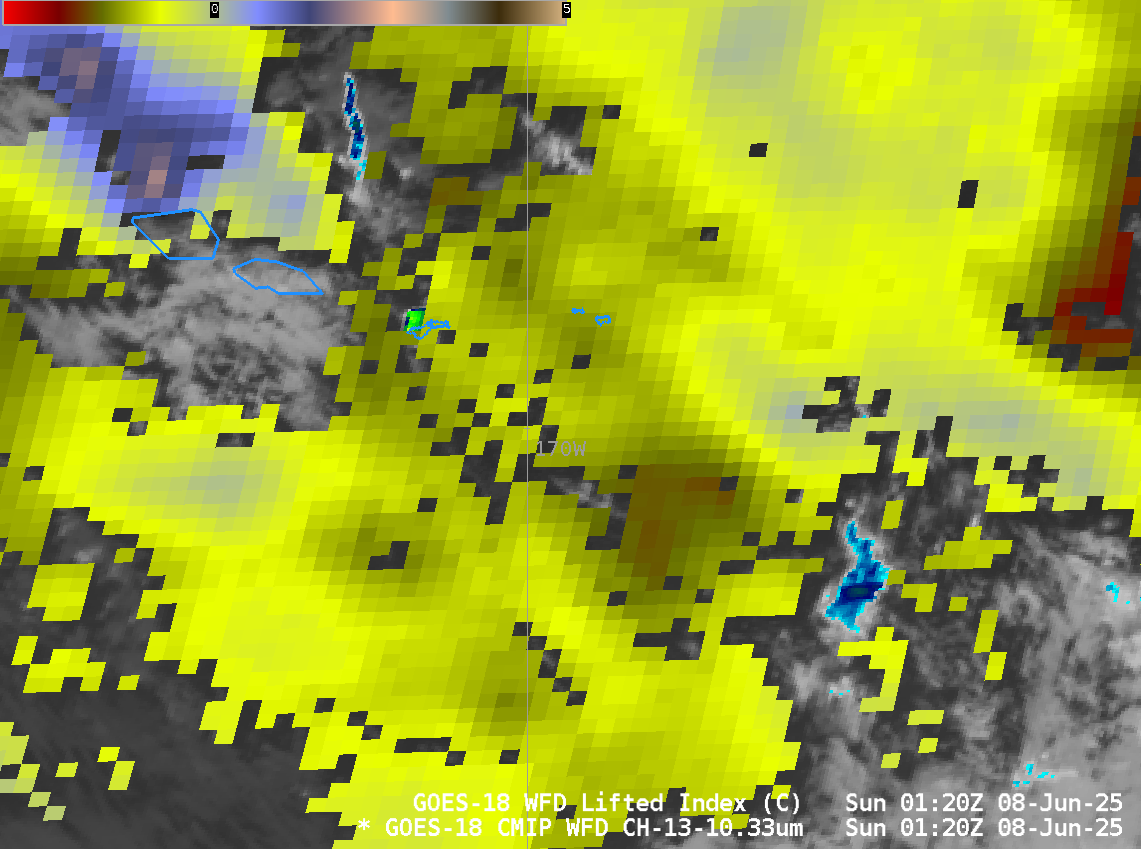
GOES-18 Lifted Index fields, a field that is computed in clear skies only, shows an atmosphere slowly destabilizing around Tutuila from 2300 on the 7th to 0210 on the 8th, changing from about -1.1 to -1.7. So — the cumulus line is approaching an area that is becoming less stable. Strong convection has developed by 0200 UTC.
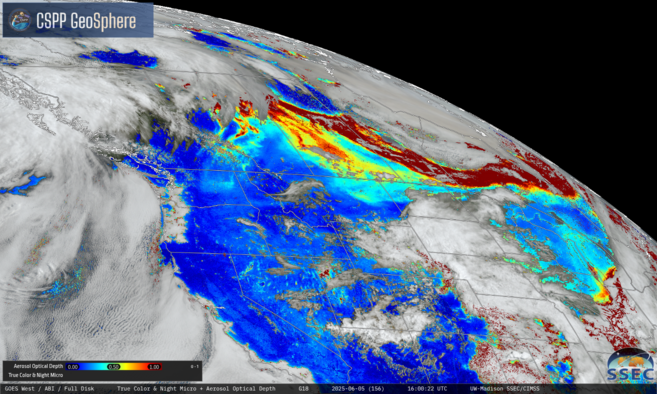
It’s worth mentioning that parallax errors from GOES-18, overhead at 137.2oW (compared to 171oW for Pago Pago) means that the convection that is mapped to the west of Tutuila is, in reality, over the island. Parallax computations (link) suggest that a 30000-foot storm top would be displaced by almost 9 km, or about 4 pixels. The convection was also developing in a region with a bit more moisture (as diagnosed by GOES-R Total Precipitable Water, TPW, below). Regions just east of Tutuila become more moist over the course of the animation below; TPW increases from about 1.8″ to 2″
The Pago Pago sounding from 0000 UTC on 8 June 2025, below, shows abundant instability available if a modest capping inversion can be broken.

Thanks to WSO Pago Pago for alerting me to this challenging case. The interpretation of the Lifted Index is very much simpler because the colorbar bounds were changed! Change defaults to highlight subtle features.
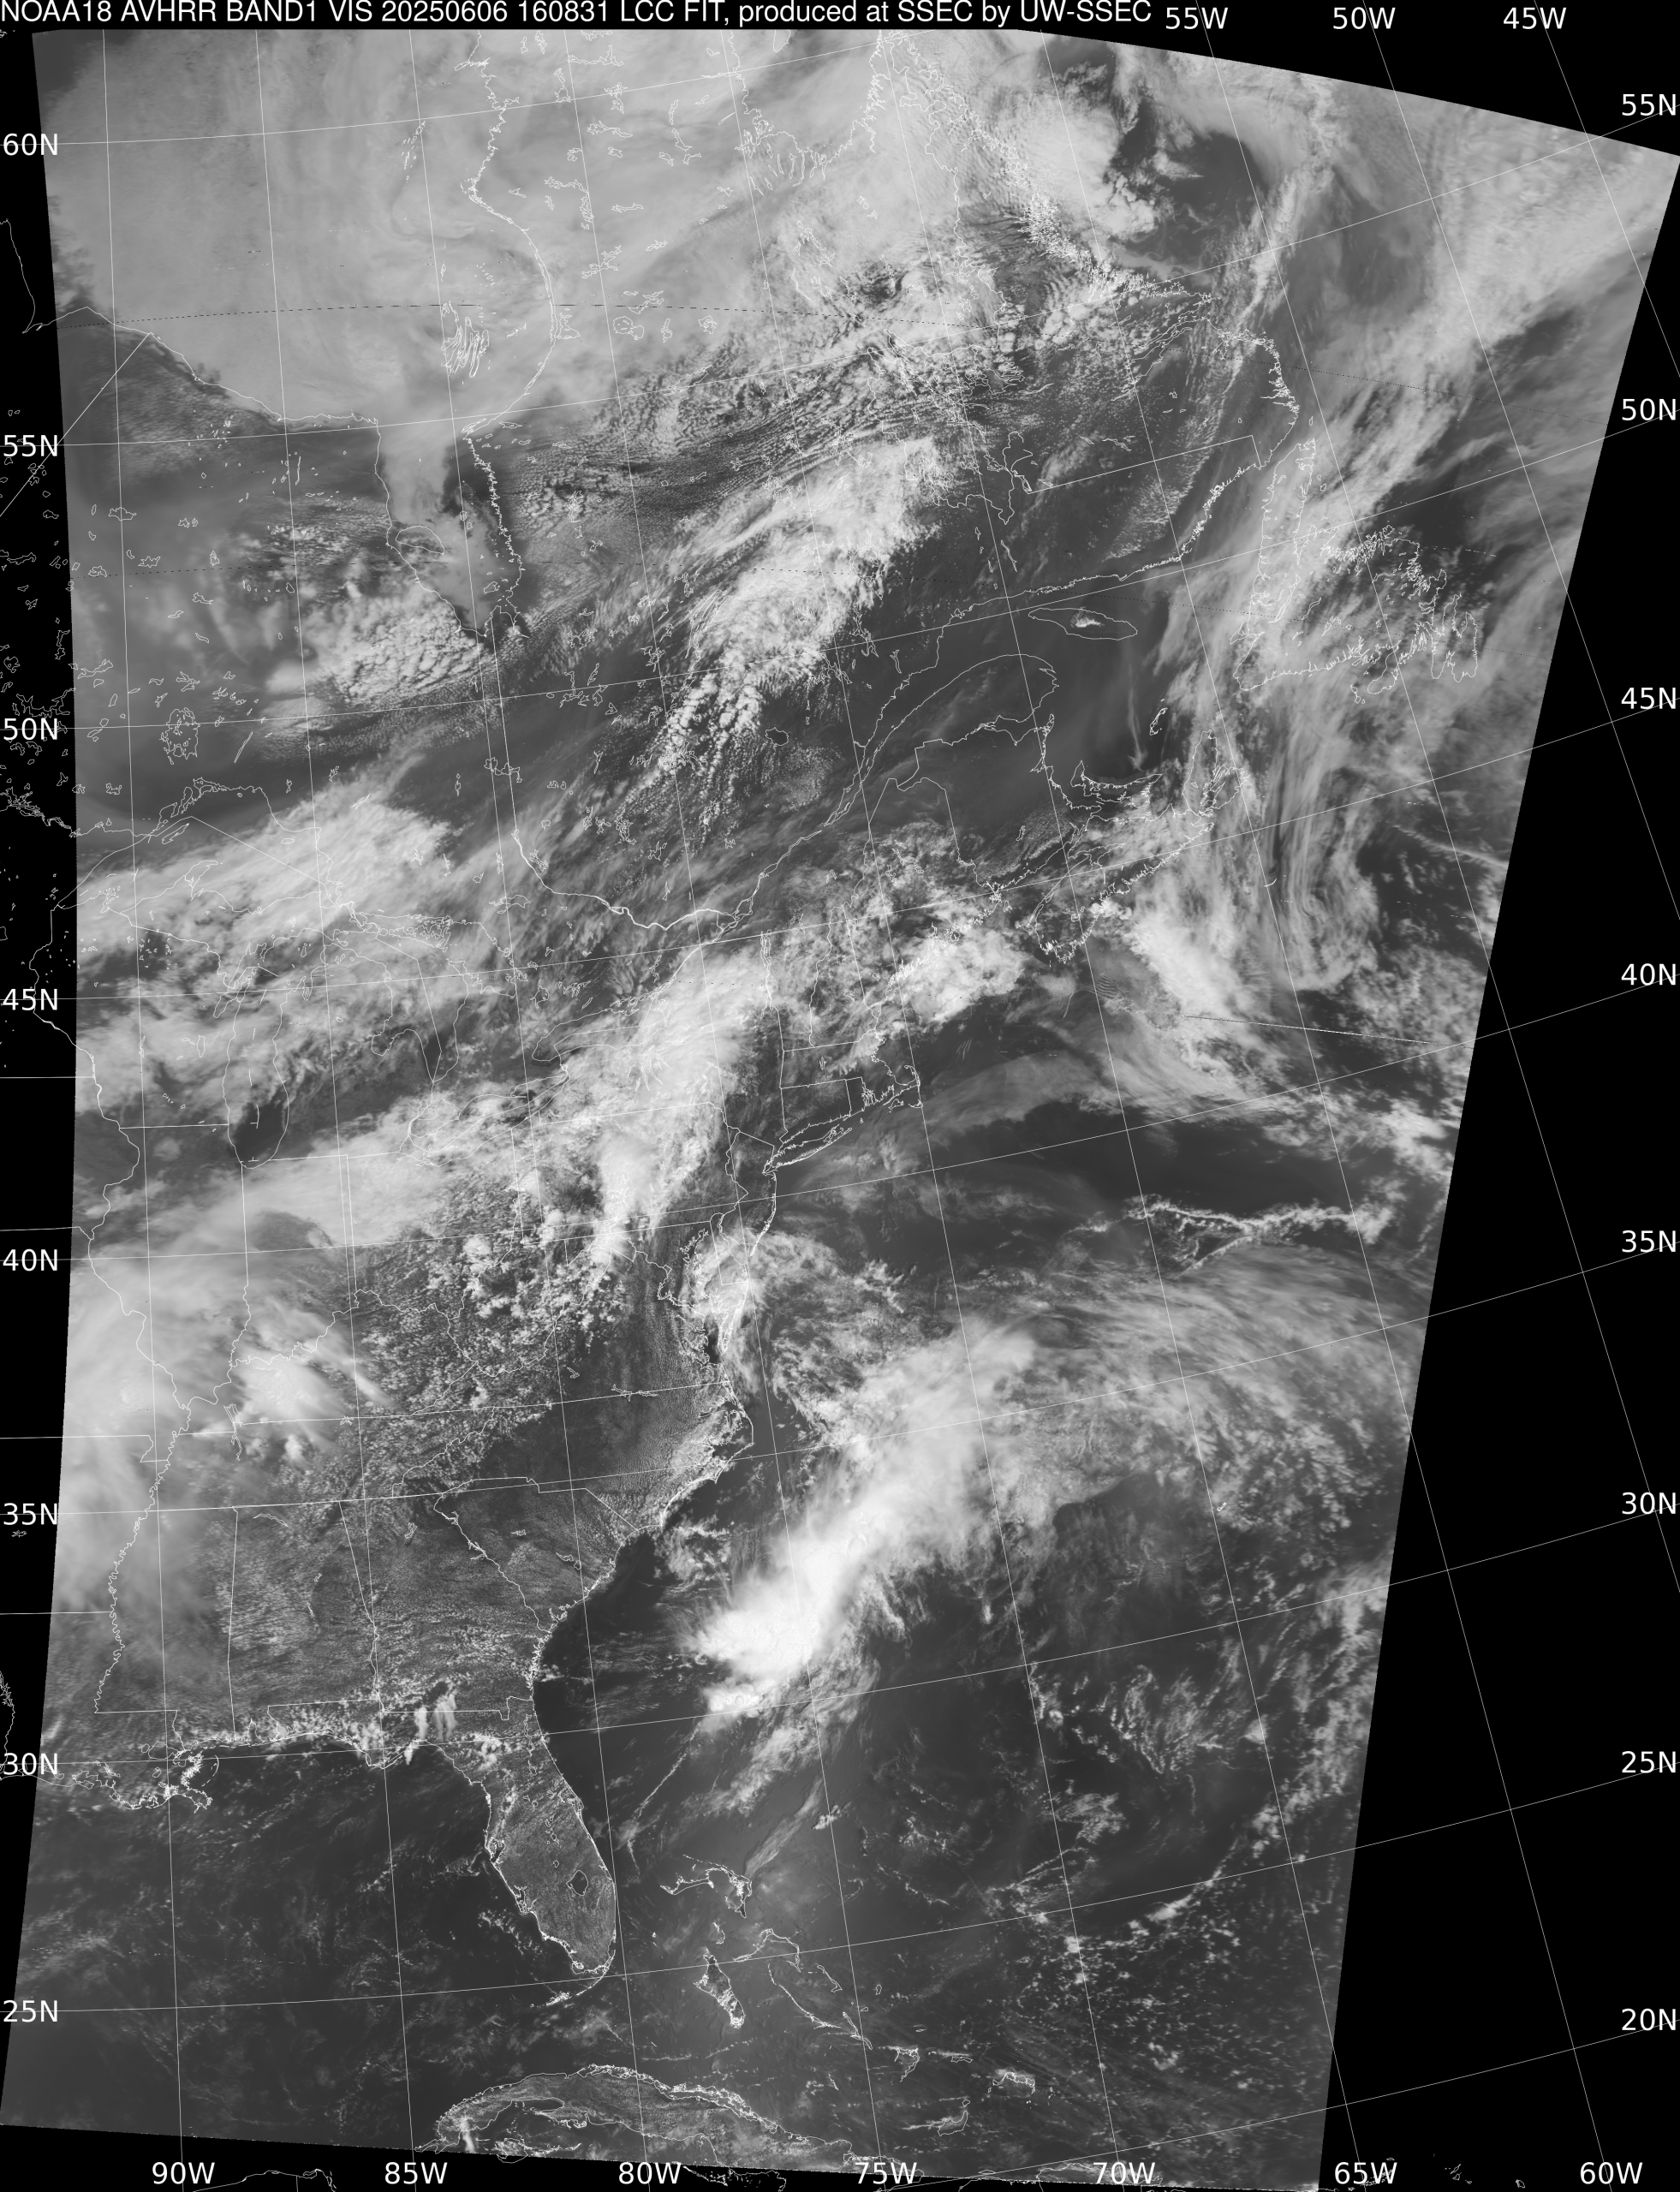
Given that the narrow lines of tradewind cumulus are possible regions of convective development, what tools are available to monitor them at night? The Day Night Band on NOAA-20/NOAA-21/Suomi-NPP produces visible imagery at night. The image below, from the NASA Worldview site, shows a narrow line of tradewind cumulus approaching the Samoan Islands and the convection from earlier moving north of the islands. June 8th was two days before a full Moon, so there was ample illumination.

View only this post Read Less


