1-minute Mesoscale Domain Sector GOES-19 (GOES-East) “Red” Visible (0.64 µm) images (above) showed supercell thunderstorms that produced tornadoes, hail as large as 4.25″ in diameter and wind gusts as high as 100 mph (SPC Storm Reports) across parts of Texas and Oklahoma on 08 June 2025. Frequent pulses of overshooting tops were apparent with these thunderstorms.In the corresponding 1-minute... Read More
1-minute GOES-19 Red Visible (0.64 µm) images with time-matched (+/- 3 minutes) SPC Storm Reports plotted in red, from 2000 UTC on 08 June to 0132 UTC on 09 June [click to play animated GIF | MP4]
1-minute
Mesoscale Domain Sector GOES-19
(GOES-East) “Red” Visible (0.64 µm) images
(above) showed supercell thunderstorms that produced tornadoes, hail as large as
4.25″ in diameter and wind gusts as high as
100 mph (
SPC Storm Reports) across parts of Texas and Oklahoma on
08 June 2025. Frequent pulses of overshooting tops were apparent with these thunderstorms.
In the corresponding 1-minute GOES-19 “Clean” Infrared Window (10.3 µm) images (below), the coldest cloud-top infrared brightness temperatures associated with some of the pulsing overshooting tops were -80ºC or colder (shades of magenta embedded within bright white regions).
1-minute GOES-19 Clean Infrared Window (10.3 µm) images with time-matched (+/- 3 minutes) SPC Storm Reports plotted in white, from 2000 UTC on 08 June to 0537 UTC on 09 June [click to play animated GIF | MP4]
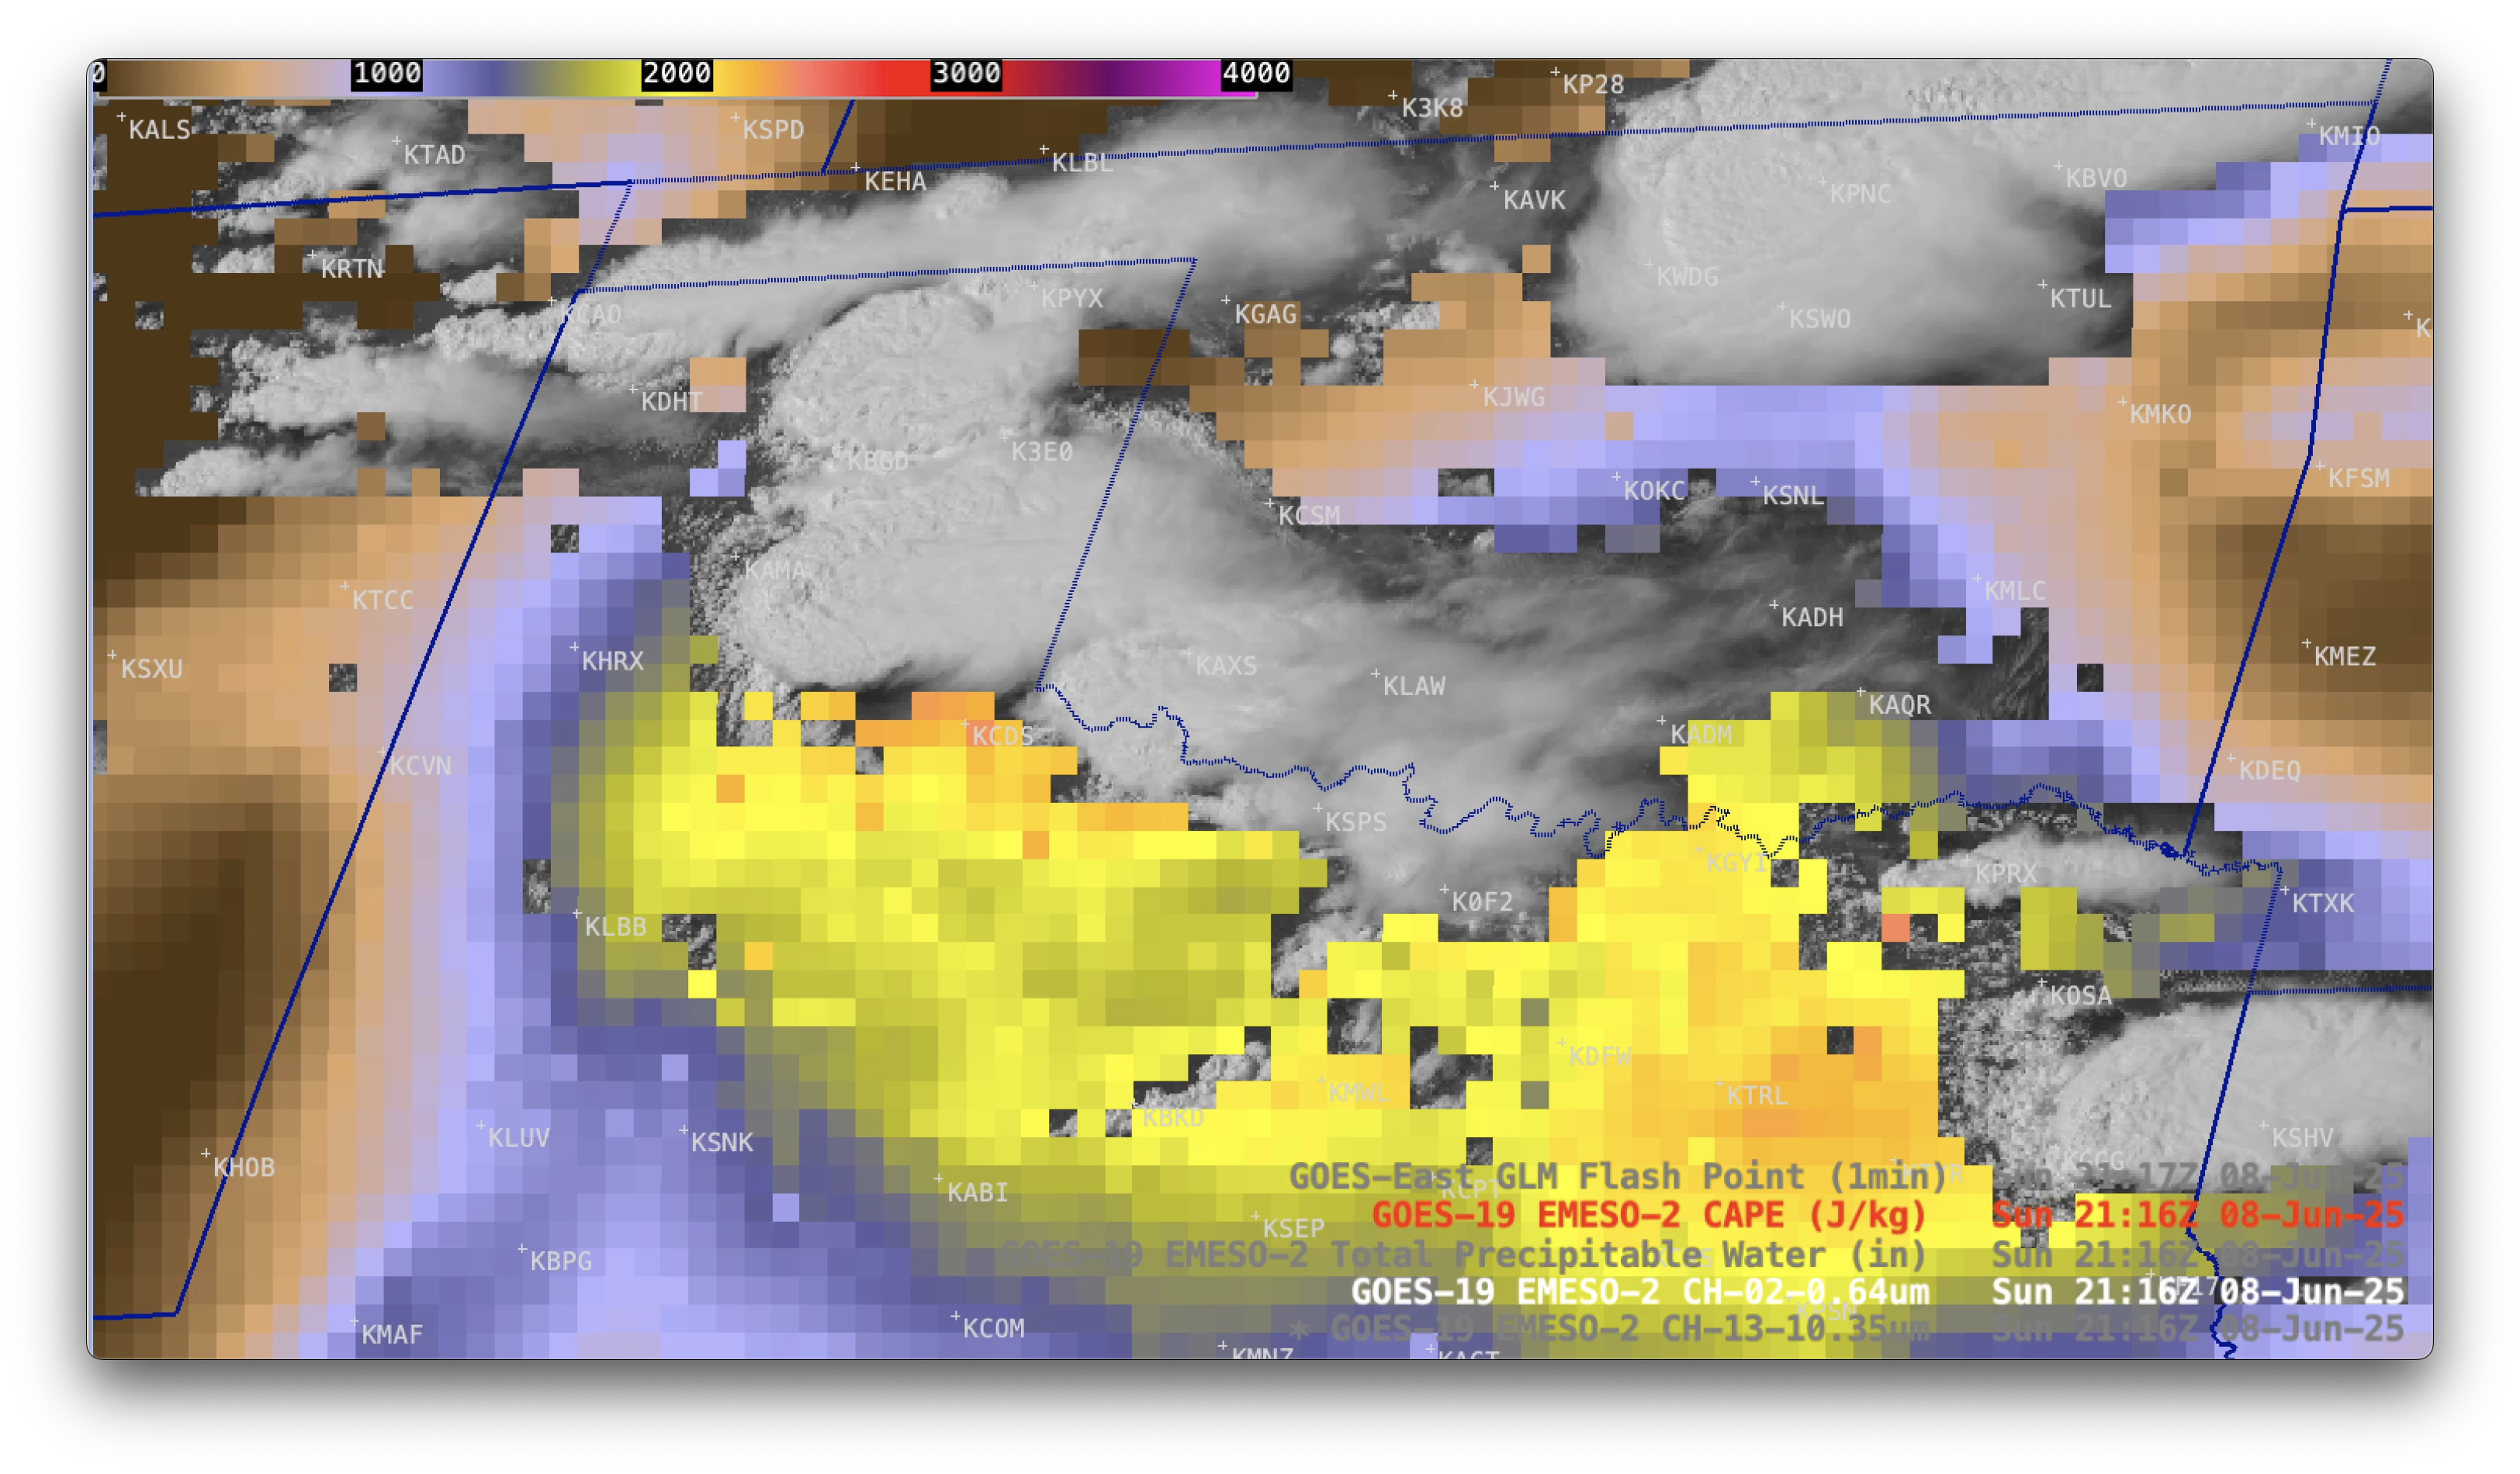
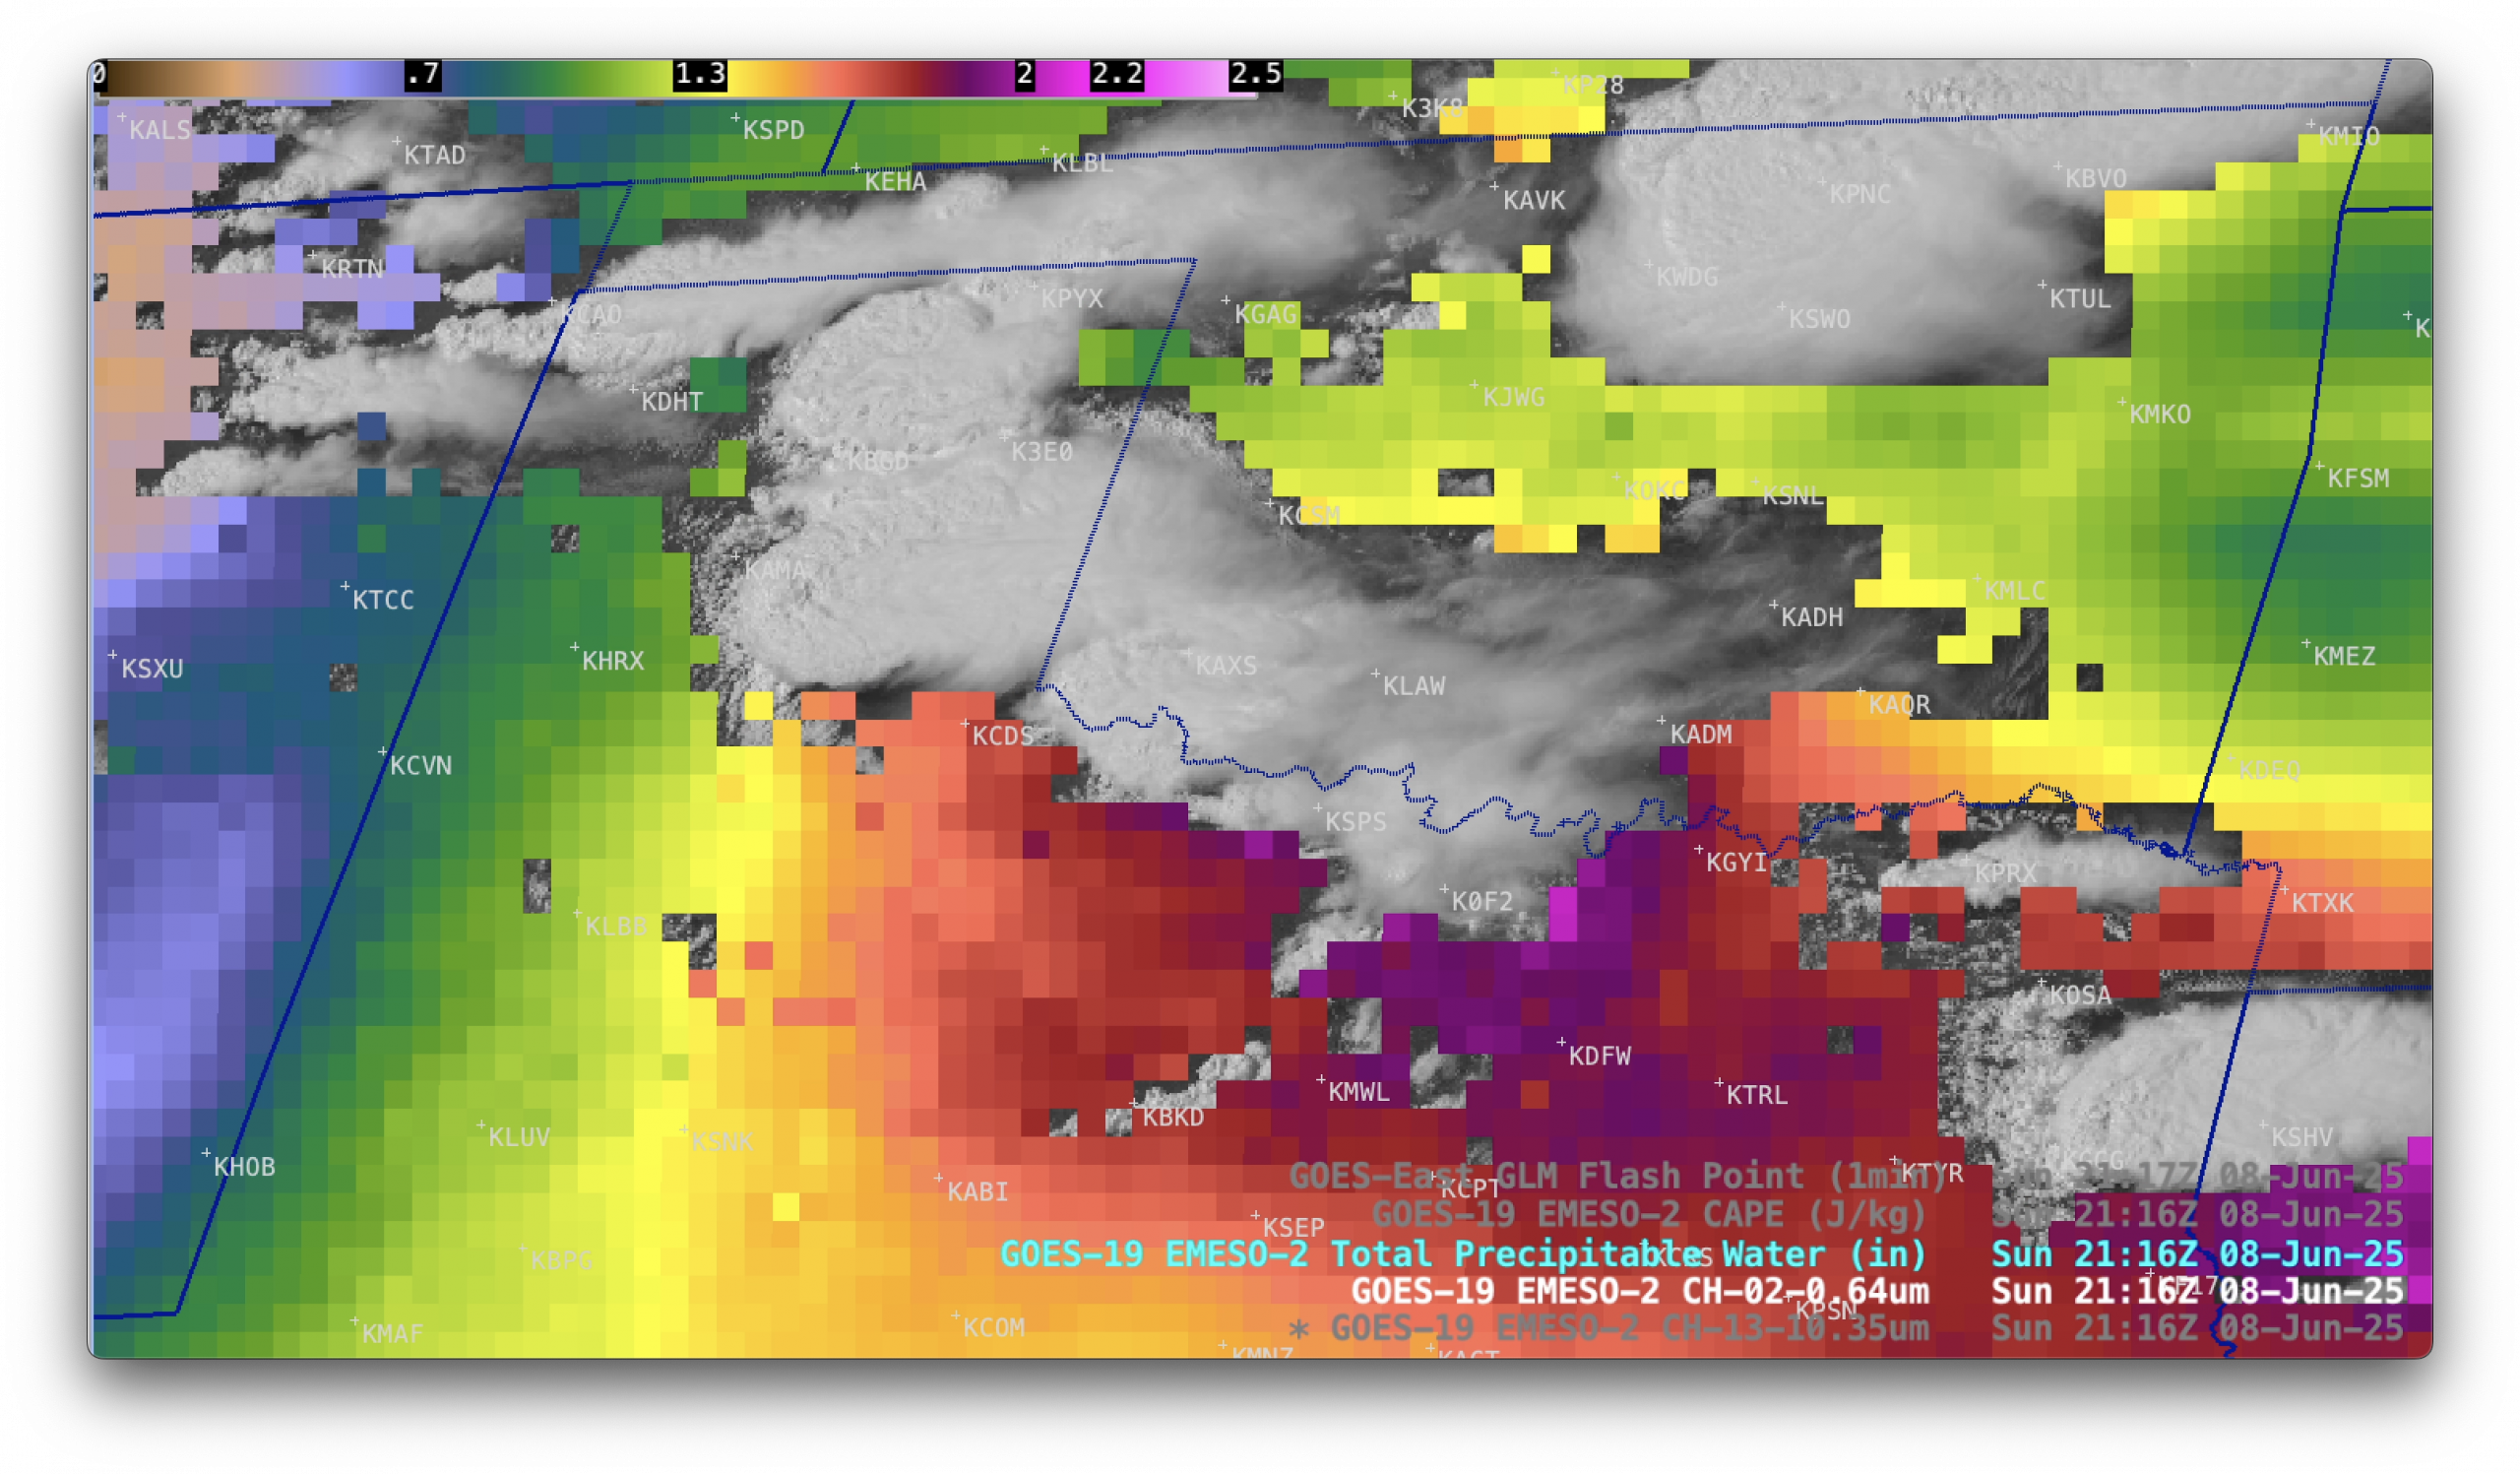
1-minute GOES-19 Red Visible (0.64 µm) images with an overlay of the GOES-19 CAPE derived product (in cloud-free areas), from 2001 UTC on 08 June to 0000 UTC on 09 June [click to play MP4 animation]
Many of these thunderstorms were moving into a broad corridor of enhanced instability and moisture that was in place from northern Texas into southern Oklahoma, as shown by GOES-19
CAPE (above) and
Total Precipitable Water (below) derived products.
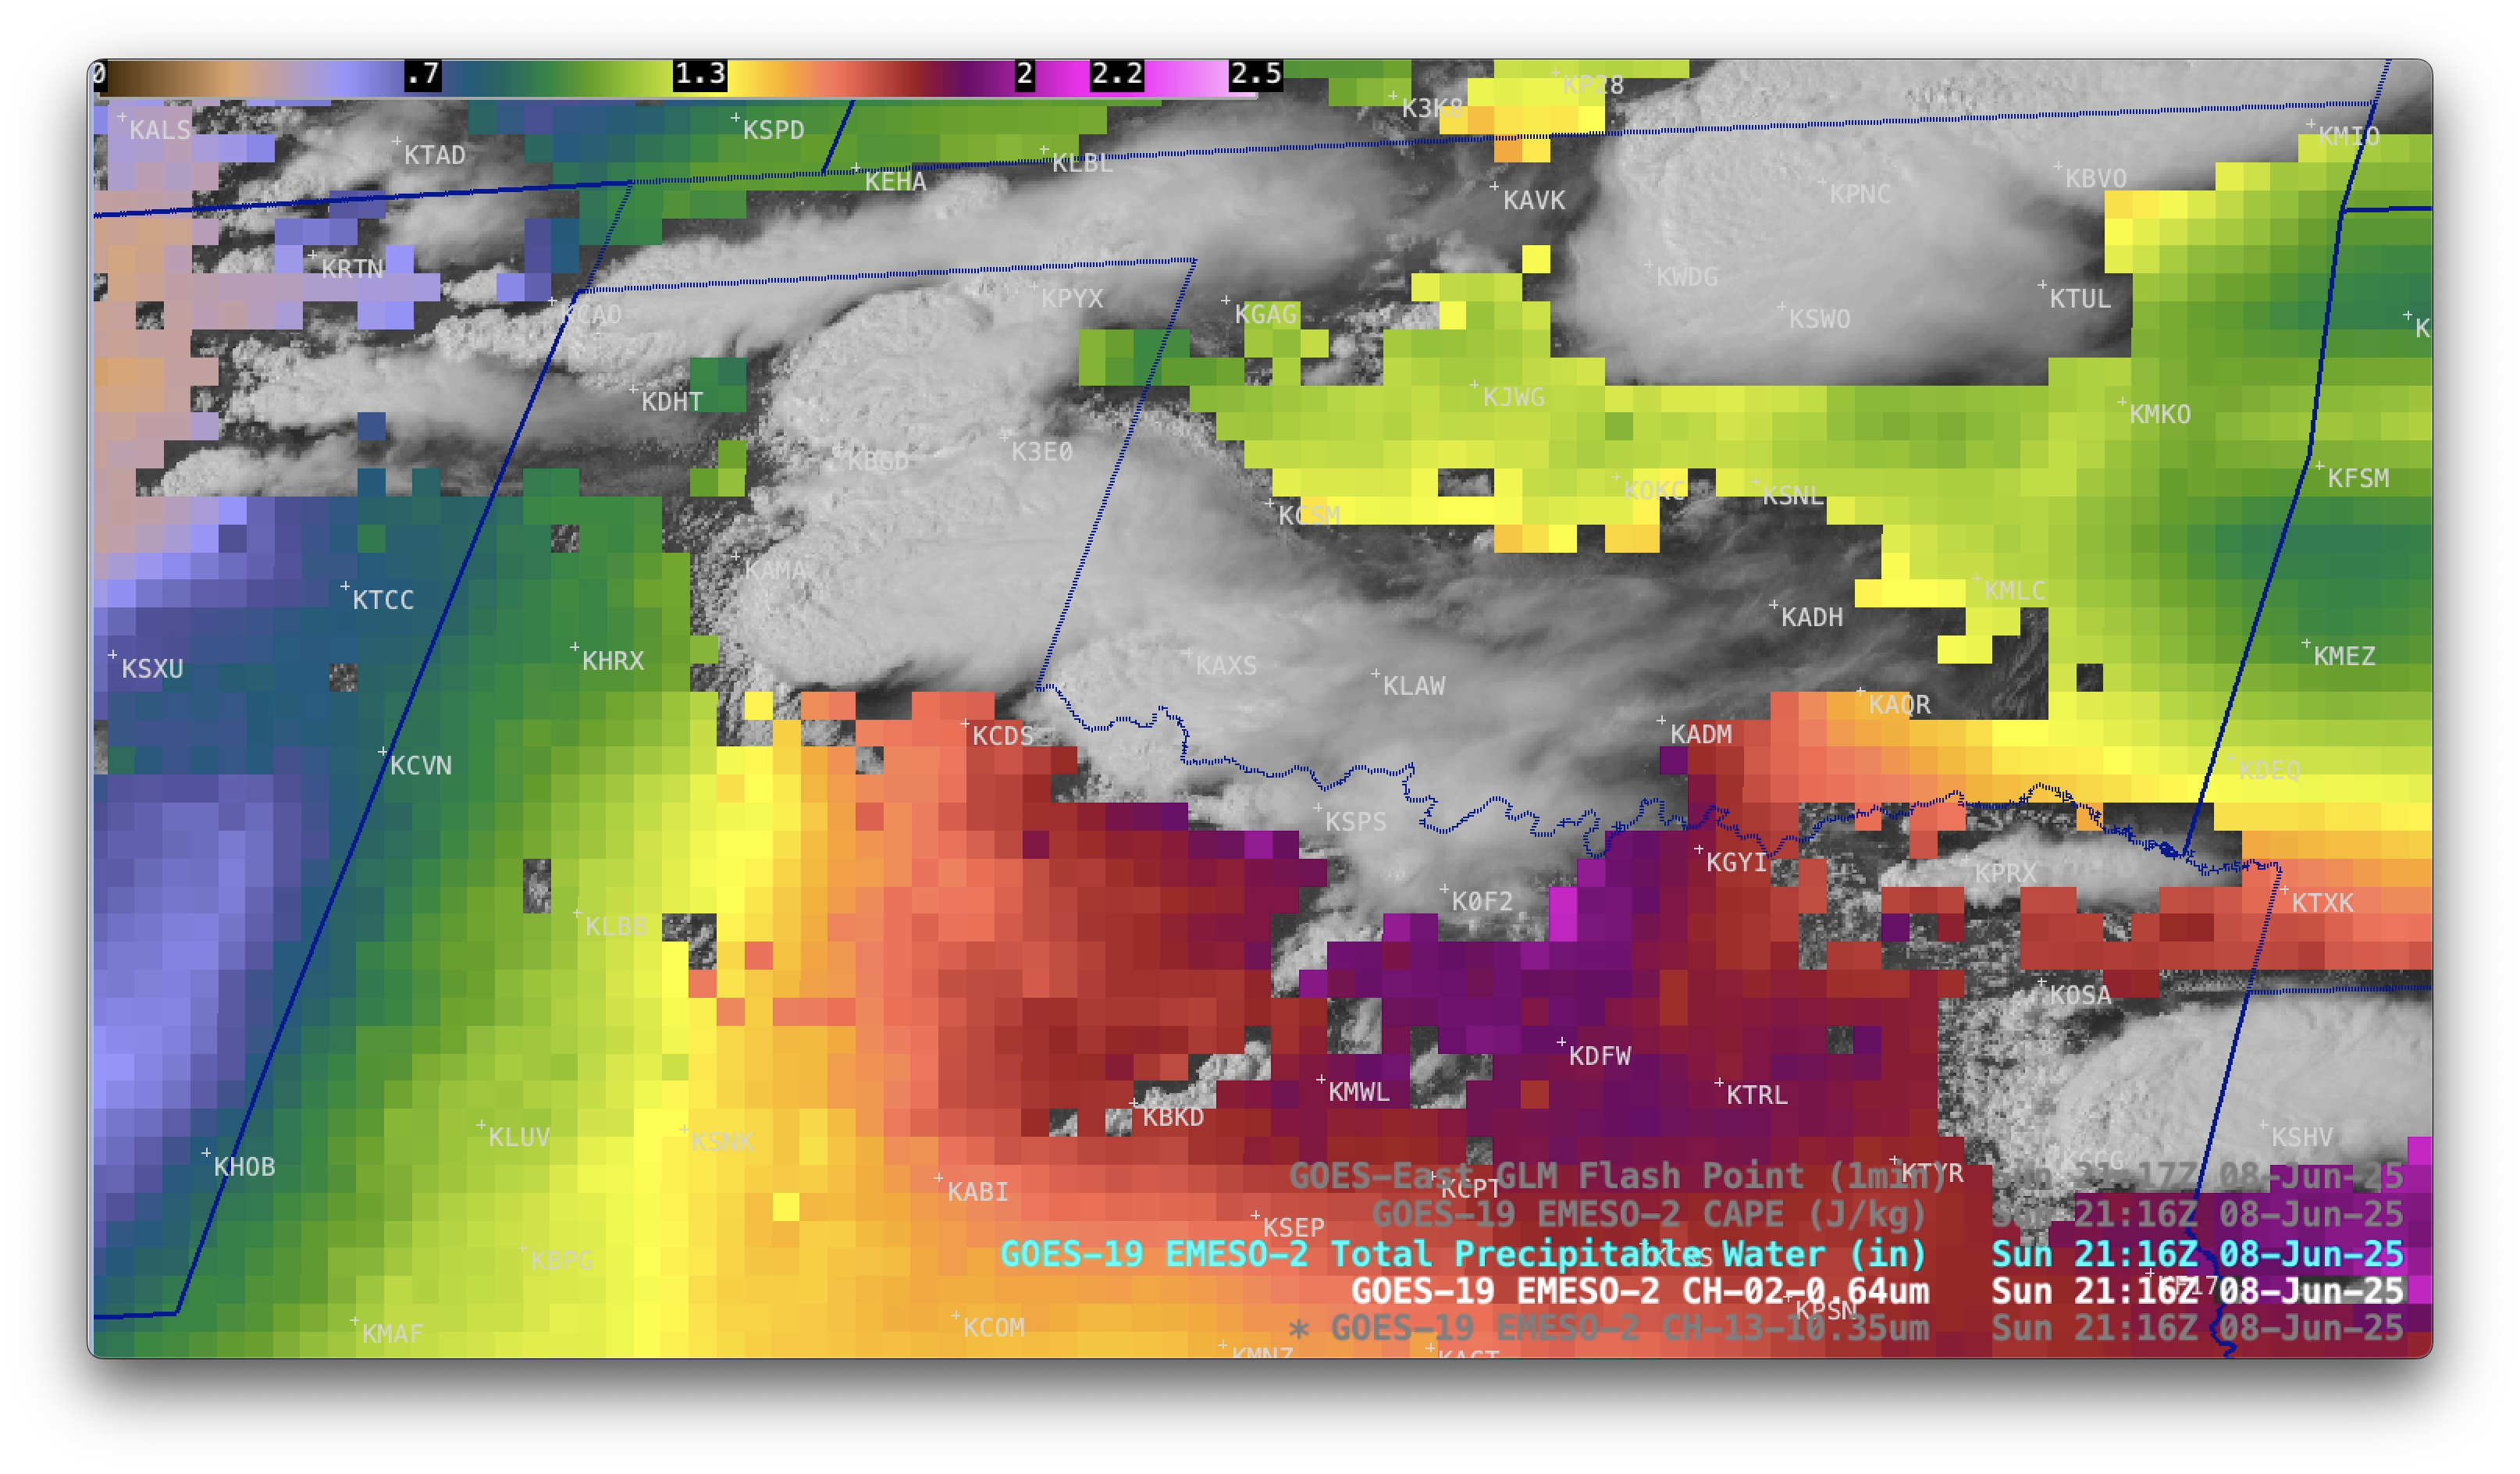
1-minute GOES-19 Red Visible (0.64 µm) images with an overlay of the GOES-19 Total Precipitable Water derived product (in cloud-free areas), from 2001 UTC on 08 June to 0000 UTC on 09 June [click to play MP4 animation]
1-minute GOES-19 Visible images with an overlay of
GLM Flash Points
(below) displayed abundant lightning activity with these thunderstorms.
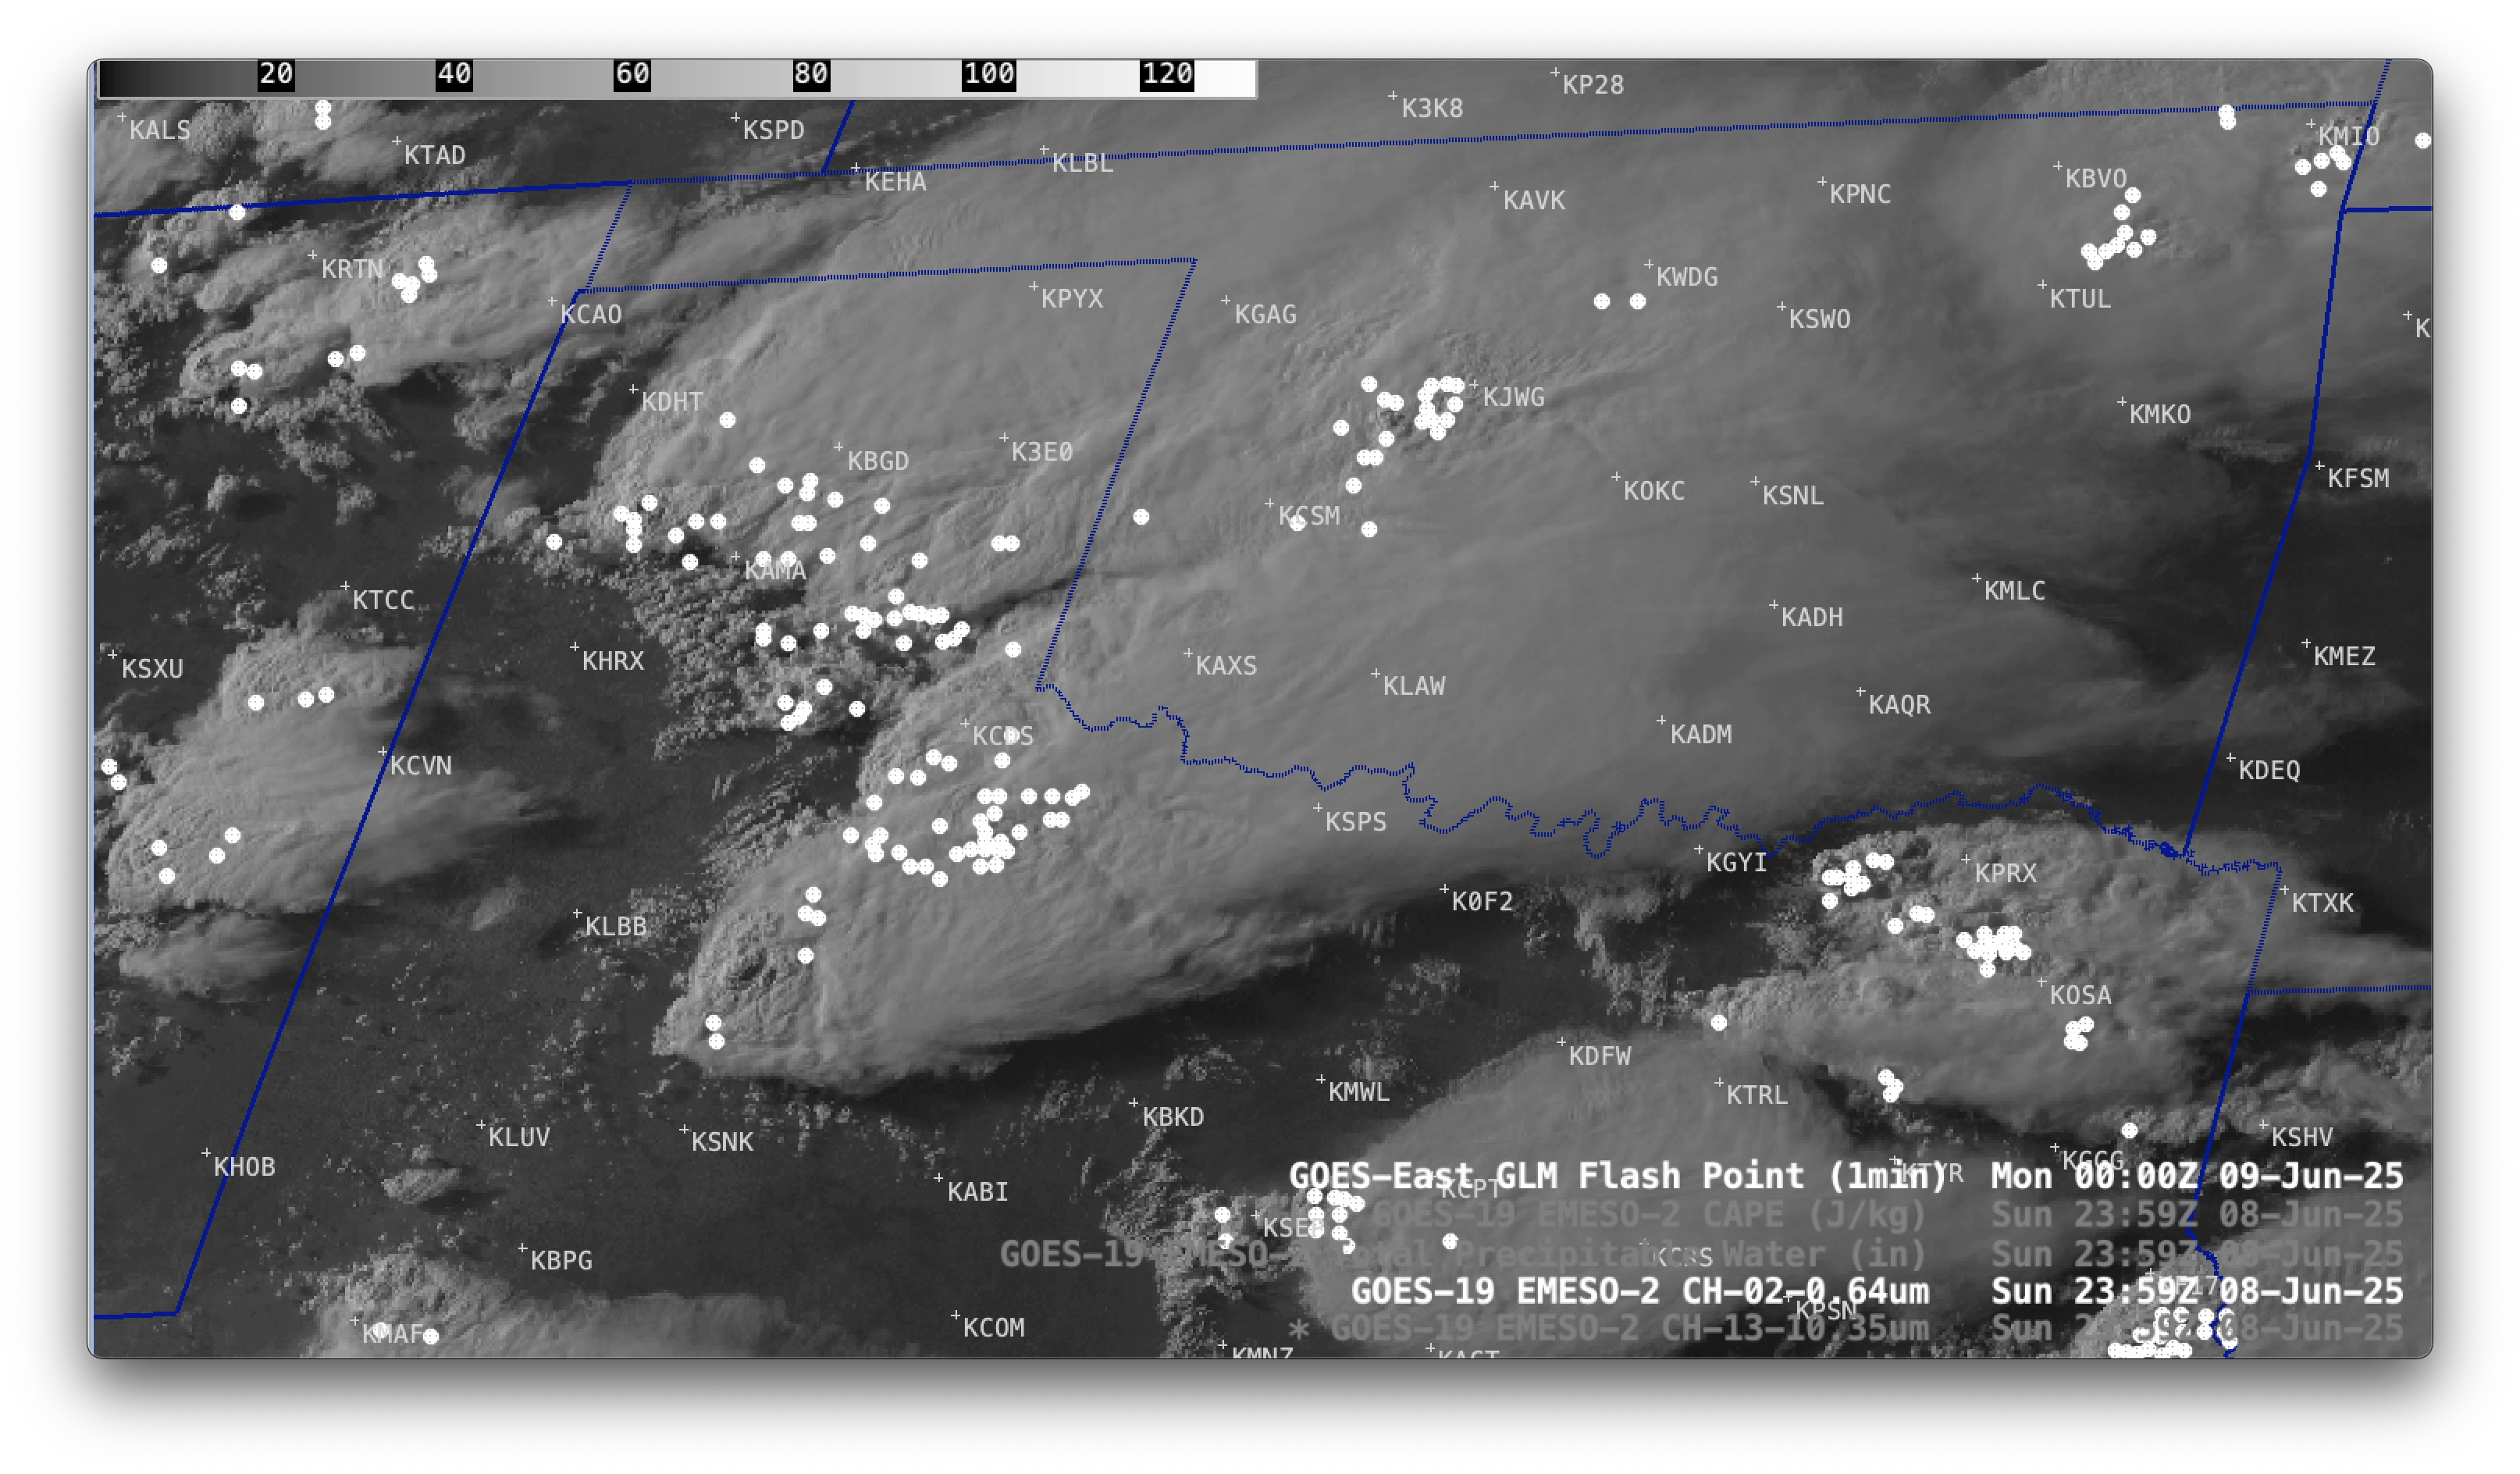
1-minute GOES-19 Red Visible (0.64 µm) images with an overlay of GOES-19 GLM Flash Points, from 2001-2359 UTC on 08 June [click to play MP4 animation]
View only this post
Read Less


