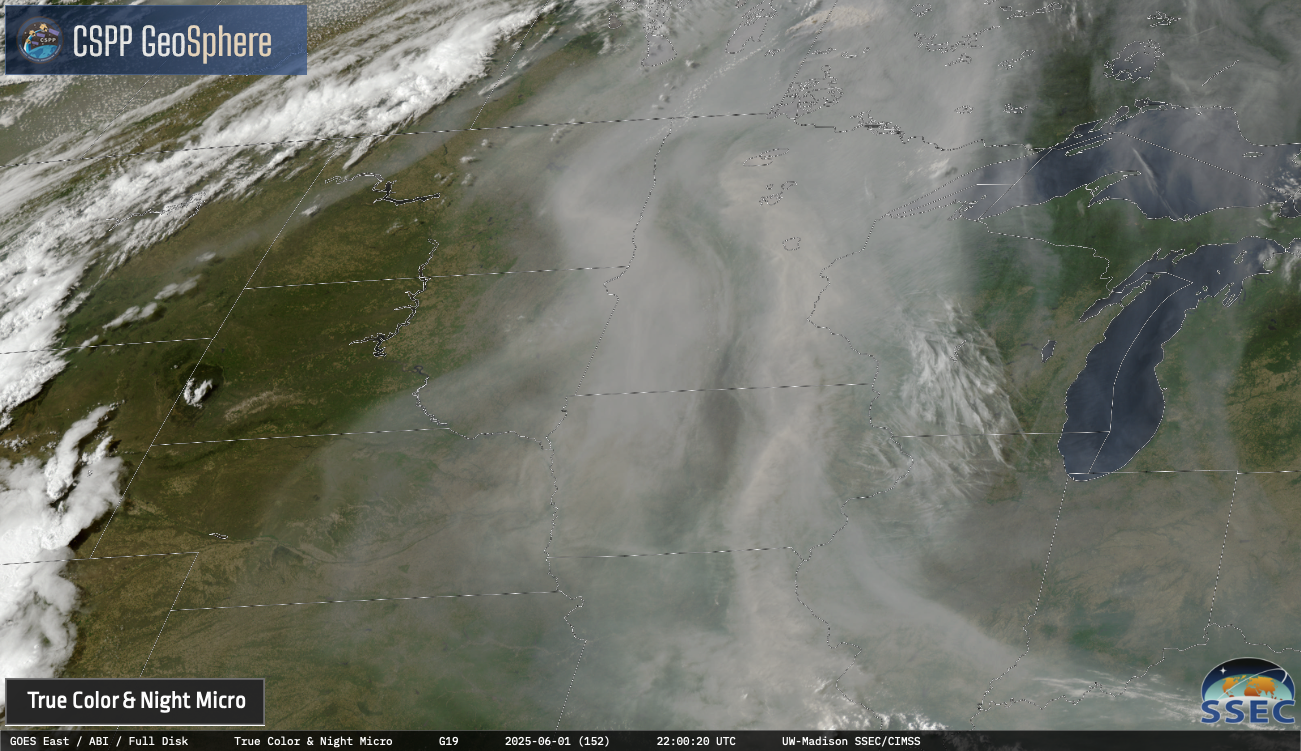

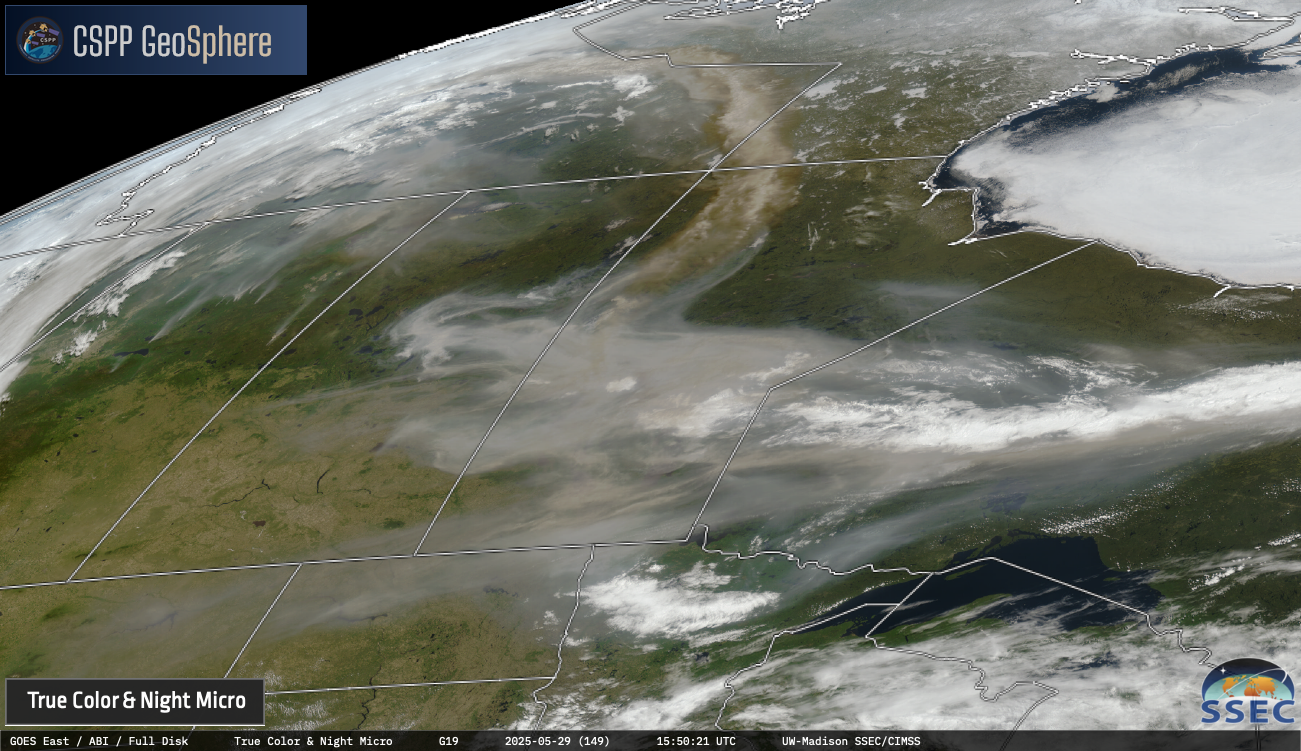
Sequence of GOES-19 True Color RGB images and Aerosol Optical Depth derived product on 30 May [click to play animated GIF]
For the most part, the majority of this smoke remained aloft — and only reduced the surface visibility (the number at the bottom of each Ceiling/Visibility plot, in statute miles) at a handful of sites across northern Minnesota, northern Wisconsin and eastern Iowa (below).
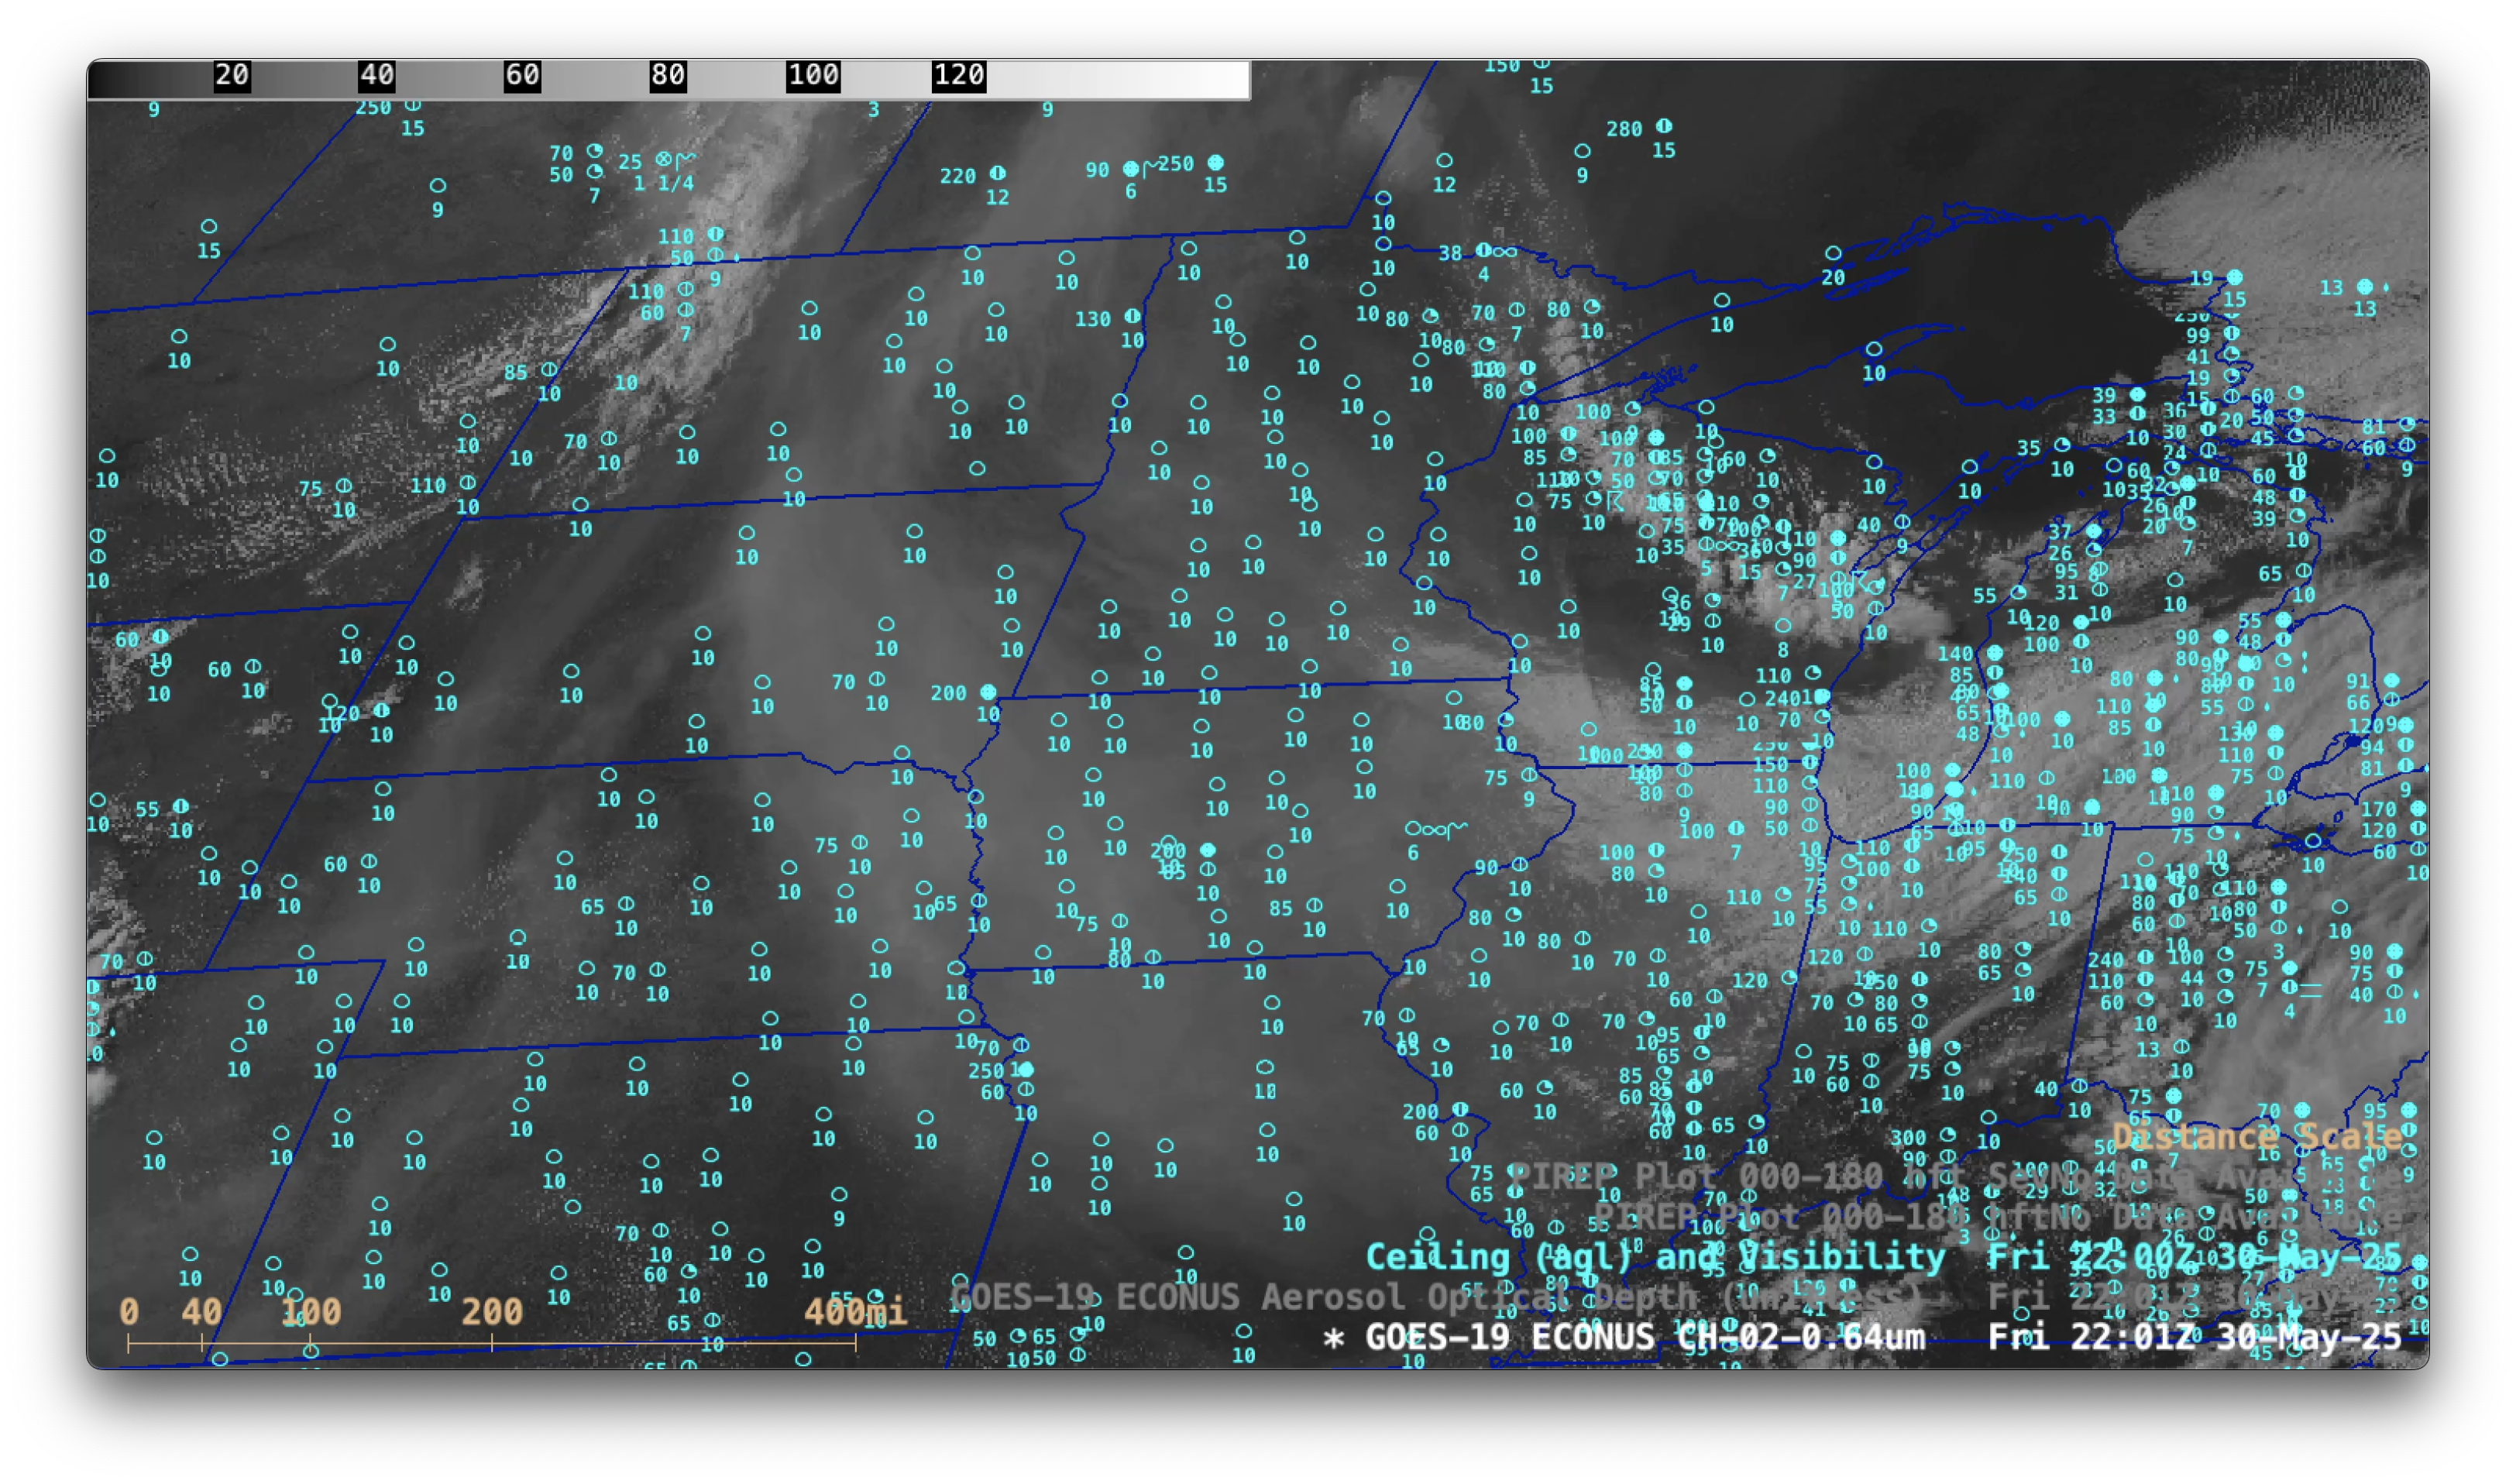
Sequence of GOES-19 Visible images and Aerosol Optical Depth derived product on 30 May, with Ceiling/Visibility observations plotted in cyan [click to play MP4 animation]
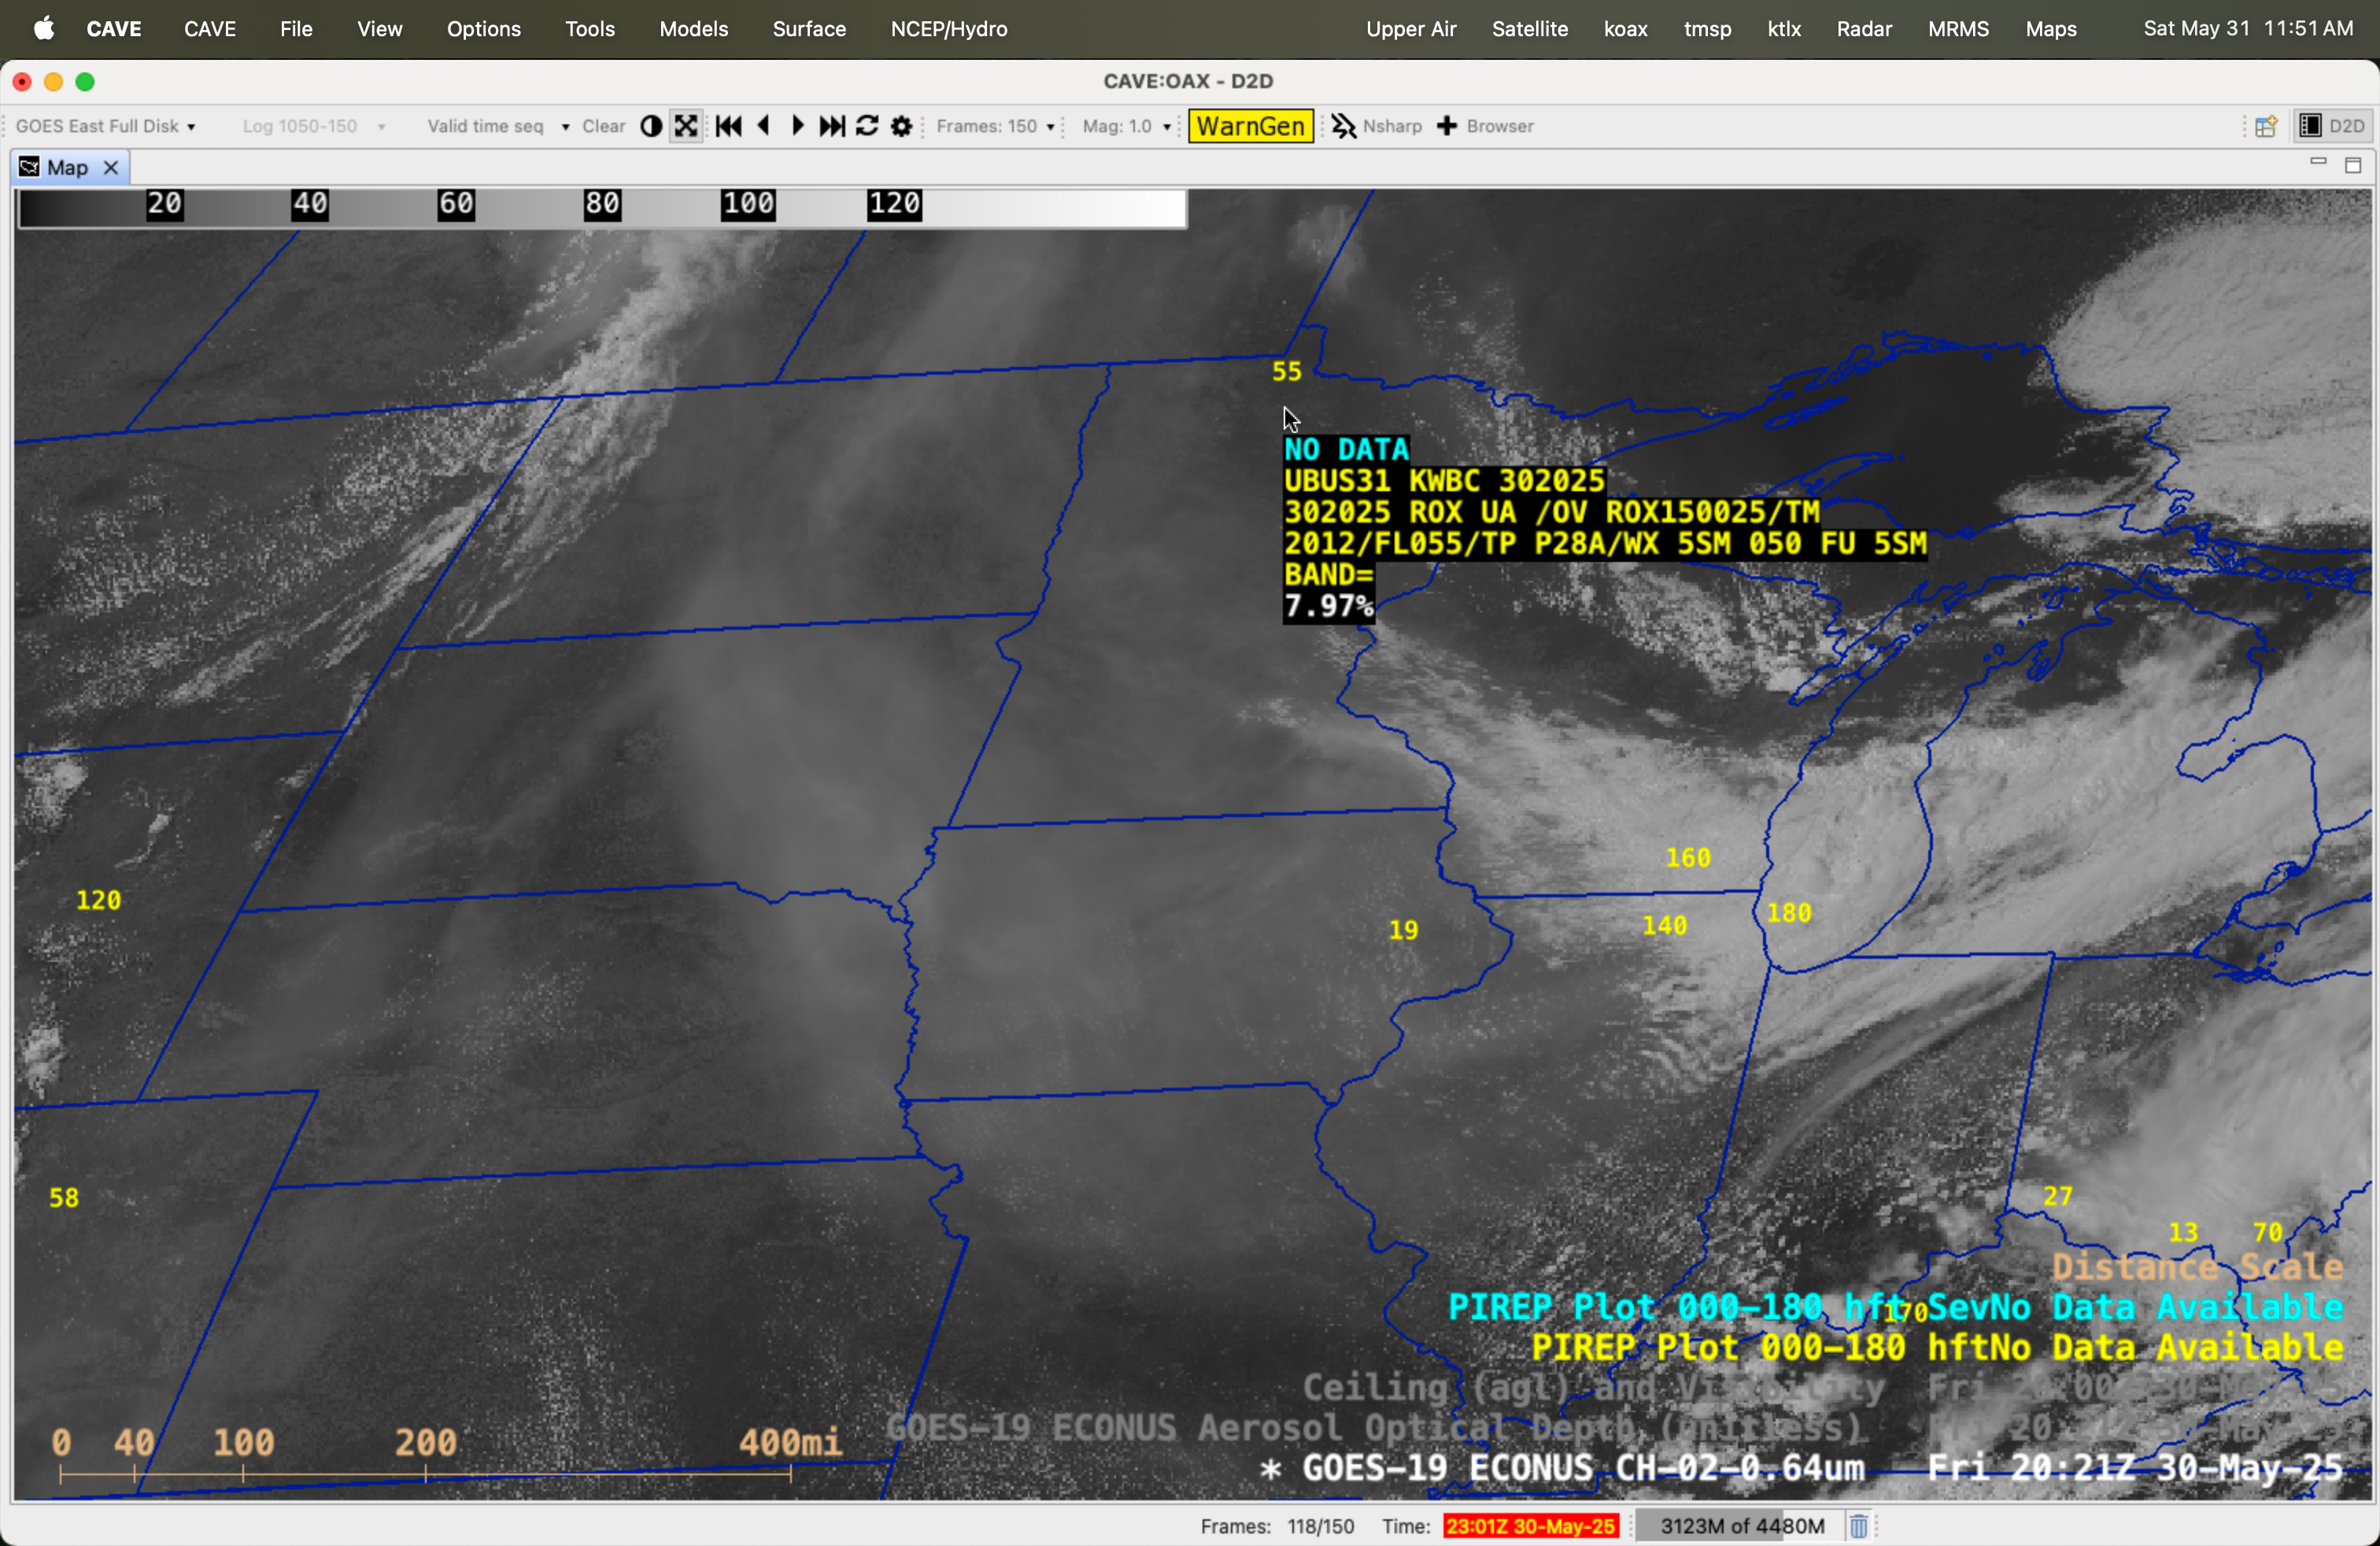
GOES-19 Visible image at 2011 UTC on 30 May, with cursor sampling of a Pilot Report over Minnesota [click to enlarge]
=========
On 31 May, GOES-19 True Color RGB and AOD imagery (below) revealed that some of the smoke was becoming entrained into the circulation of a compact area of mid-tropospheric low pressure that was moving southward from the Dakotas to Nebraska.

Sequence of GOES-19 True Color RGB images and Aerosol Optical Depth derived product on 31 May [click to play animated GIF]
Sequence of GOES-19 Visible images and Aerosol Optical Depth derived product on 31 May, with Ceiling/Visibility observations plotted in cyan [click to play MP4 animation]
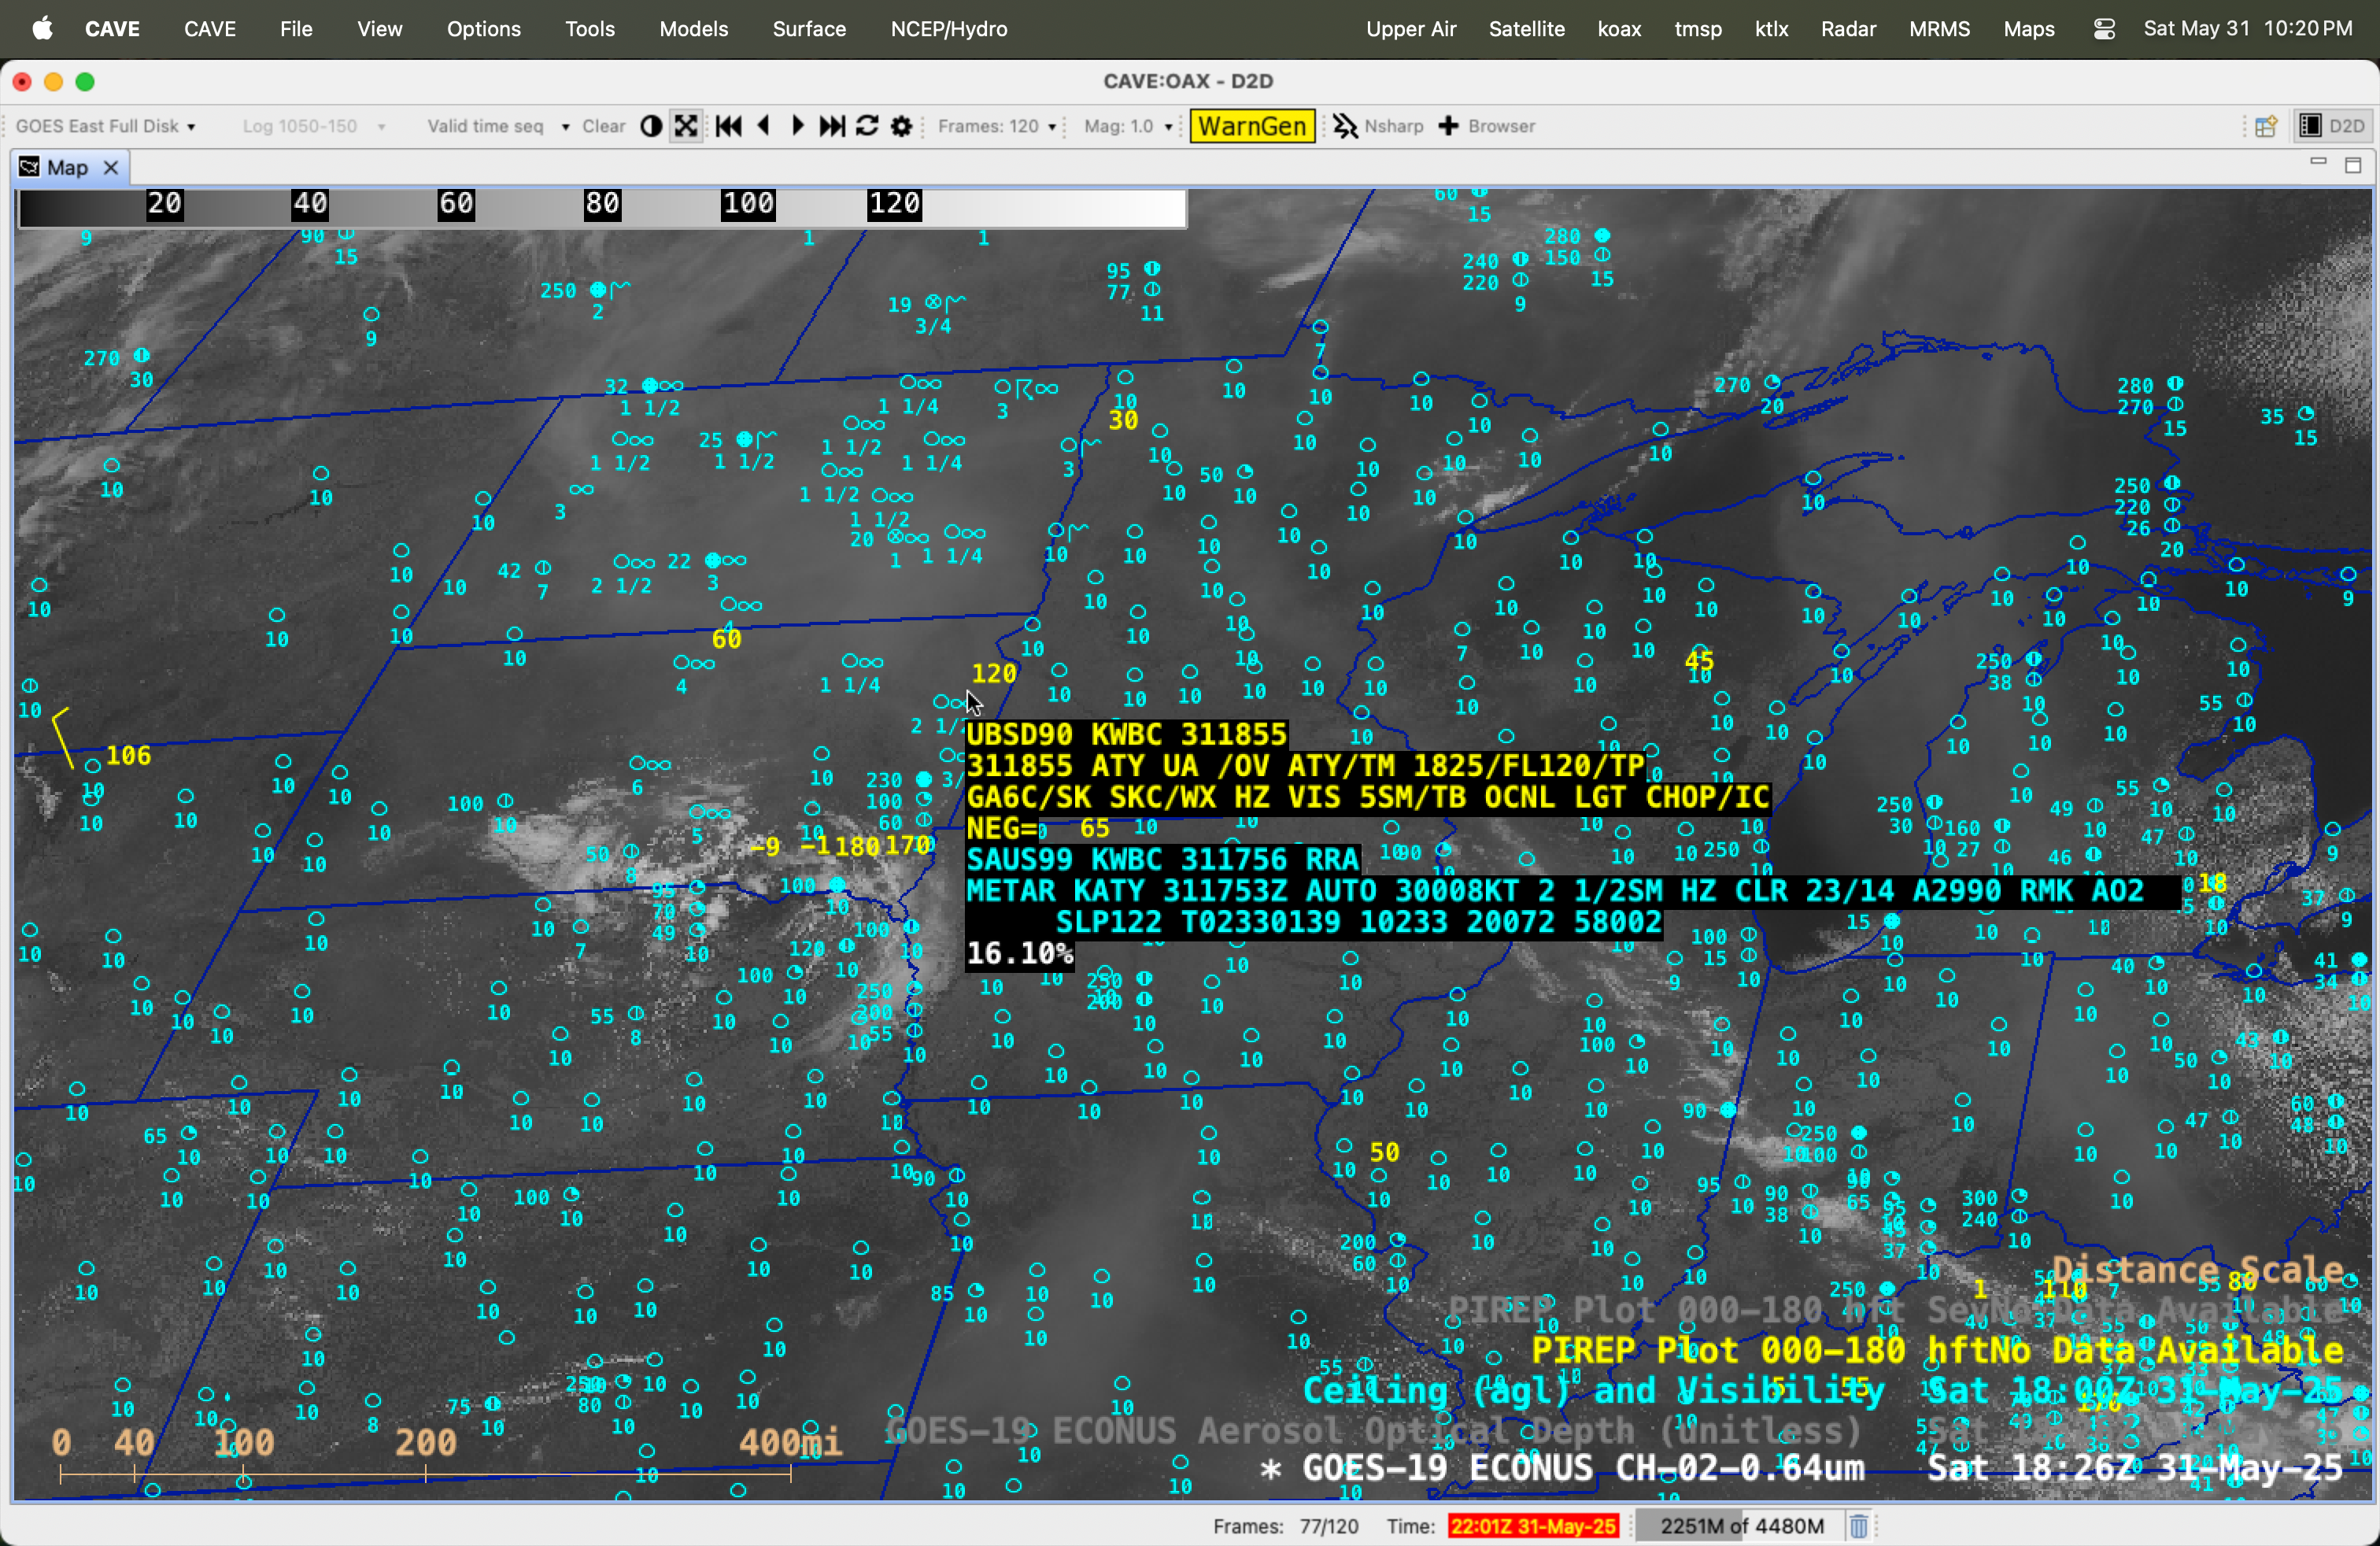
GOES-19 Visible image at 1826 UTC on 31 May, with cursor sampling of the surface report and a Pilot Report over Watertown SD [click to enlarge]
=========
Dense wildfire smoke persisted across much of the region on 01 June, as shown by GOES-19 True Color RGB and AOD imagery (below).

Sequence of GOES-19 True Color RGB images and Aerosol Optical Depth derived product on 01 June [click to play animated GIF]
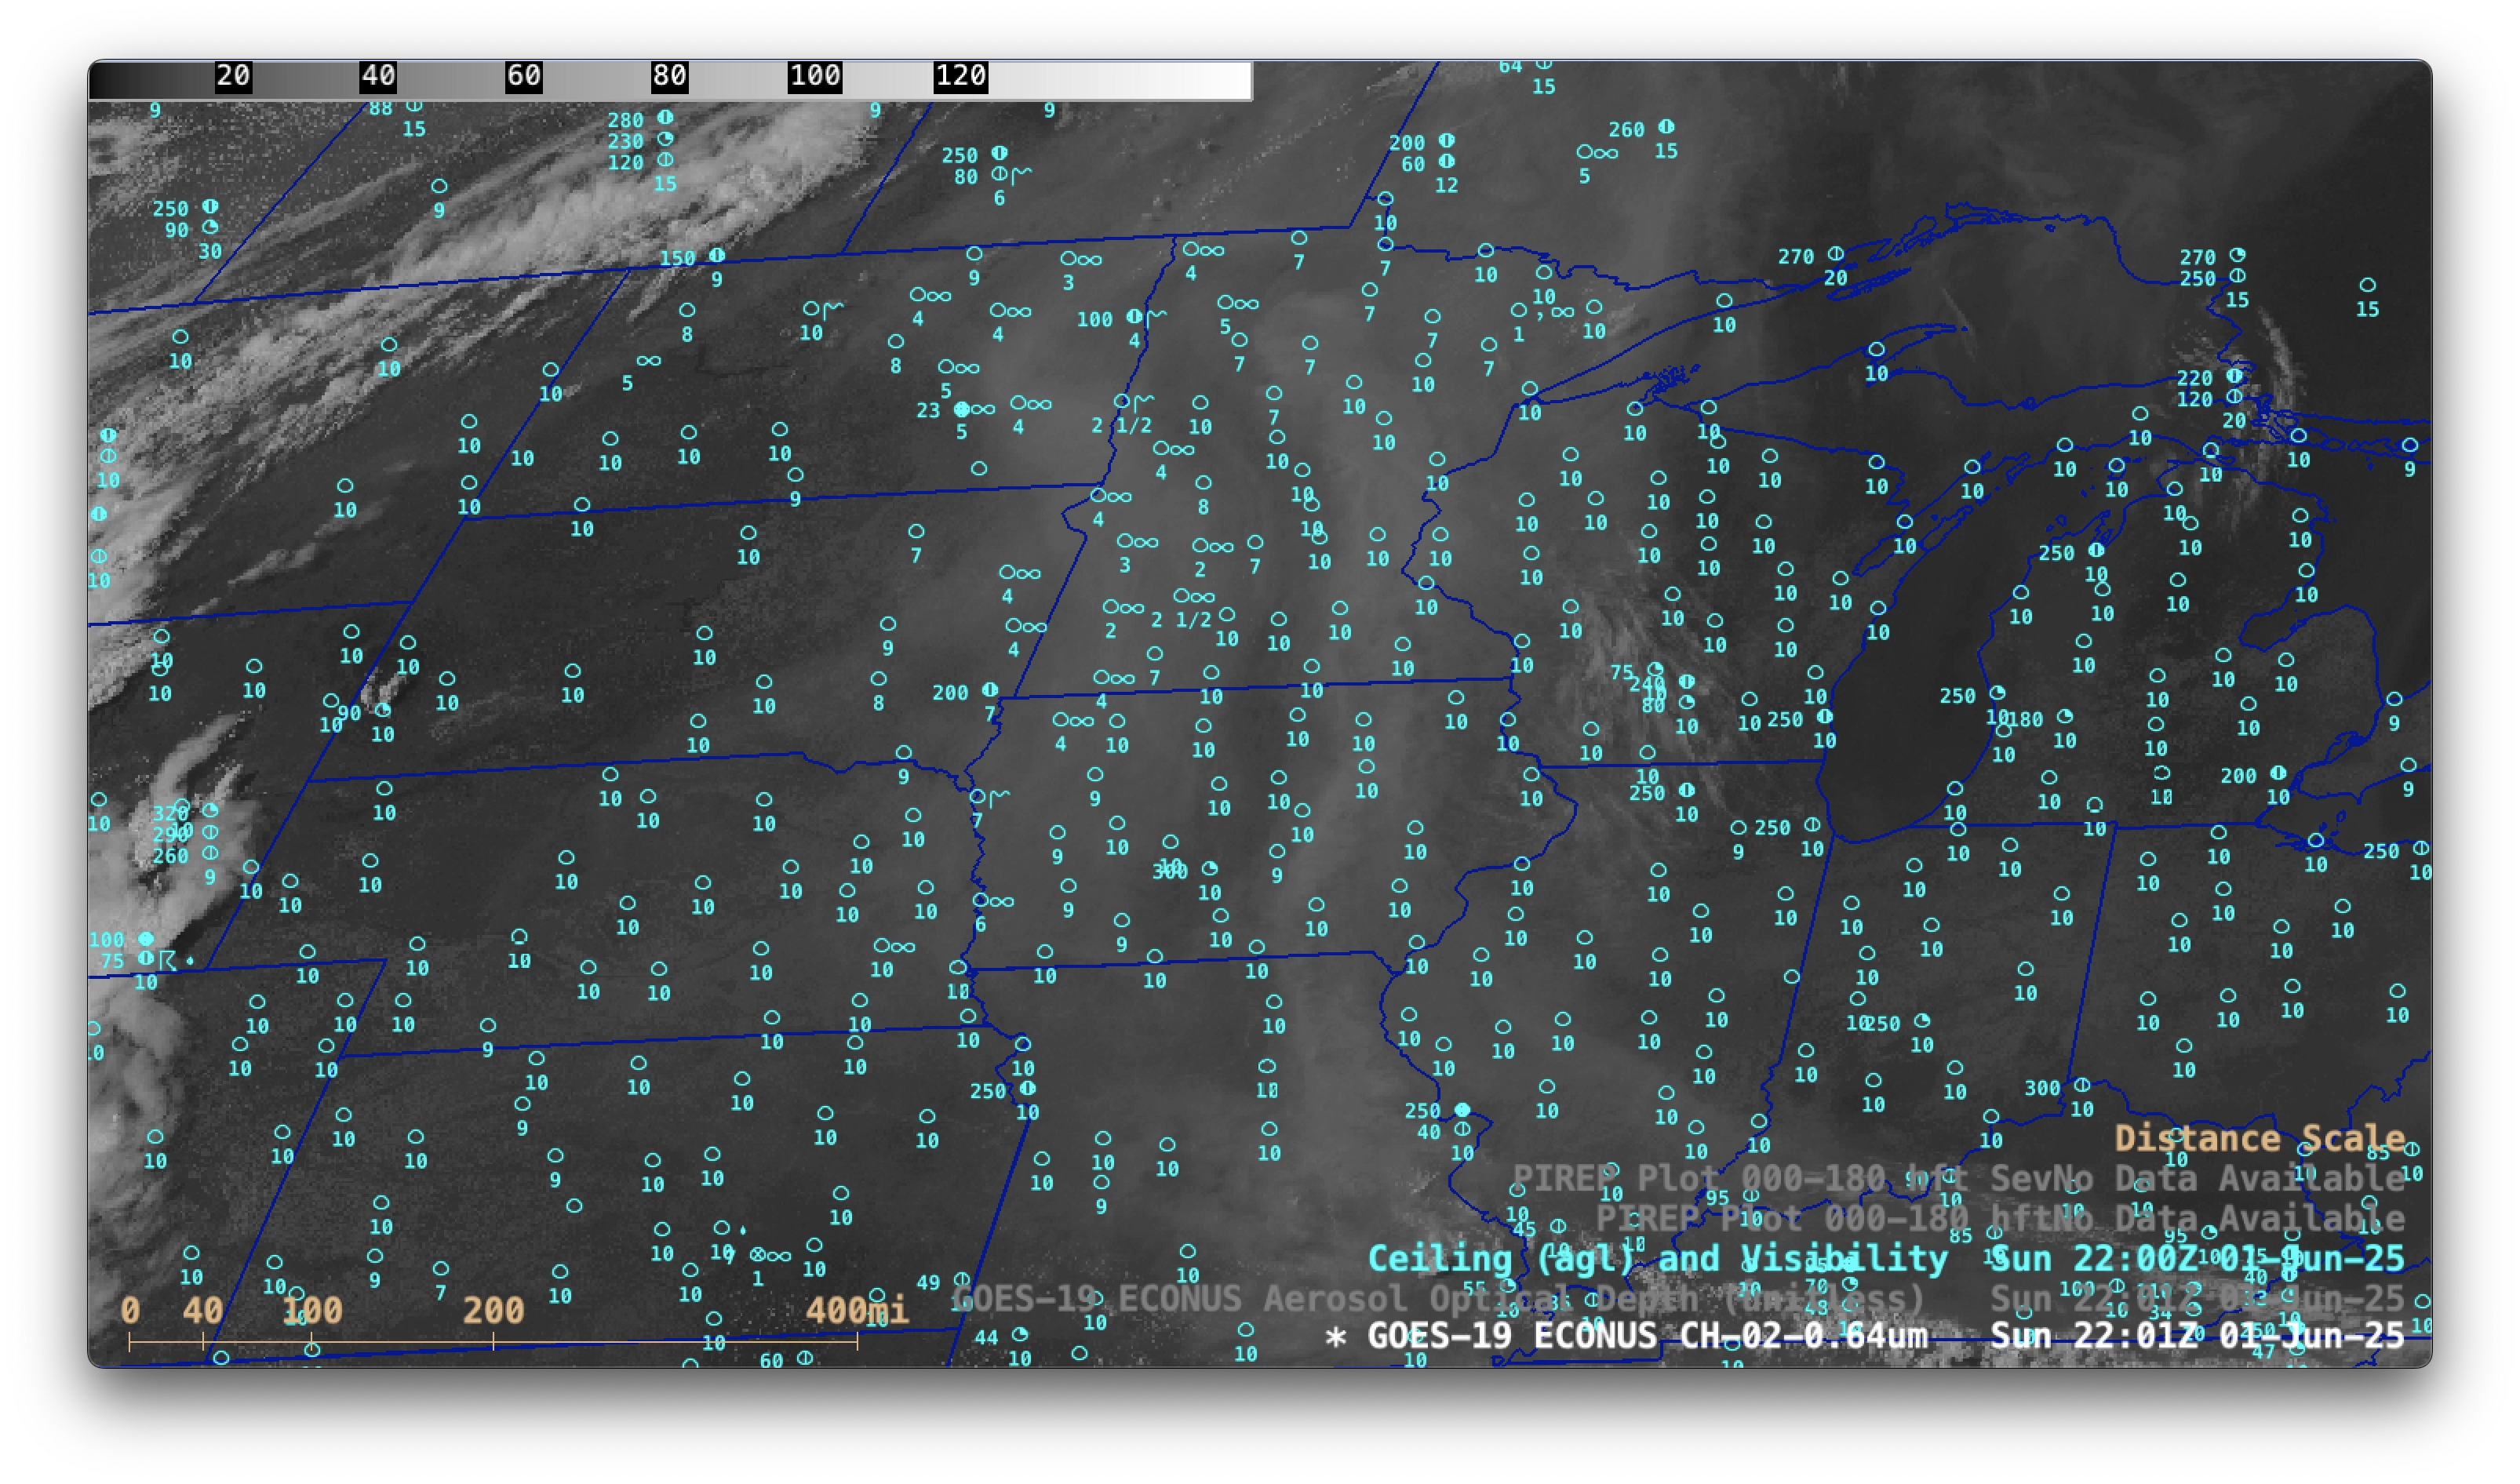
Sequence of GOES-19 Visible images and Aerosol Optical Depth derived product on 01 June, with Ceiling/Visibility observations plotted in cyan [click to play MP4 animation]

GOES-19 Visible image at 1456 UTC on 01 June, with cursor sampling of the surface report and a Pilot Report over Sioux Falls SD [click to enlarge]
View only this post Read Less


