
GOES-16 ABI and GLM data posted on this page are preliminary, non-operational and are undergoing testing The GOES-16 Geostationary Lightning Mapper (GLM) has achieved Beta Maturity and is being distributed via GOES Rebroadcast (GRB). A release of McIDAS-X slated for September 2017 has a GLM display, prototyped above. GLM data processing... Read More
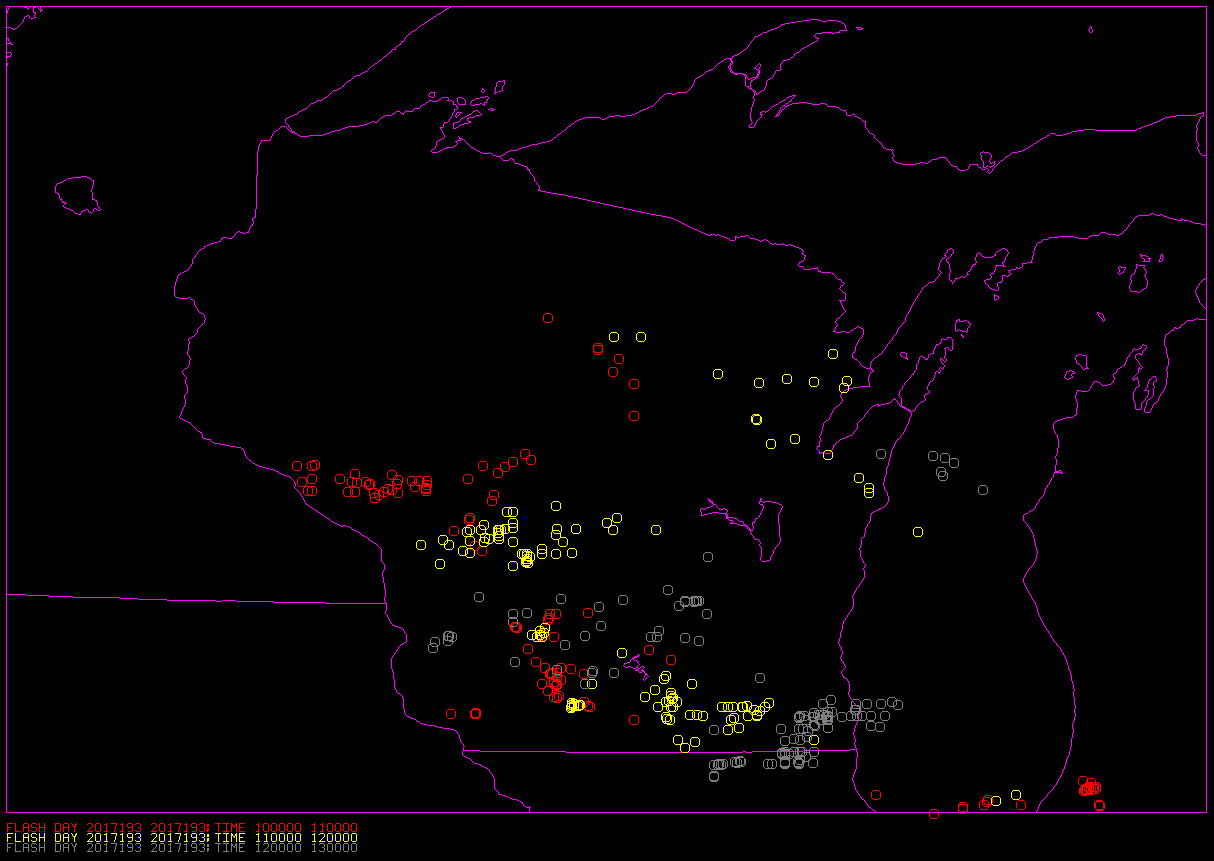
GOES-16 ABI Clean Window (10.3 µm) imagery at 1002 UTC, along with GLM Lightning Observations of Events, Groups, and Flashes from 0959-1000 UTC (Yellow), 1000-1001 UTC (Green) and 1001-1002 UTC (Red). [Click to enlarge]
The GOES-16 Geostationary Lightning Mapper (GLM) has achieved Beta Maturity and is being distributed via GOES Rebroadcast (GRB). A release of McIDAS-X slated for September 2017 has a GLM display, prototyped above. GLM data processing in the Ground System groups lightning flashes from smallest increments (Events), to aggregates of Events (Groups) to aggregates of Groups (Flashes). Thus, Events, as shown above, are on a rectangular grid wherein each gridpoint is a GLM Field of View. Groups are plotted at the centroid of the Events that comprise the Group, and Flashes are plotted as the centroid of the Groups that comprise the Flash. Typically, the number of Events is greater than the number of Groups, which is greater than the number of Flashes.
Convection developing over east-central Illinois and west-central Indiana this morning at 1002 UTC (as depicted by the 10.3 µm imagery, above) was electrically active. Events, Groups and Flashes are shown for 1-minute increments. For this particular (small) increment of time, the large convective complex over central Indiana was electrically quiet. (Here is an animation that shows a similar scene — but with three events, groups and flashes grouped in 5-minute intervals rather than 1).
Note: The ‘+’ sign used in the plot does not describe the electrical polarity of the flash; GLM cannot distinguish positive from negative activity.
View only this post
Read Less
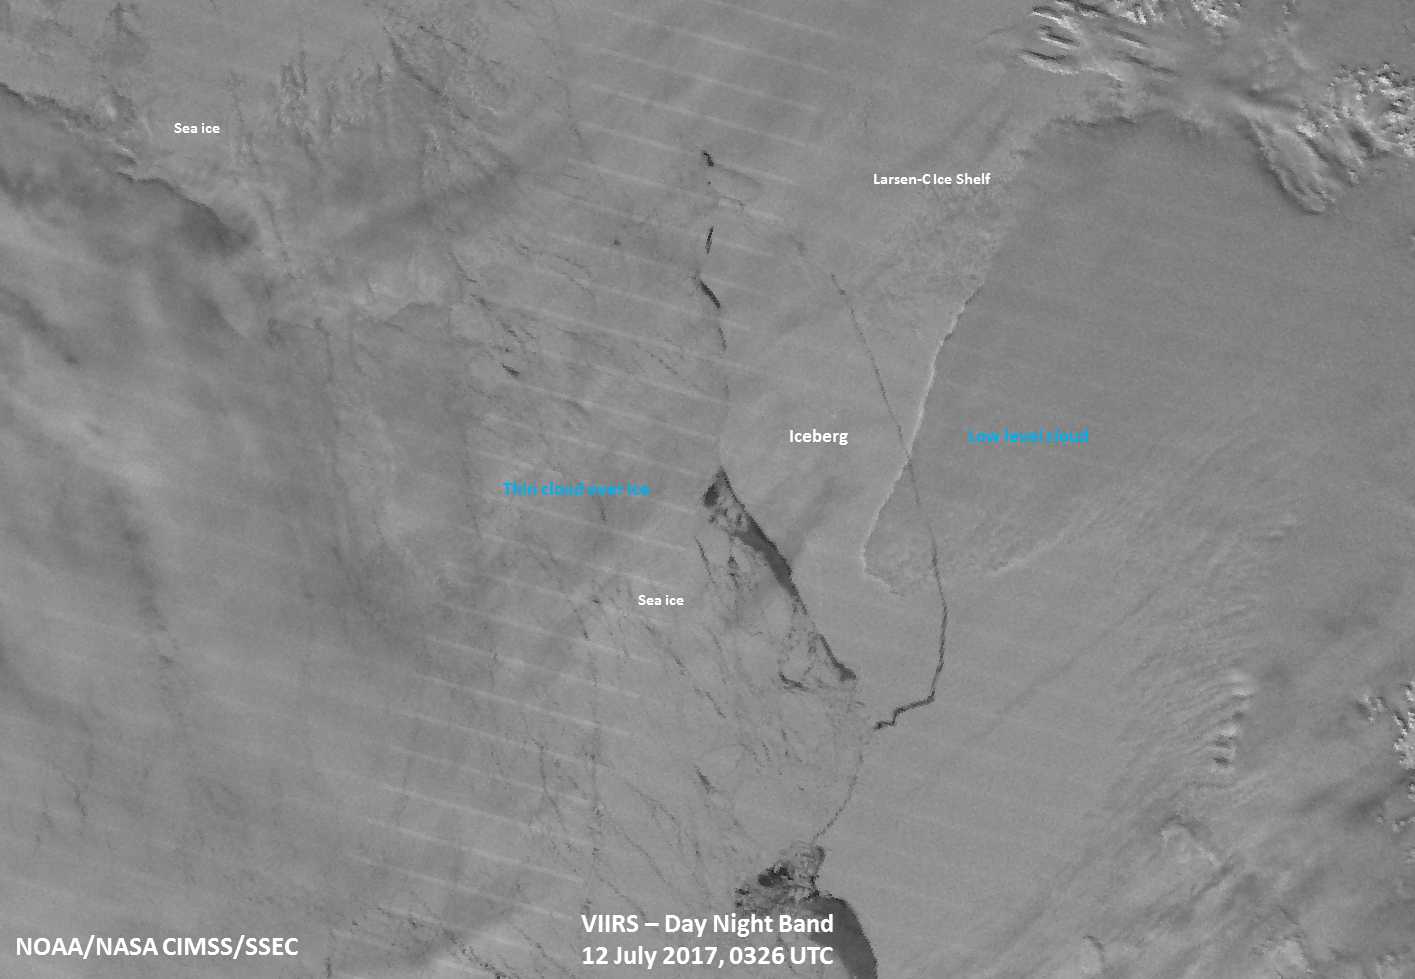
![Suomi NPP VIIRS Day/Night Band (0.7 µm) and Infrared Window (11.45 µm) images [click to enlarge]](https://cimss.ssec.wisc.edu/satellite-blog/wp-content/uploads/sites/5/2017/07/170712_0326z_viirs_DayNightBand_Infrared_Larsen_C_iceberg_anim.gif)
![12 July vs 13 July Suomi NPP VIIRS Infrared Window (11.45 µm) images [click to enlarge]](https://cimss.ssec.wisc.edu/satellite-blog/wp-content/uploads/sites/5/2017/07/170712_170713_viirs_Infrared_Larsen_C_iceberg_anim.gif)
![12 July vs 13 July Suomi NPP VIIRS Day/Night Band (0.7 µm) images [click to enlarge]](https://cimss.ssec.wisc.edu/satellite-blog/wp-content/uploads/sites/5/2017/07/170712_170713_viirs_DayNightBand_Larsen_C_iceberg_anim.gif)
![GOES-16 Visible (0.6 µm, left) and Infrared Window (10.3 µm, right) images, with SPC storm reports plotted in red (on Visible) and black (on Infrared) [click to play MP4 animation]](https://cimss.ssec.wisc.edu/satellite-blog/wp-content/uploads/sites/5/2017/07/958x638_GOES16A_B213_G16_VIS_IR_MESO_ND_MN_SVR_11JUL2017_2017193_010326_0002PANELS.GIF)
![GOES-16 Visible (0.64 µm, top) and Infrared Window (10.3 µm, bottom) images, with SPC storm reports plotted in red (on Visible) and black (on Infrared) [click to play MP4 animation]](https://cimss.ssec.wisc.edu/satellite-blog/wp-content/uploads/sites/5/2017/07/G16_VIS_IR_SD_MN_11JUL2017_480x1280_B213_2017193_004726_0002PANELS.GIF)
