![GOES-16 Visible (0.64 µm) Imagery [click to play animated gif]](https://cimss.ssec.wisc.edu/satellite-blog/wp-content/uploads/sites/5/2017/07/RedVisLakeSuperiorFog-20170710_101218_194718anim.gif )
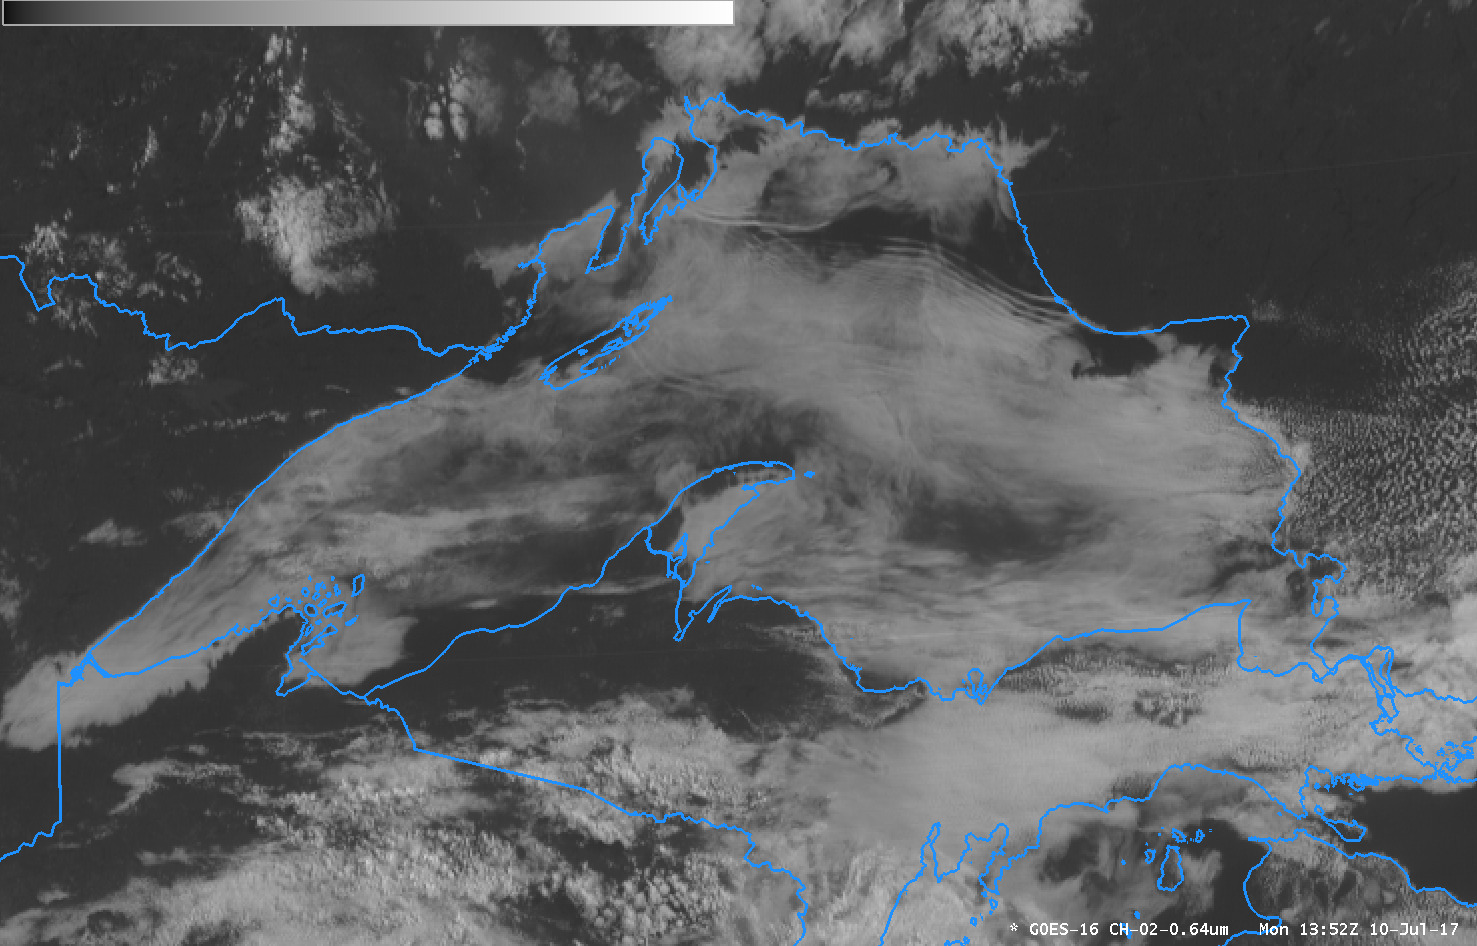
GOES-16 Visible (0.64 µm) Imagery [click to play animated gif]
High Dewpoints in mid-Summer in the Upper Midwest often leads to stratus and fog over Lake Superior. Such was the case on 10 July 2017, with dewpoints in the 50s and 60s F (GOES-16 Visible images with surface observations) and mid-lake water temperatures as cold as 40º F (buoy reports | MODIS SST values) — and very interesting waves were observed in the stratus deck. They had the appearance of Atmospheric Bores: parallel lines of clouds moving in one direction. It is unusual to have Bores moving in different directions at the same time, however.
One possible explanation for the differing motion of these undular bores could be internal reflection off the rugged northern and southern shorelines of Lake Superior.
The RTMA surface wind analyses at 17 UTC and 19 UTC, below, showed complex flow patterns over the lake — however, the surface wind flow did not always correspond well to the motion of the undular bores.
![Terra MODIS Visible (0.65 µm) image, with RTMA surface winds [click to enlarge]](https://cimss.ssec.wisc.edu/satellite-blog/wp-content/uploads/sites/5/2017/07/170710_terra_modis_visible_rtma_surface_winds_anim.gif)
Terra MODIS Visible (0.65 µm) image, with RTMA surface winds [click to enlarge]
![Aqua MODIS Visible (0.65 µm) image, with RTMA surface winds [click to enlarge]](https://cimss.ssec.wisc.edu/satellite-blog/wp-content/uploads/sites/5/2017/07/170710_aqua_modis_visible_rtma_surface_winds_anim.gif)
Aqua MODIS Visible (0.65 µm) image, with RTMA surface winds [click to enlarge]
View only this post Read Less

![GOES-16 Visible (0.64 µm) and Shortwave Infrared (3.9 µm) images, with hourly surface plots [click to play MP4 animation]](https://cimss.ssec.wisc.edu/satellite-blog/wp-content/uploads/sites/5/2017/07/958x638_GOES16A_B27_G16_VIS_SWIR_CA_FIRES_08JUL2017_2017190_024718_0002PANELS.GIF)
![GOES-16 Visible (0.64 µm, left), Near-Infrared Cirrus (1.38 µm, center) and Infrared Window (10.3 µm, right) images, with station identifiers plotted in yellow [click to play MP4 animation]](https://cimss.ssec.wisc.edu/satellite-blog/wp-content/uploads/sites/5/2017/07/960x427_AGOES16_B2413_G16_3PANEL_CA_FIRES_VIS_CIRRUS_IR_08JUL2017_2017190_021718_0003PANELS.GIF)
![Suomi NPP VIIRS Day/Night Band (0.7 µm) and Shortwave Infrared (3.74 µm) images [click to enlarge]](https://cimss.ssec.wisc.edu/satellite-blog/wp-content/uploads/sites/5/2017/07/170708_0910utc_suomi_npp_viirs_DayNightBand_ShortwaveInfrared_Alamo_Fire_CA_anim.gif)
