
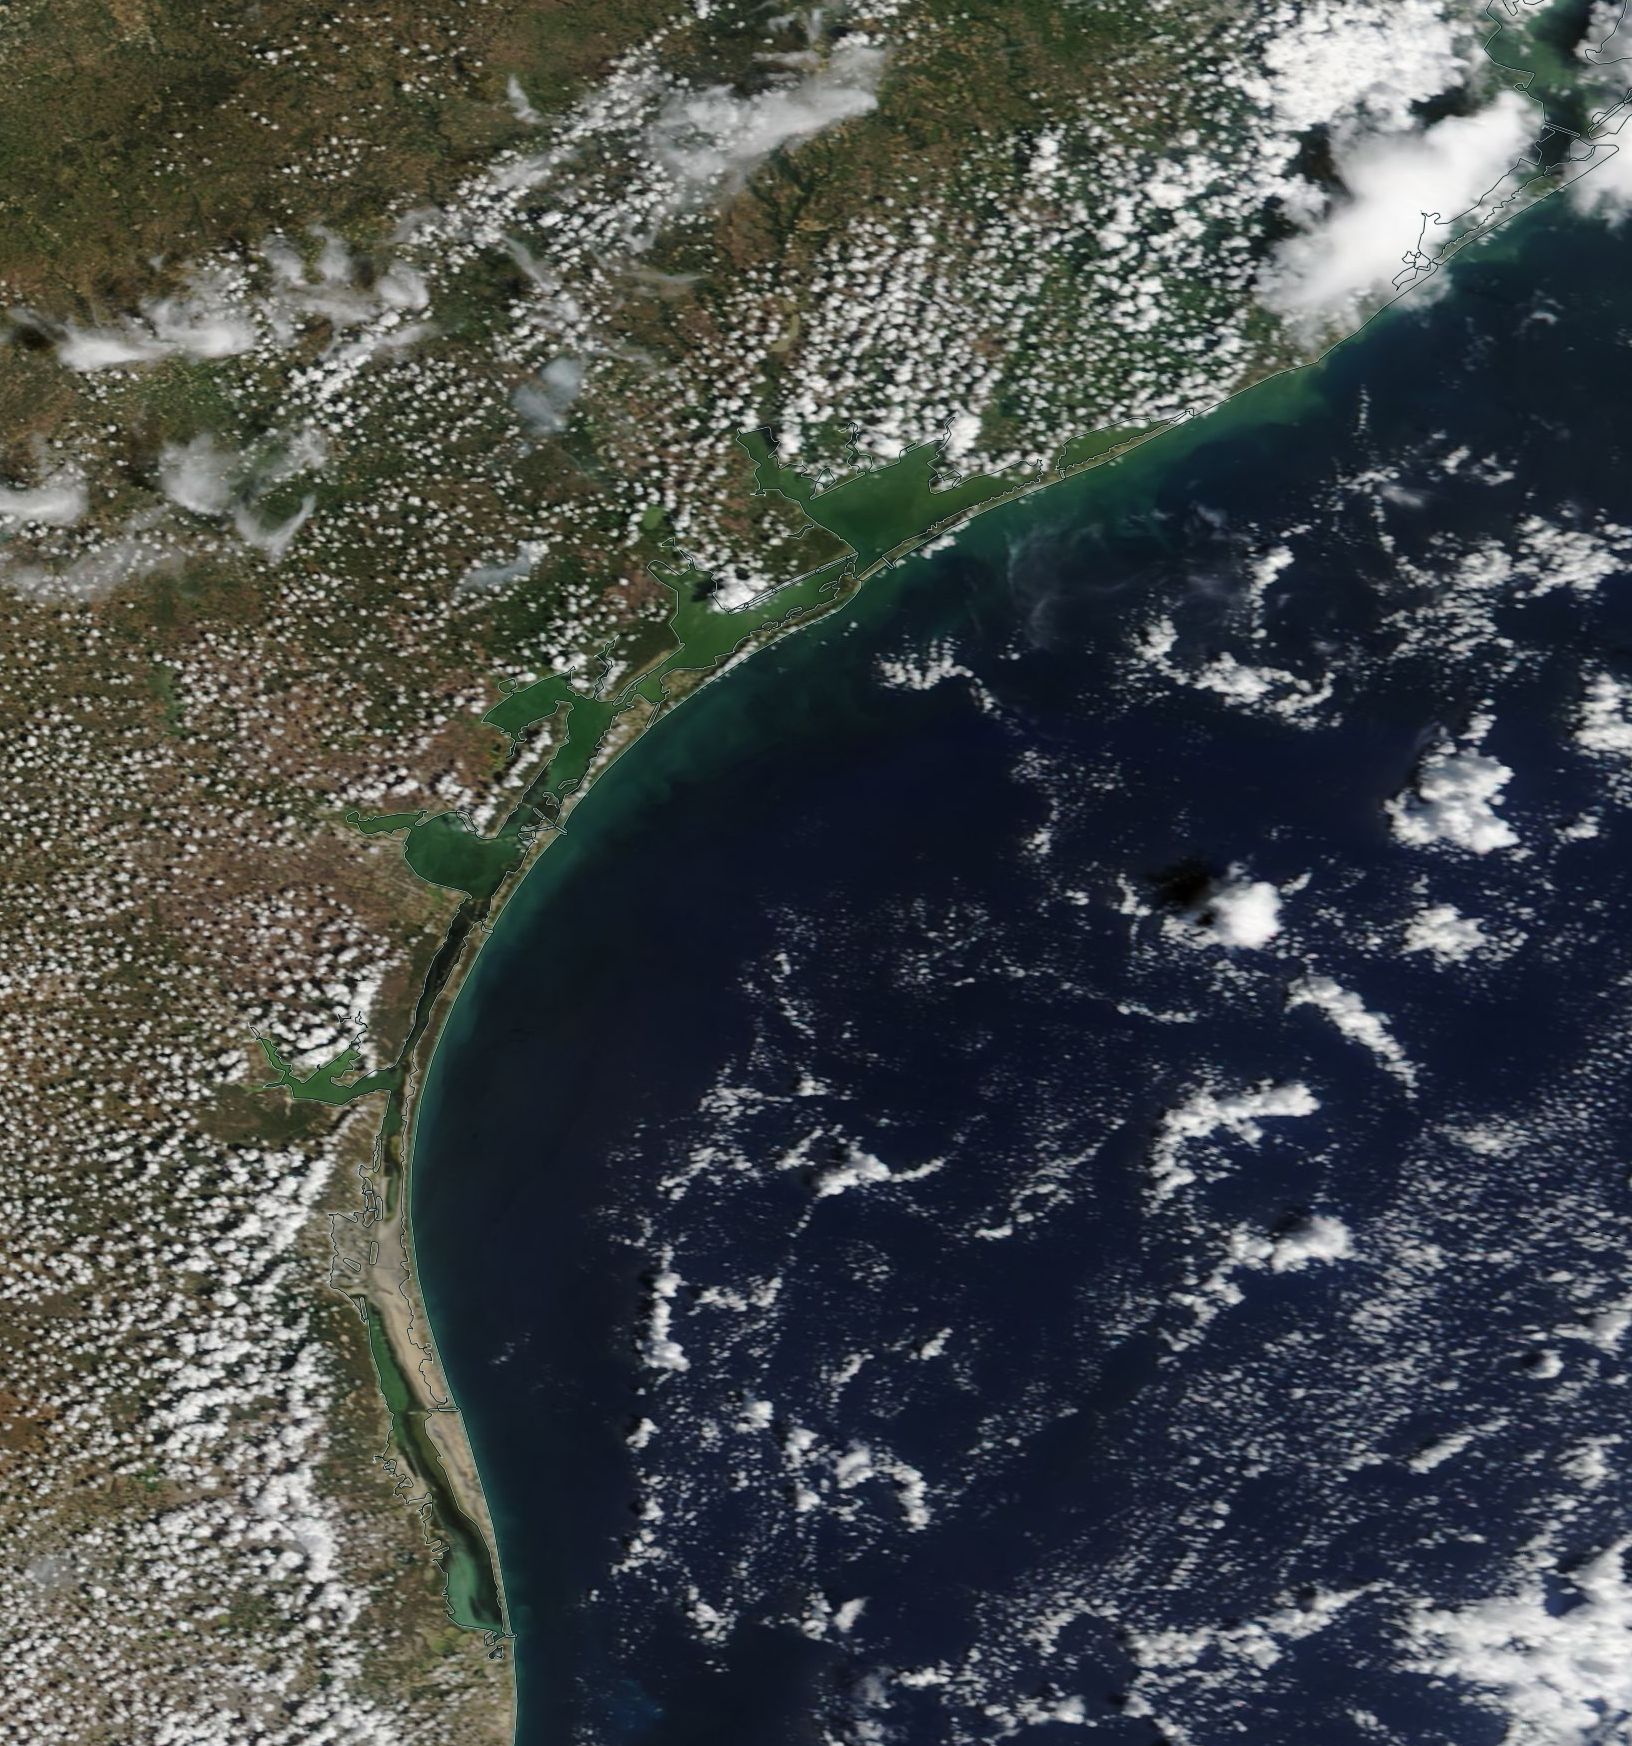
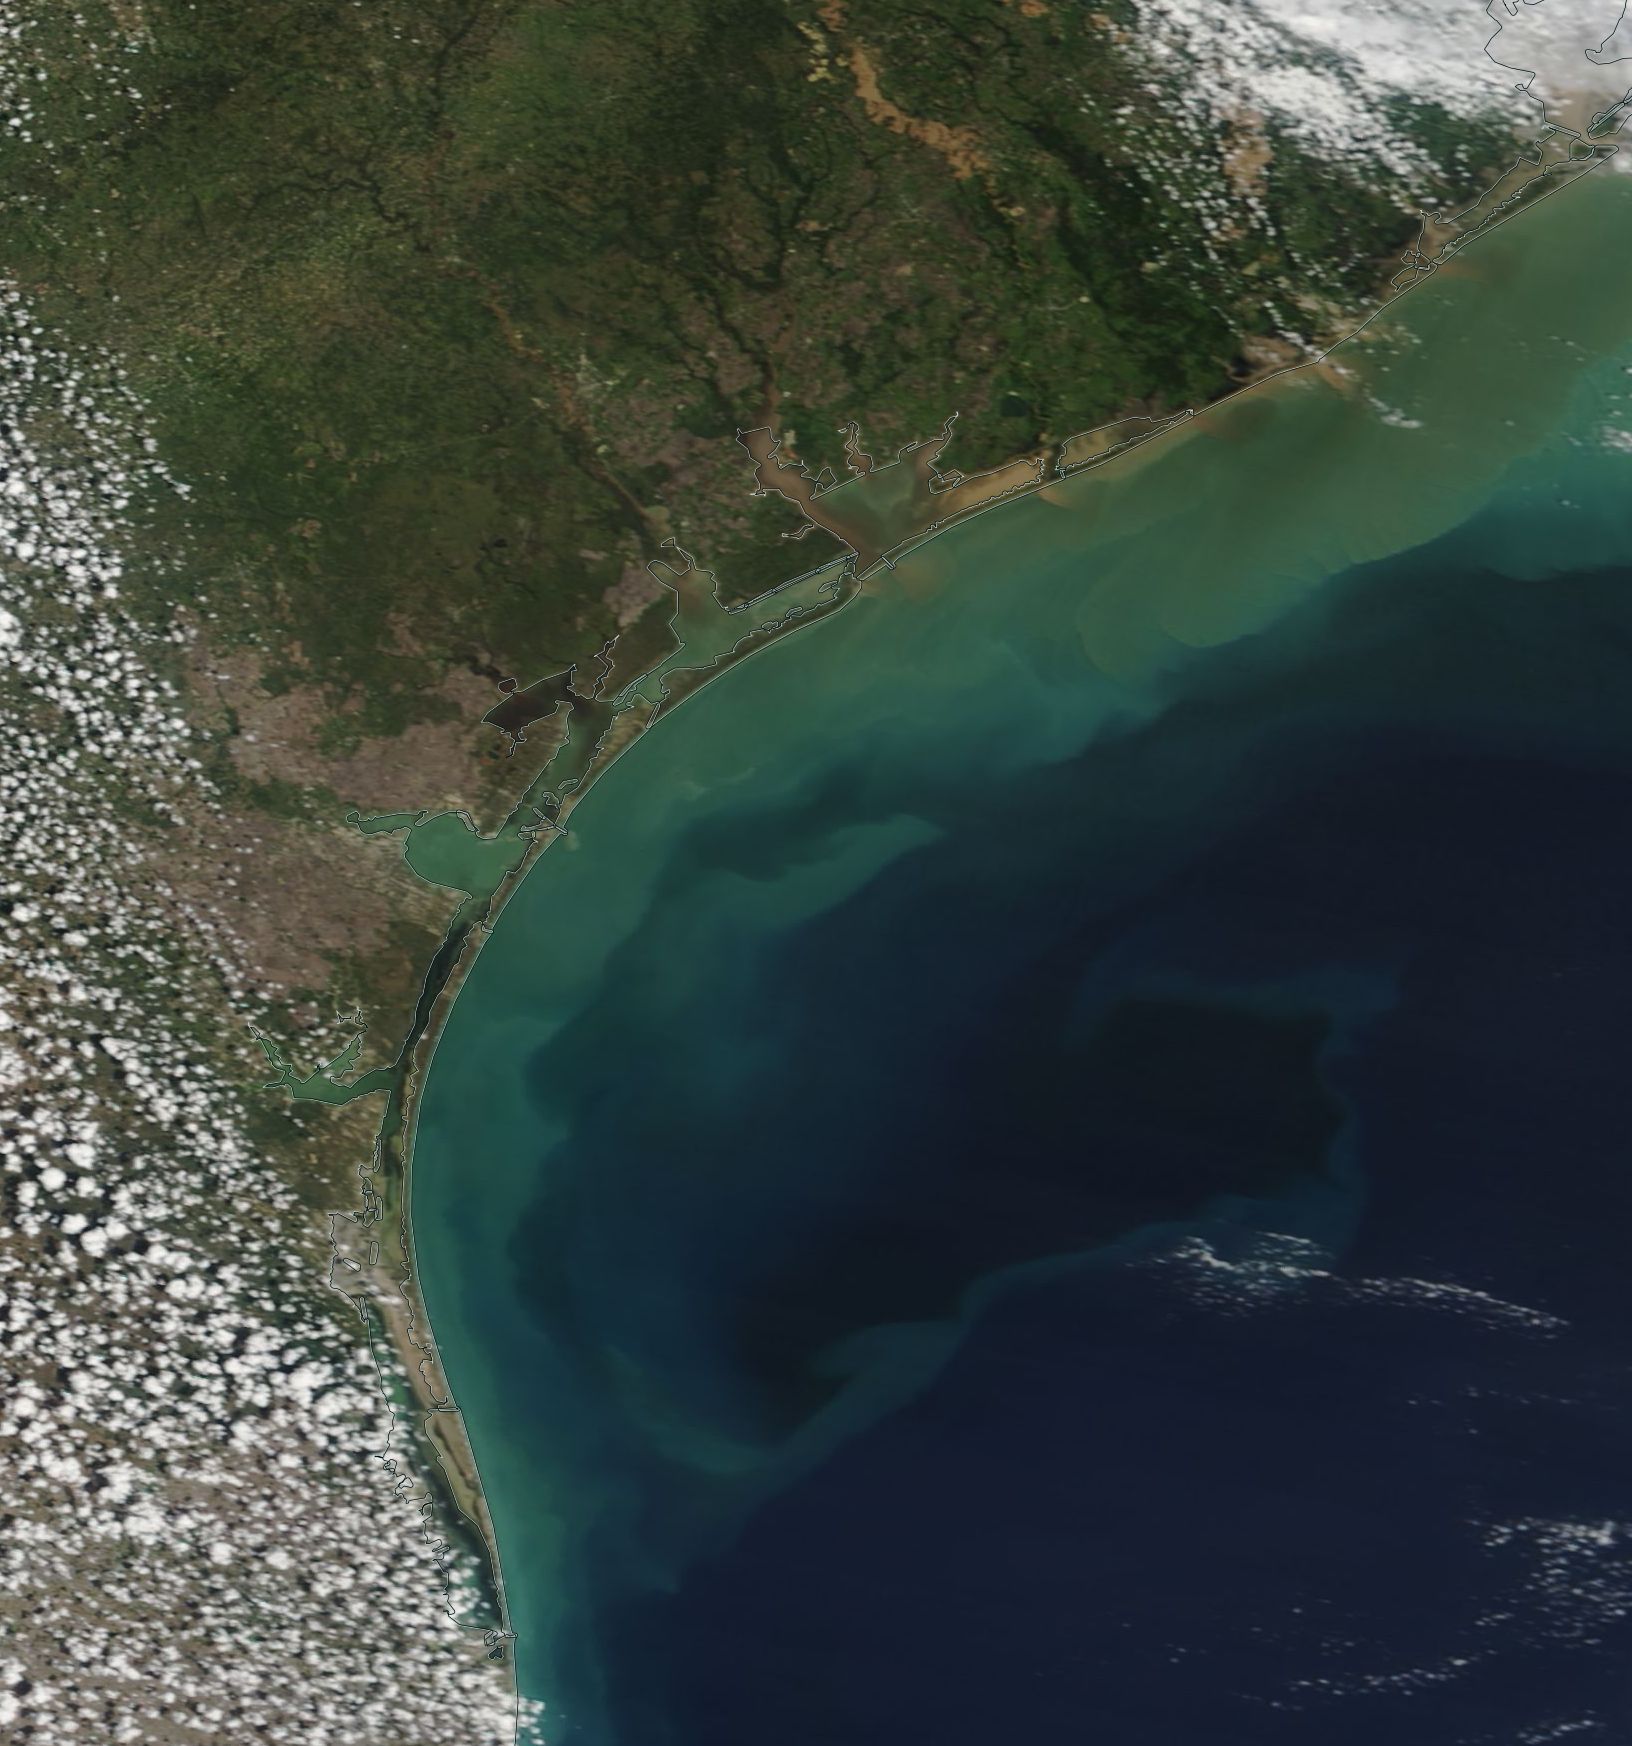
Terra MODIS True-Color imagery off the Texas Gulf Coast on 23 and 30 August, 2017 (Click to enlarge)
MODIS Today imagery from 23 August (pre-Harvey) (cropped) and 30 August (post-Harvey) (cropped), above, show an enormous increase in turbidity in the nearshore waters off the coast of Texas. Further, many of the rivers change their appearance to brown and flooding in the post-Harvey image. (River gauges in flood stage; Source)
A similar toggle using Suomi NPP VIIRS Imagery, from this site, also from 23 August and 30 August, is shown below. The increase in turbidity was due to a combination of strong winds and runoff from very heavy rainfall associated with the hurricane.

Suomi NPP True-Color imagery off the Texas Gulf Coast on 23 and 30 August, 2017 (Click to enlarge)
Suomi NPP VIIRS Products include a River Flood estimate, developed by Sanmei Li and others at George Mason University. The toggle below from RealEarth shows Suomi NPP VIIRS True Color at 1904 UTC, and the River Flood Product for the same time.

Suomi NPP VIIRS True-Color imagery off the Texas Gulf Coast, 1904 UTC on 30 August, 2017, and the Suomi NPP River Flood Product at the same time (Click to enlarge)
(Thanks to Bill Taylor and John Stoppkotte, NWS in N. Platte NE, for noting this!)
View only this post Read Less
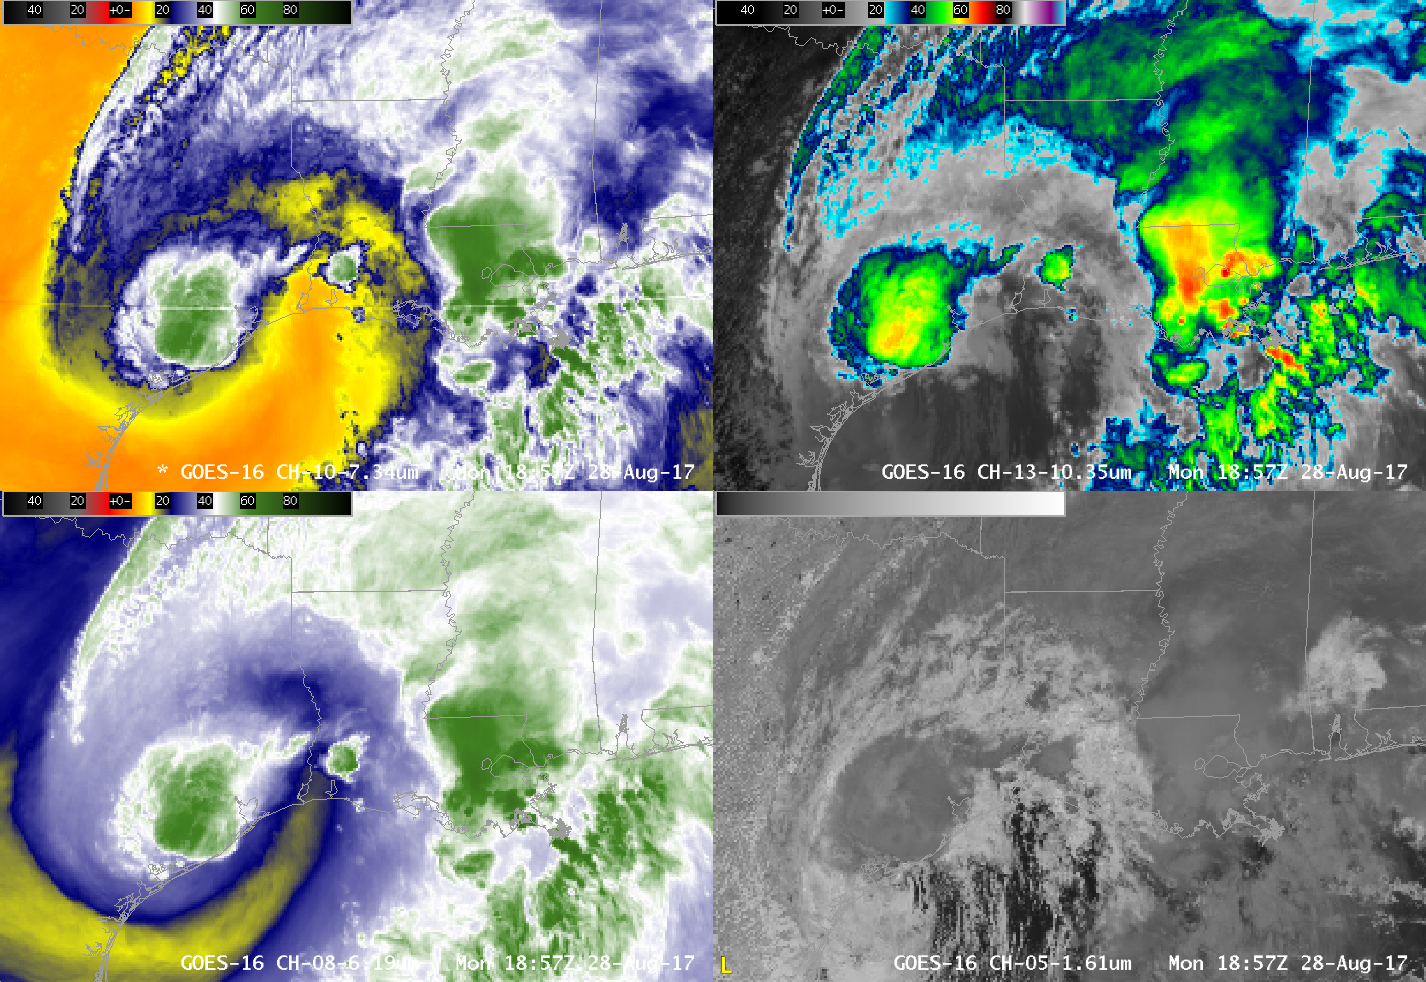

![Terra/Aqua MODIS (11.0 µm) and Suomi NPP VIIRS (11.45 µm) Infrared Window images [click to enlarge]](https://cimss.ssec.wisc.edu/satellite-blog/wp-content/uploads/sites/5/2017/08/170826_modis_viirs_infrared_Harvey_anim.gif)
