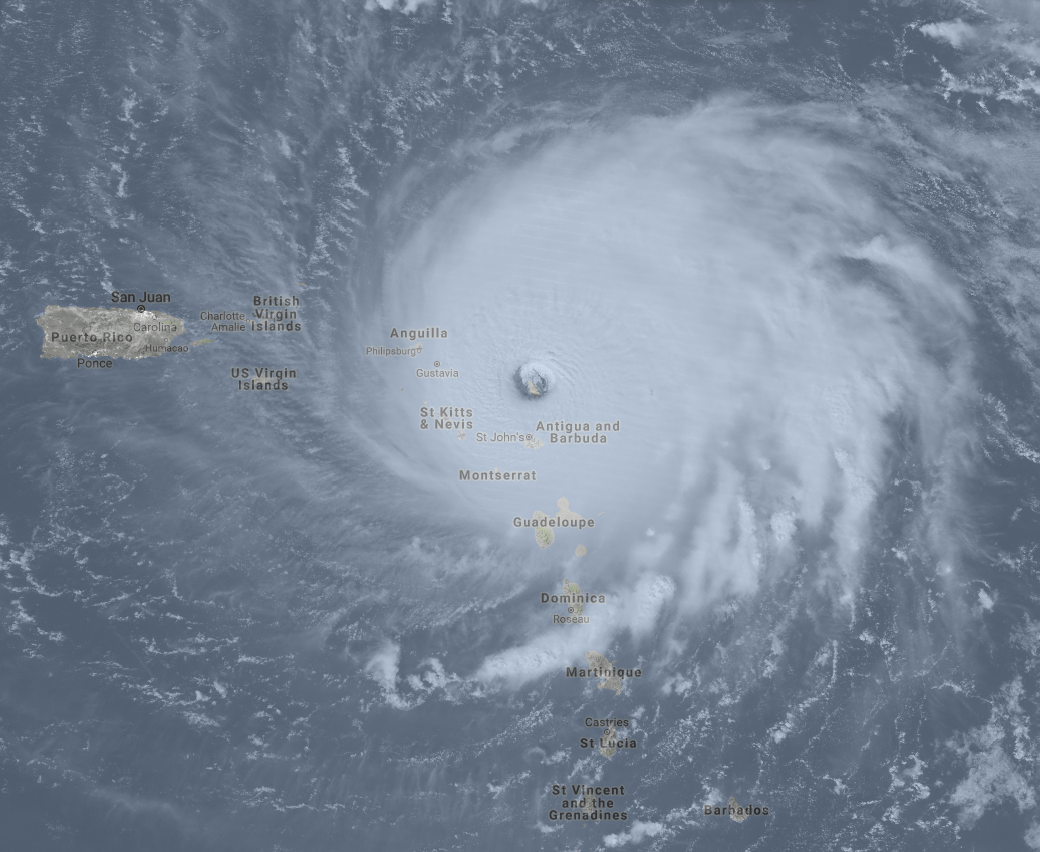
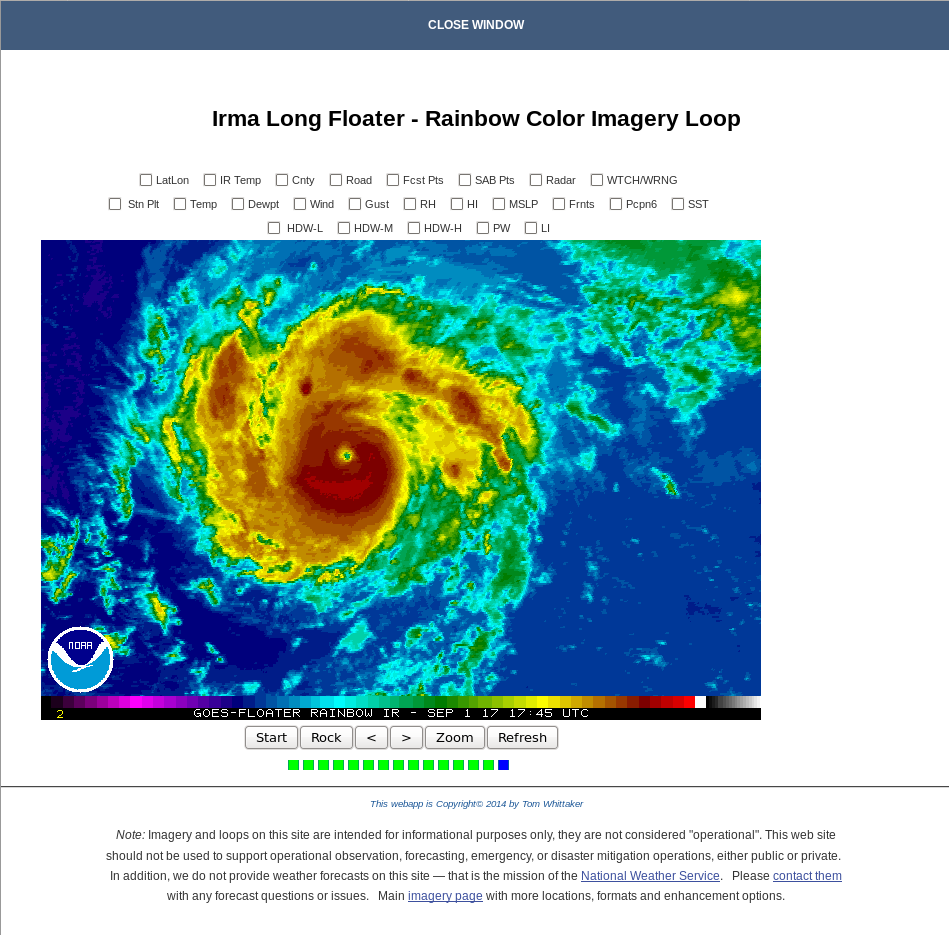
GOES-16 data posted on this page are preliminary, non-operational and are undergoing testingHurricane Irma, northeast of Antigua and Barbuda in the Lesser Antilles, achieved Category 5 status on 5 September, based on aircraft reconnaissance. The symmetric storm with a clear eye (that includes mesoscale vortices) is shown above with 1-minute... Read More
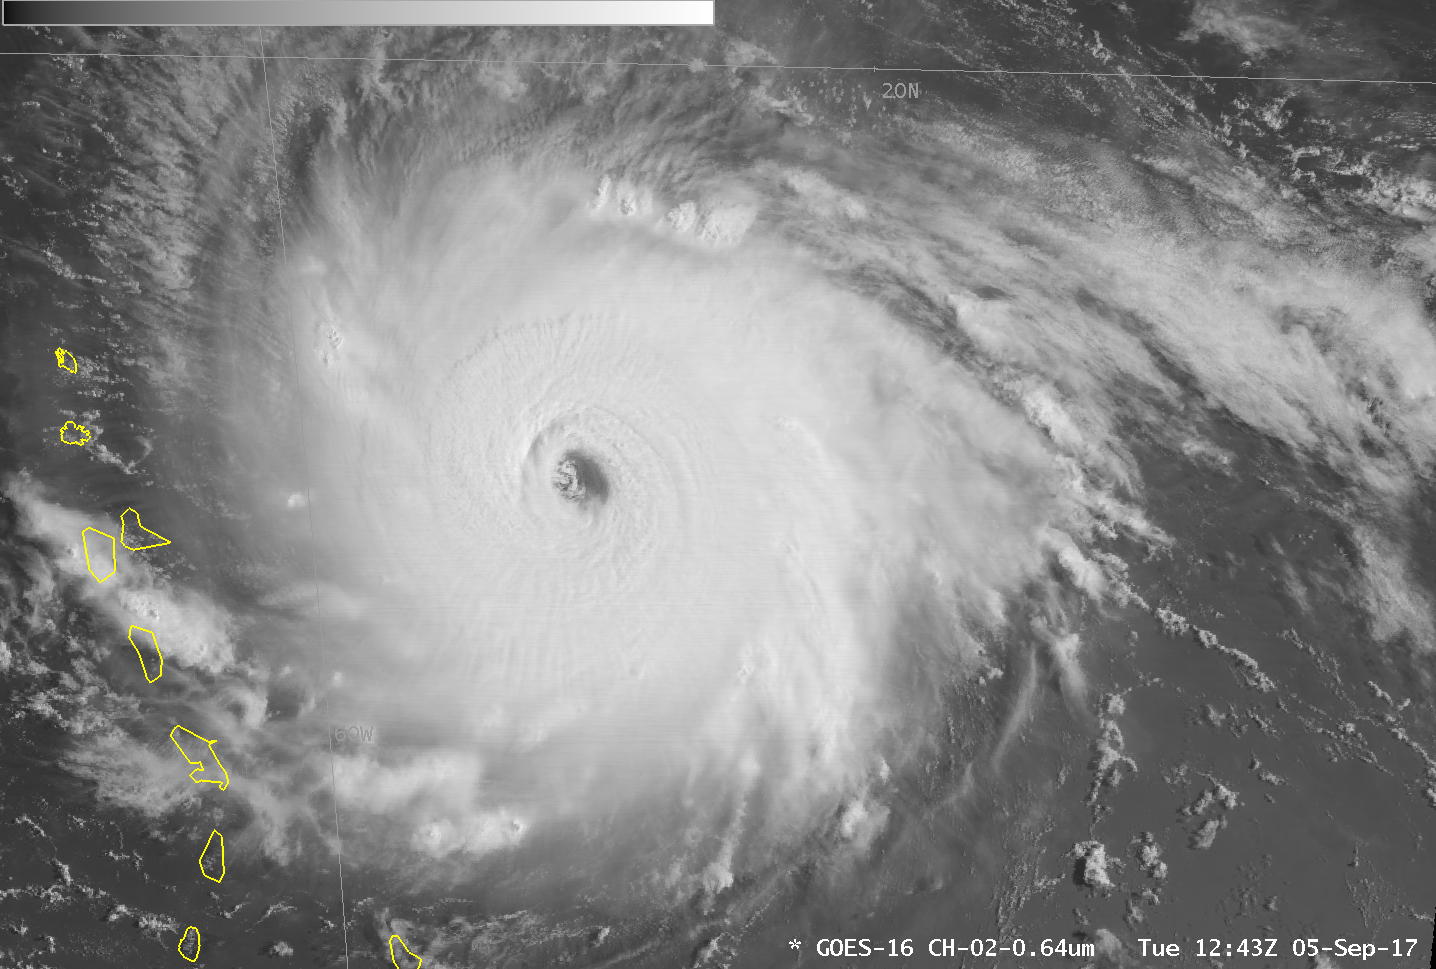
GOES-16 Visible 0.64 µm Imagery, 1144-1243 UTC on 5 September 2017 (Click to animate)
GOES-16 data posted on this page are preliminary, non-operational and are undergoing testing
Hurricane Irma, northeast of Antigua and Barbuda in the Lesser Antilles, achieved Category 5 status on 5 September, based on aircraft reconnaissance. The symmetric storm with a clear eye (that includes mesoscale vortices) is shown above with 1-minute imagery from GOES-16.
GOES-16 Geostationary Lightning Mapper data, below, shows lightning occurring in the outer bands of the storm. Two-hour animations, updated every 15 minutes, of GLM data superimposed over Visible (0.64 µm) or over Infrared (10.3 µm) imagery. are available at the links (Imagery courtesy Dave Santek, SSEC).
Note that a slightly later animation, ending at 1500 UTC, (here), shows considerable lightning activity in the eye of Irma, as does the animation ending at 1915 UTC (here). It is not unusual for strengthening tropical systems to support electrical activity in the eyewall.
GOES-16 ABI Visible (0.64 µm) every 15 minutes, 1100-1315 UTC 5 September 2017, with 3-minute increments of GLM Group data plotted (Yellow Points: oldest; Red Points: Latest) (Click to enlarge)
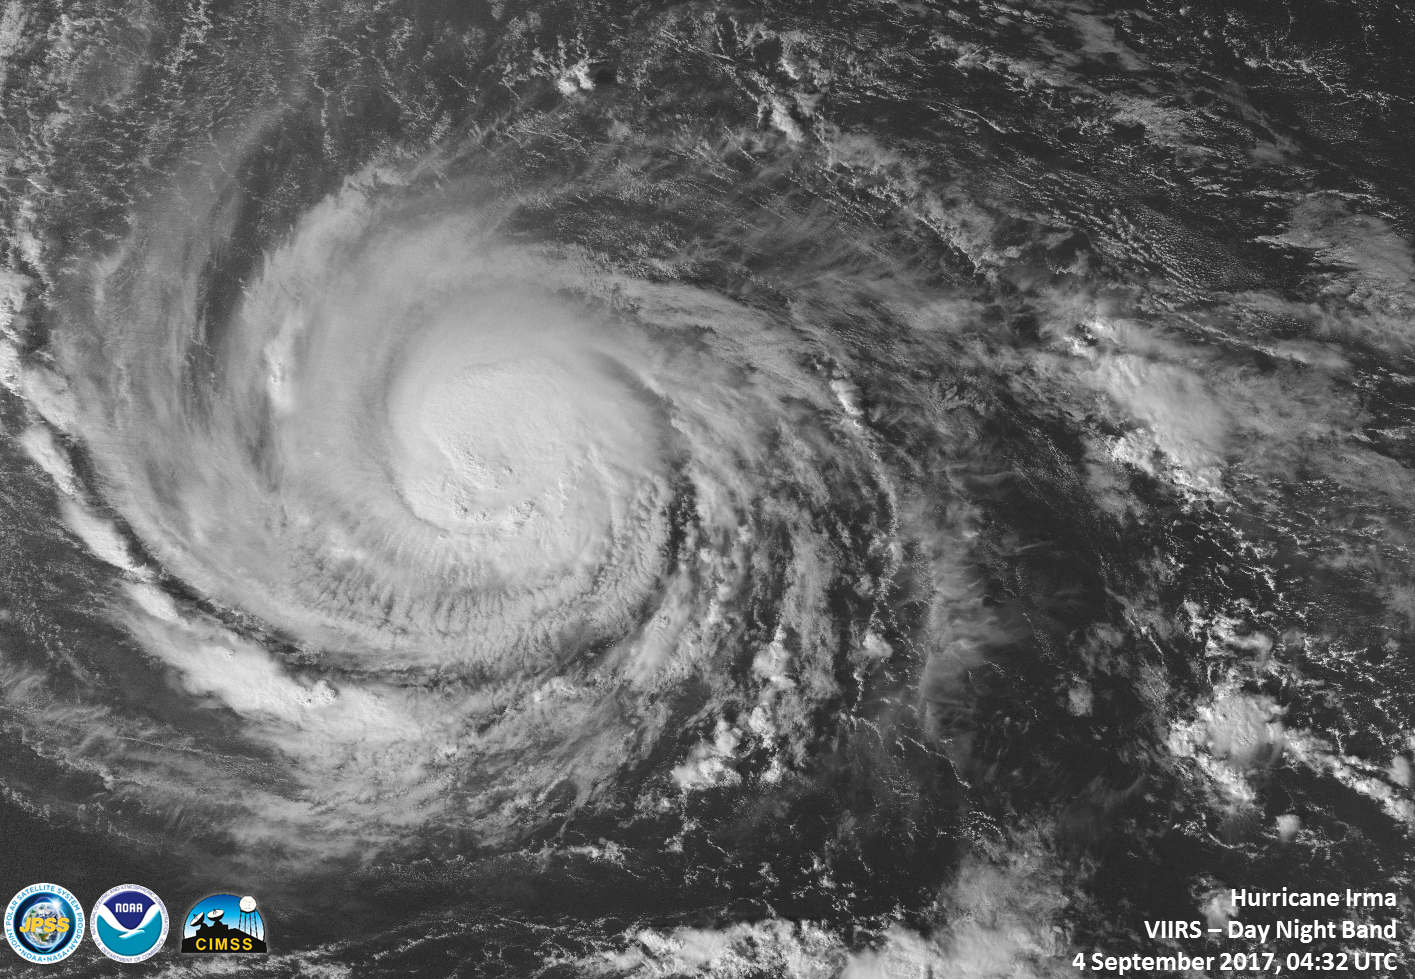
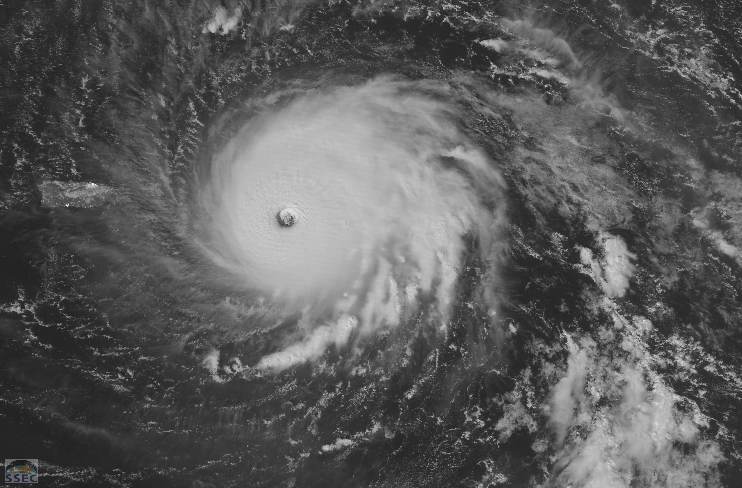
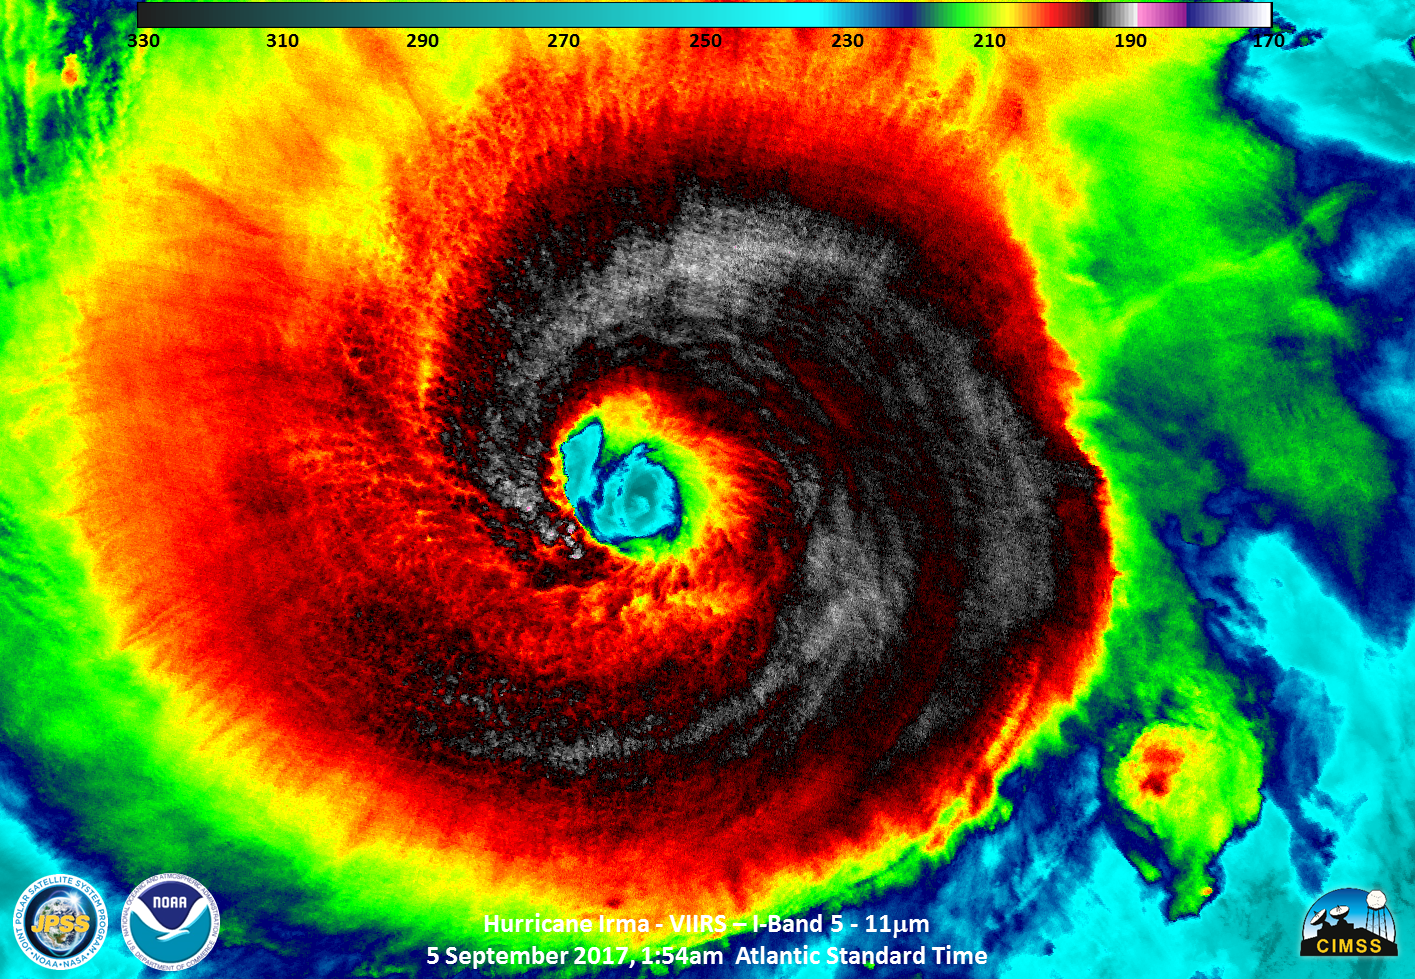
Suomi NPP overflew Irma near 0600 UTC on 5 September, when Irma was still a Category 4 storm. Two views of the storm are shown below, both toggling between the Day Night Band visible image (0.7 µm) that has excellent illumination from a near-Full Moon and the 11.45 µm Infrared Imagery.
Suomi NPP Day Night Band Visible (0.7 µm) and VIIRS Infrared (11.45 µm) imagery, 0554 UTC 5 September 2017 (Click to enlarge)
Suomi NPP Day Night Band Visible (0.7 µm) and VIIRS Infrared (11.45 µm) imagery, 0554 UTC 5 September 2017, over the eye of Hurricane Irma (Click to enlarge)
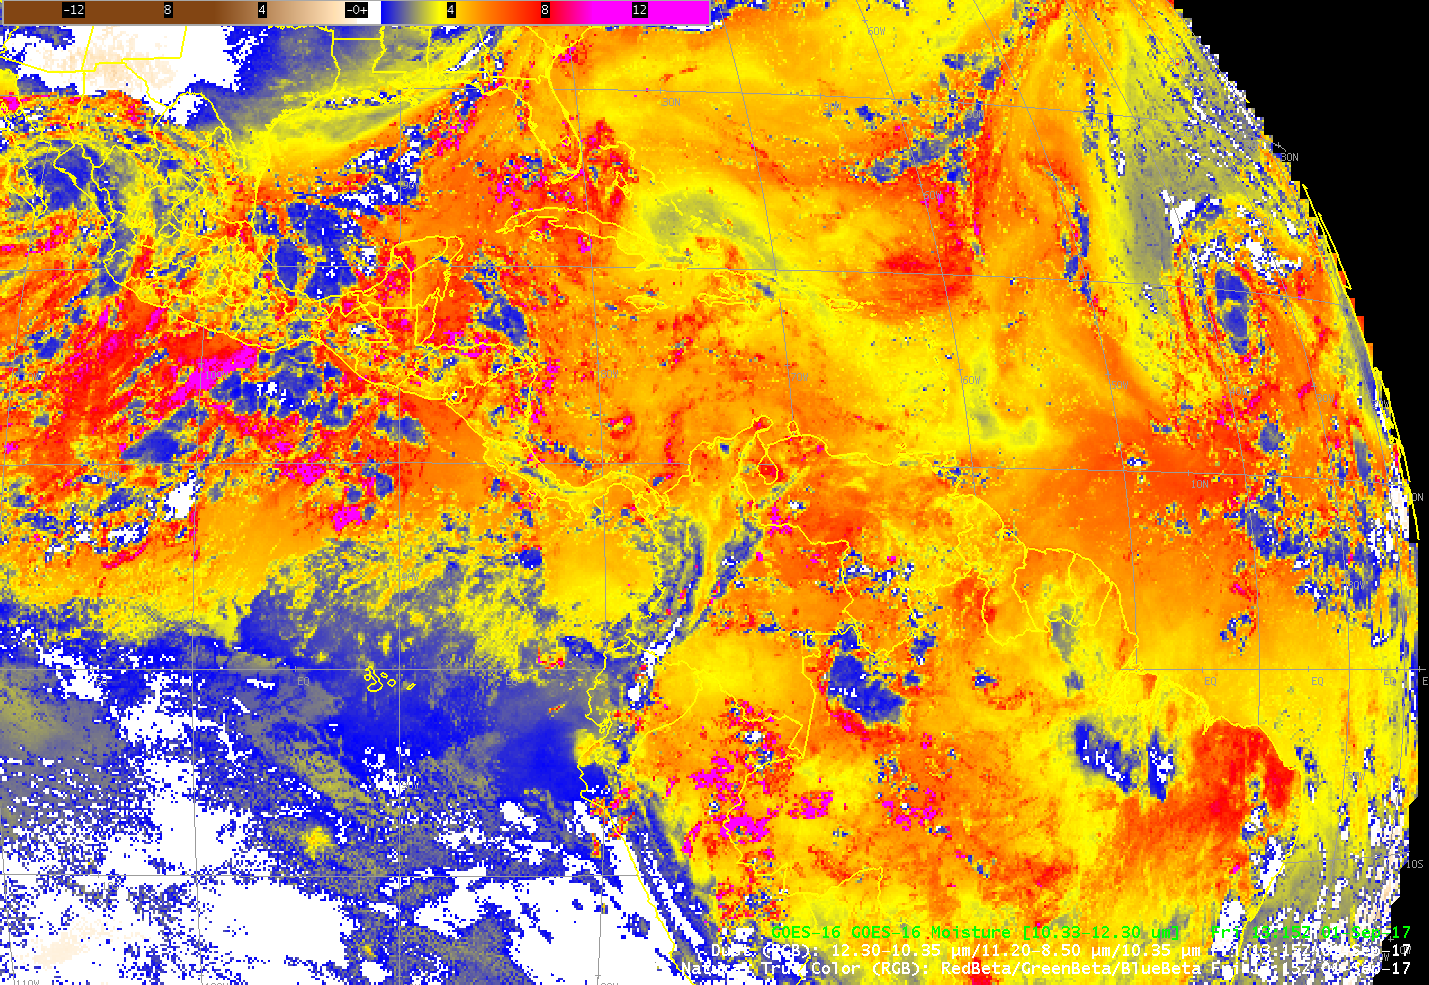
A GOES-16 late in the day on 5 September, below, shows a well-developed storm with a distinct eye
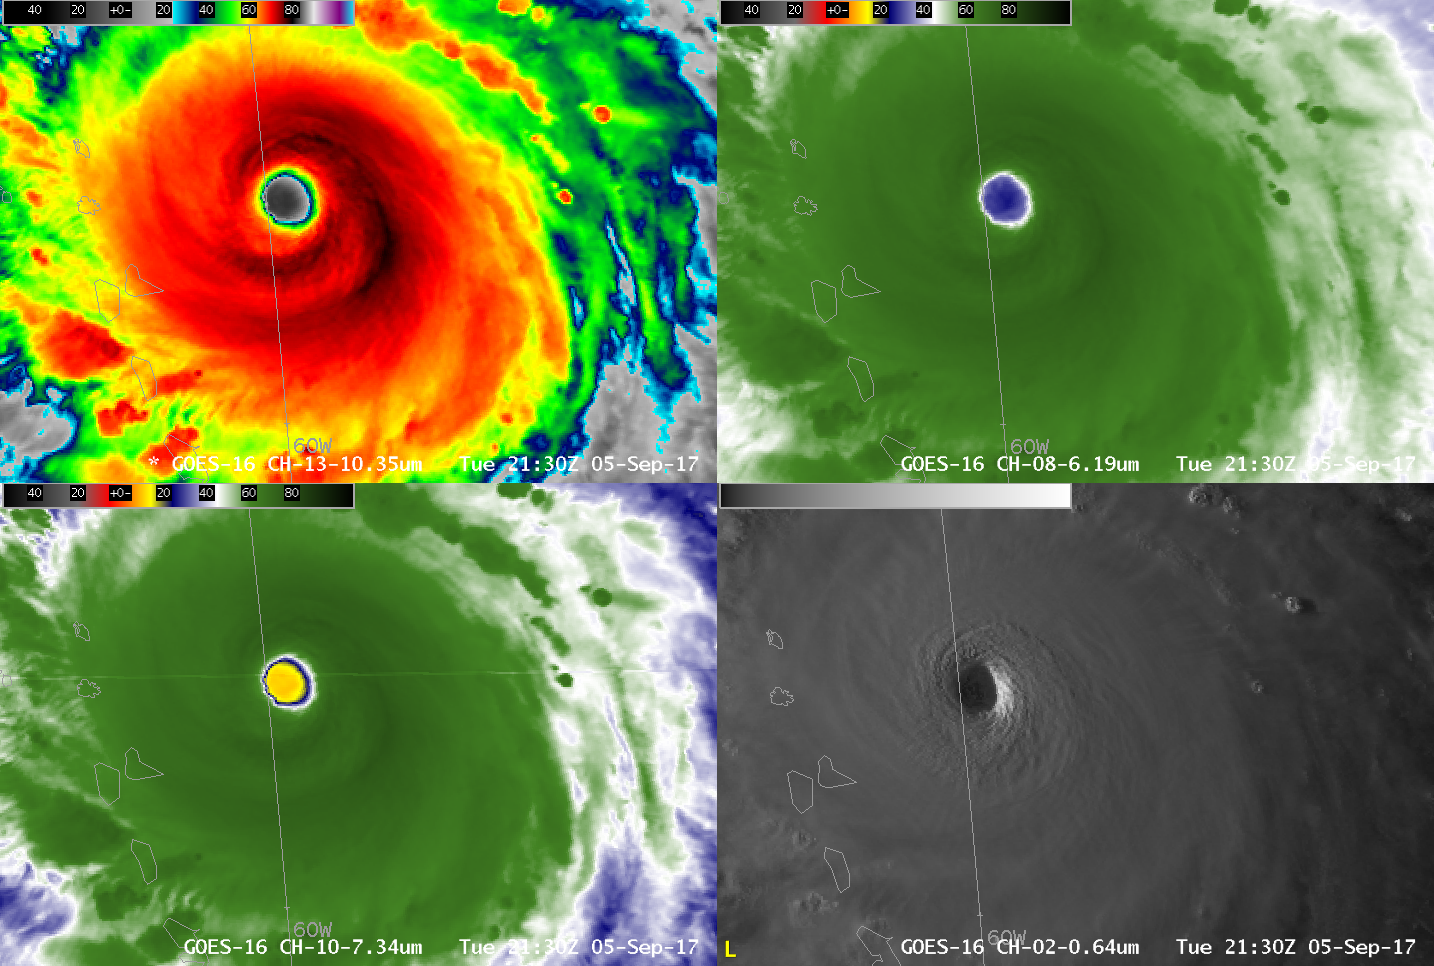
GOES-16 Infrared Imagery (10.3 µm, upper left; 6.19 µm, upper right, 7.34 µm, lower right) and Visible Imagery (0.64 µm, lower right), 2057-2143 UTC on 5 September 2017 (Click to animate)
Interests throughout the Greater Antilles, the northern Lesser Antilles, the Bahamas and the southeastern United States including Florida should be monitoring this storm closely, and preparing for its arrival. For more information, refer to the National Hurricane Center website, or the CIMSS Tropical Weather Website.
View only this post
Read Less


