* GOES-16 data posted on this page are preliminary, non-operational and are undergoing testing* GOES-16 CONUS Sector images (at 5-minute intervals) During the total solar eclipse of 21 August 2017, the lunar umbra was evident on imagery from the GOES-16 0.5 km resolution (at satellite sub-point) “Red” Visible band (0.64 µm)... Read More
* GOES-16 data posted on this page are preliminary, non-operational and are undergoing testing*
GOES-16 CONUS Sector images (at 5-minute intervals)
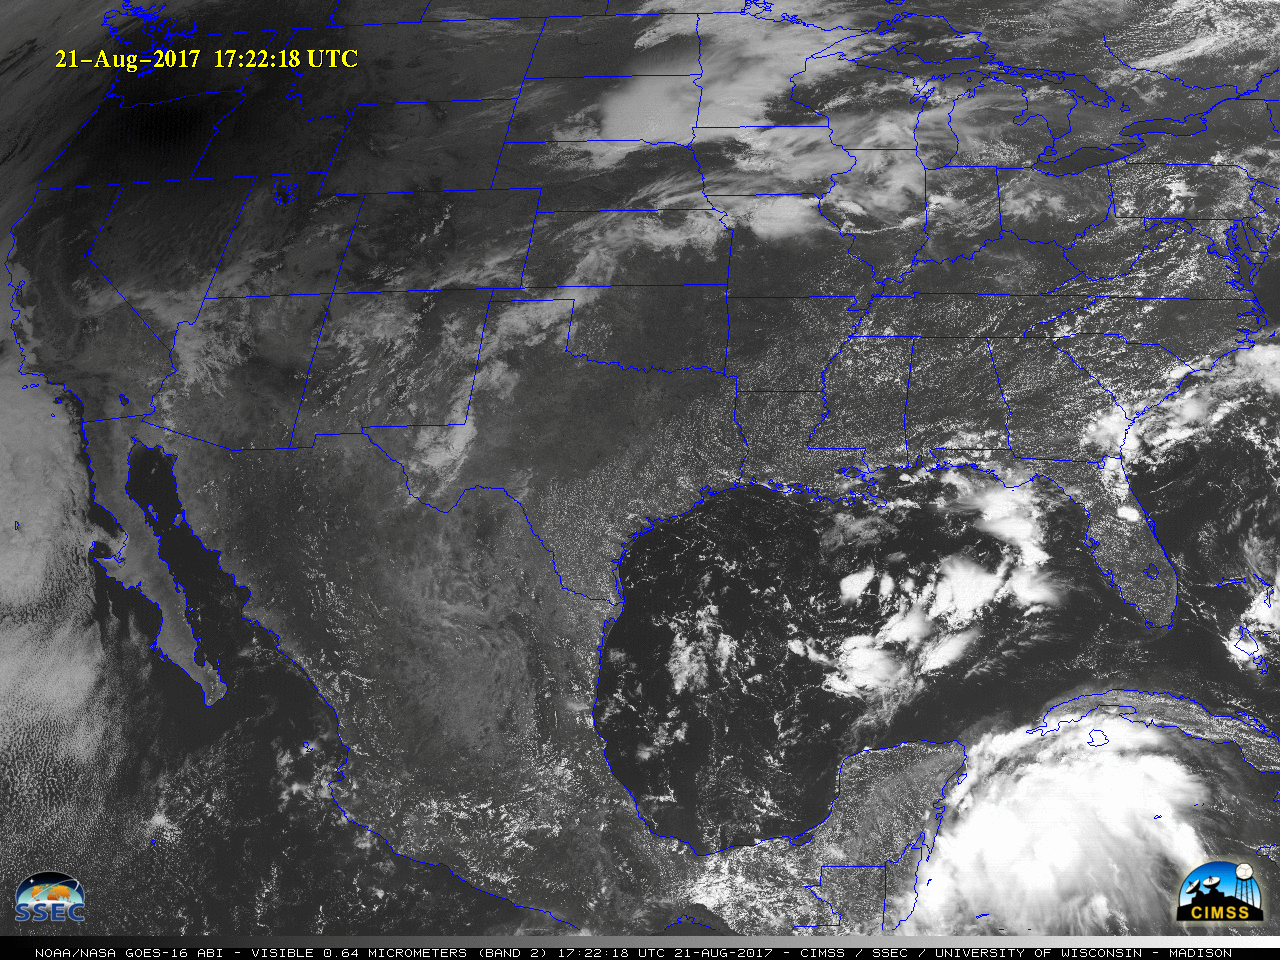
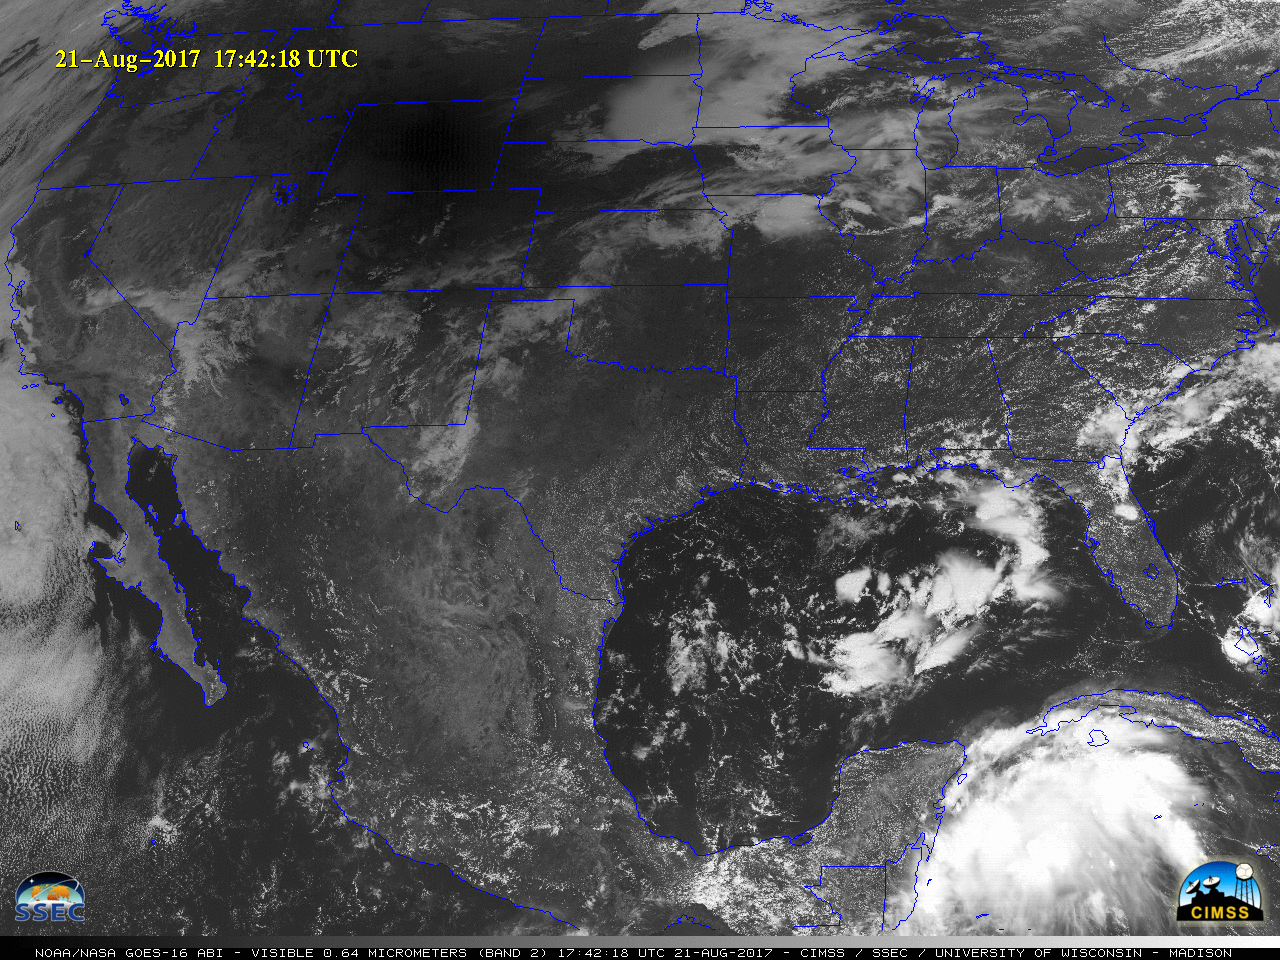
GOES-16 “Red” Visible (0.64 µm) images [click to play animation]
During the total solar eclipse of 21 August 2017, the lunar umbra was evident on imagery from the GOES-16 0.5 km resolution
(at satellite sub-point) “Red” Visible band (
0.64 µm)
(above) and 1.0 km resolution Near-Infrared “Vegetation” band (
0.86 µm)
(below).
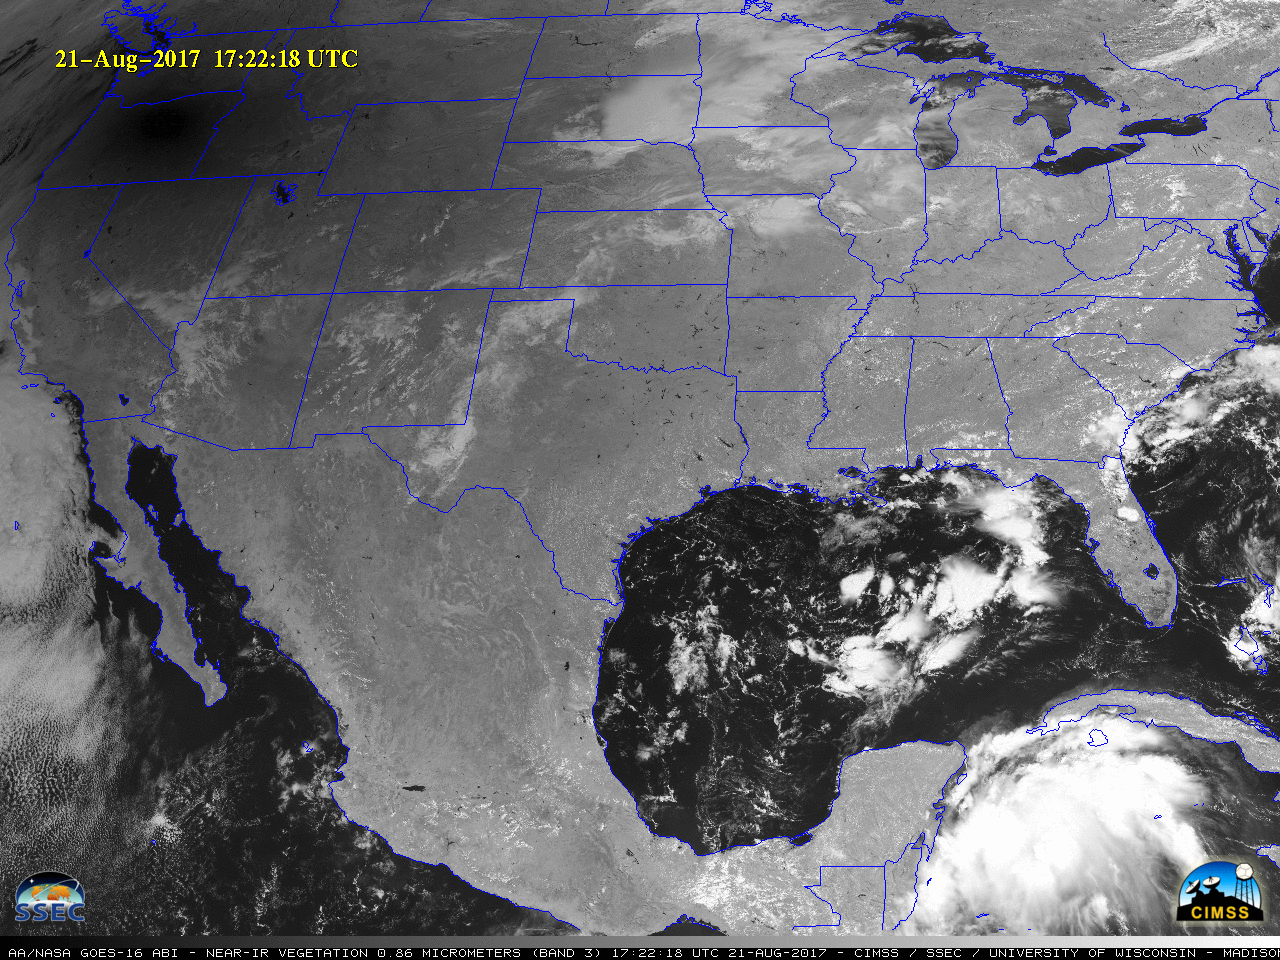
GOES-16 Near-Infrared “Vegetation” (0.86 µm) images [click to play animation]
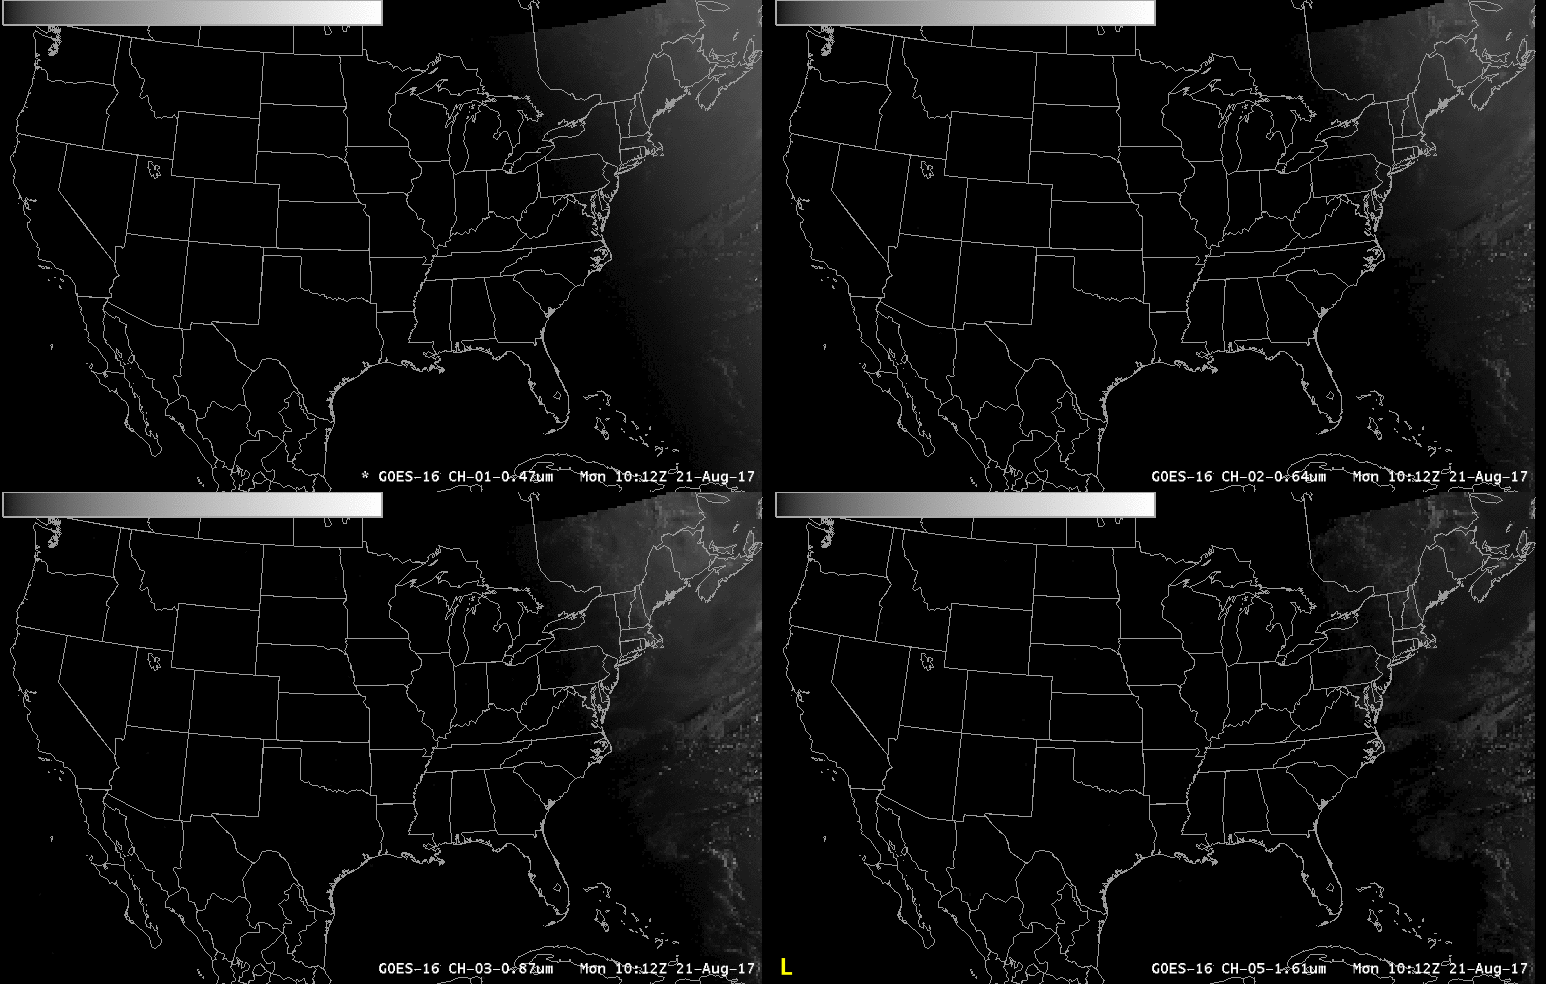
The shadow was also prominent in other Visible and Near-Infrared bands, as shown in a 4-panel comparison of GOES-16 “Blue” Visible
(0.47 µm), “Red” Visible
(0.64 µm), “Vegetation”
(0.86 µm) and “Snow/Ice”
(1.61 µm) images
(below).
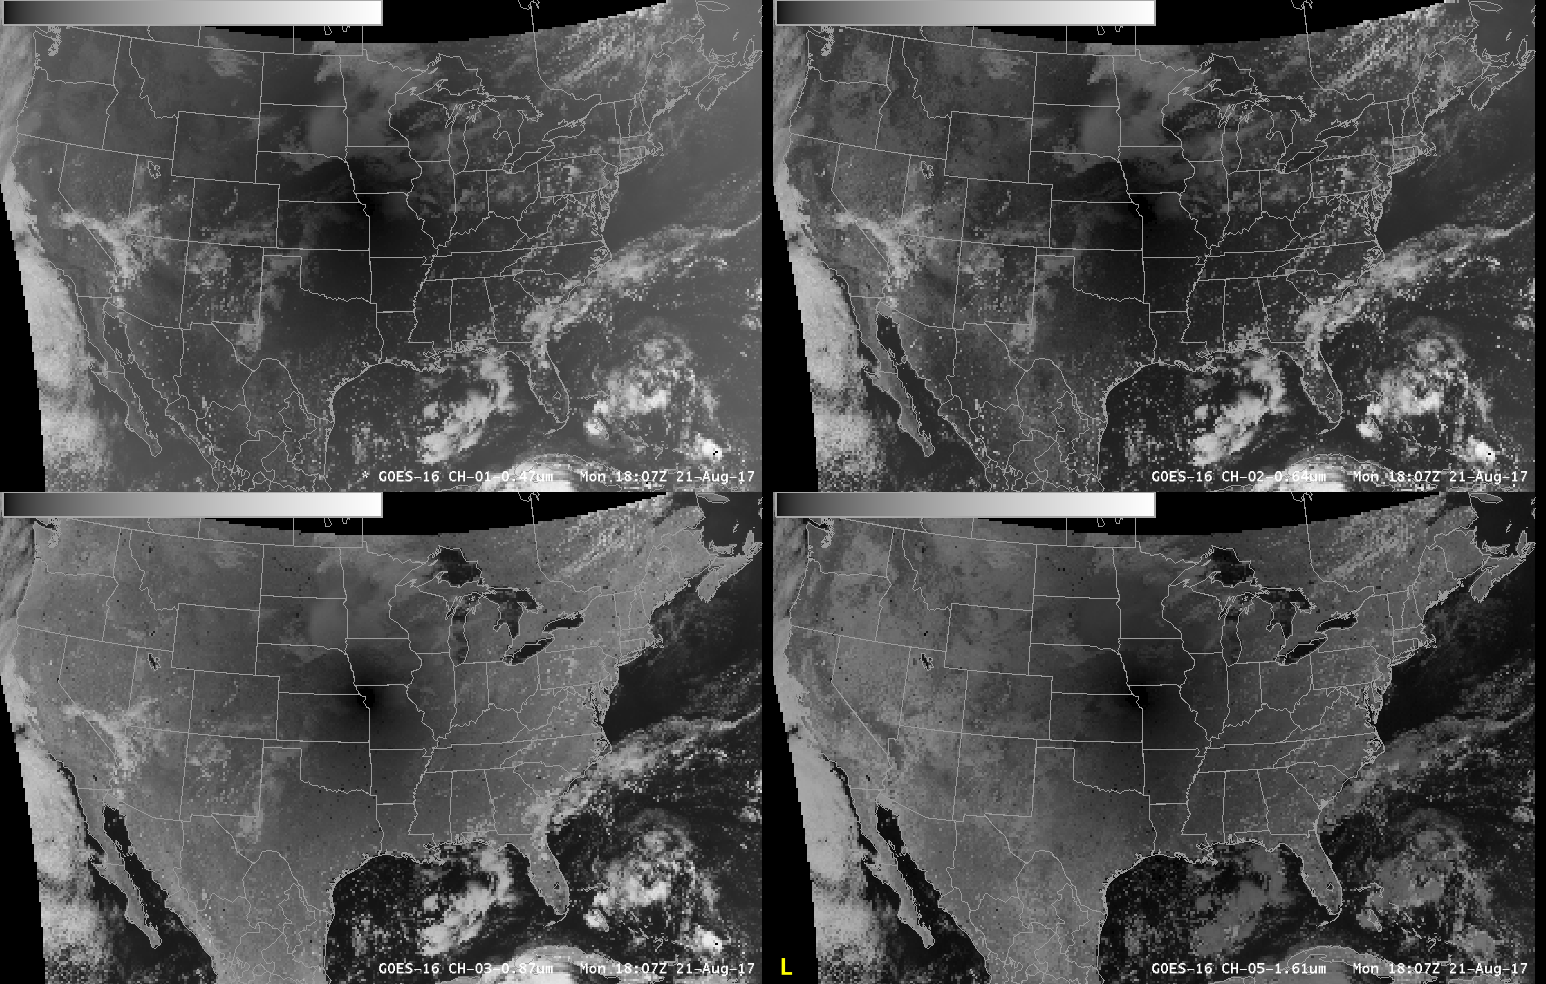
GOES-16 “Blue” Visible (0.47 µm, upper left), “Red” Visible (0.64 µm, upper right), “Vegetation” (0.86 µm, lower left) and “Snow/Ice” (1.61 µm, lower right) images [click to play animation]
GOES-16 True Color Red-Green-Blue (RGB) images from the
SSEC Geostationary Satellite site
(below) showed another view of the shadow. A GOES-16 Full-Disk true-color animation
(courtesy of Kaba Bah, CIMSS) is available
here; a composite of eclipse shadow images can be seen
here.
![GOES-16 true-color RGB images [click to play animation]](https://cimss.ssec.wisc.edu/satellite-blog/wp-content/uploads/sites/5/2017/08/tce_25.png)
GOES-16 True Color RGB images [click to play animation]
The
3.9 µm Shortwave Infrared band is also sensitive to reflected solar radiation — particularly that which is reflected from land surfaces and cloud tops composed of small spherical supercooled water droplets (and to a lesser extent, small ice crystals) — which causes this band to sense
warmer (darker gray to black) brightness temperatures compared to the other
ABI infrared bands. Therefore, a loss of sunlight within the eclipse shadow will lead to
cooling (lighter shades of gray) 3.9 µm brightness temperatures
(below).
![GOES-16 Shortwave Infrared (3.9 µm) images [click to play animation]](https://cimss.ssec.wisc.edu/satellite-blog/wp-content/uploads/sites/5/2017/08/960x1280_GOES16A_B7_G16_SWIR_B7_1AUG2017_2017233_172218_0001PANEL.GIF)
GOES-16 Shortwave Infrared (3.9 µm) images [click to play MP4 animation]
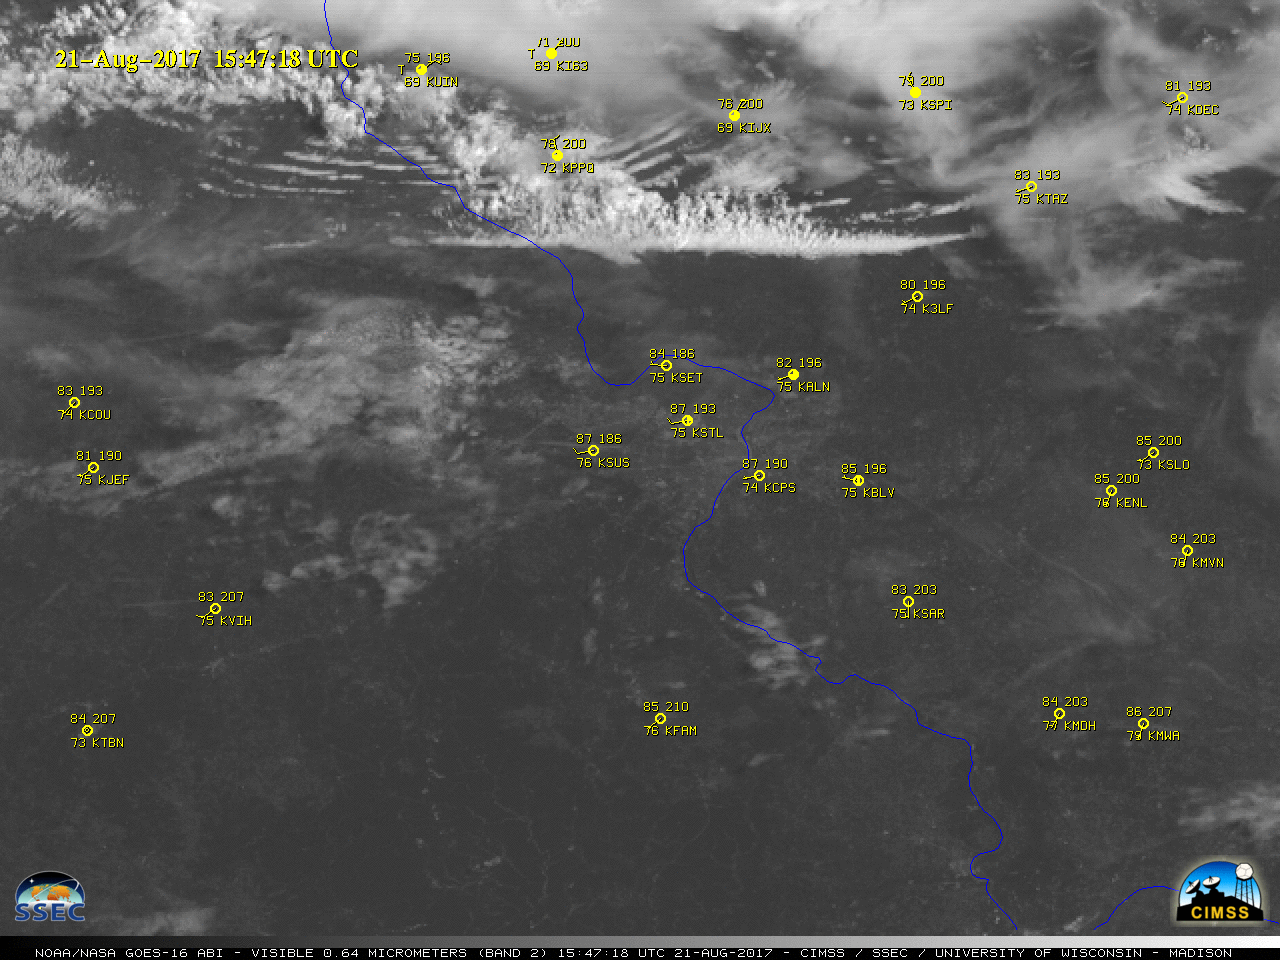
Taking a closer look at eastern Missouri and southern Illinois as the solar eclipse shadow was passing over that region shortly after 1800 UTC
(1:00 pm local time), GOES-16 “Red” Visible (0.64 µm) images
(below) revealed that the pronounced decrease of incoming solar radiation appeared to temporarily suppress the development of widespread boundary layer cumulus clouds. Note that the increase in hourly surface temperatures was also halted, with some locations even experiencing a slight cooling (1-3 ºF) due to reduction of solar heating within the lunar umbra.
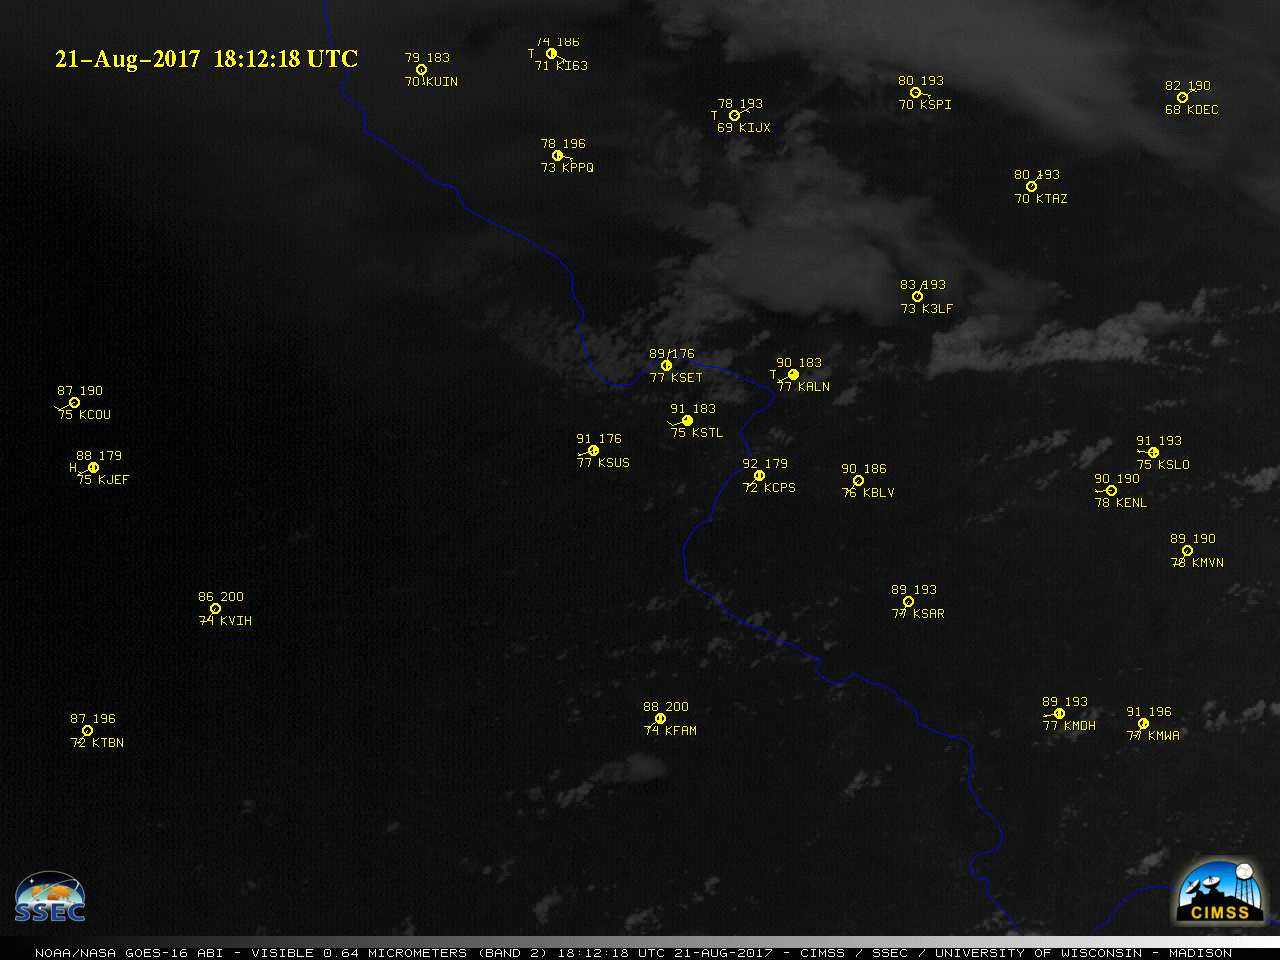
GOES-16 “Red” Visible (0.64 µm) images, with hourly surface reports plotted in yellow [click to play animation]
GOES-16 Shortwave Infrared (3.9 µm) images
(below) also showed a slight cooling — seen as a lighter shade of red enhancement — across the region.
![GOES-16 Shortwave Infrared (3.9 µm) images, with hourly surface reports plotted in yellow [click to play animation]](https://cimss.ssec.wisc.edu/satellite-blog/wp-content/uploads/sites/5/2017/08/960x1280_AGOES16_B7_G16_SWIR_B7_STL_CU_21AUG2017_2017233_181218_0001PANEL.GIF)
GOES-16 Shortwave Infrared (3.9 µm) images, with hourly surface reports plotted in yellow [click to play animation]
GOES-16 Mesoscale Sector images (at 1-minute intervals)
![GOES-16 "Red" Visible (0.64 µm) images, with station identifiers plotted in yellow [click to play animation]](https://cimss.ssec.wisc.edu/satellite-blog/wp-content/uploads/sites/5/2017/08/960x1280_GOES16A_B2_G16_VIS_B2_MESO_1_21AUG2017_2017233_172226_0001PANEL.GIF)
1-minute GOES-16 “Red” Visible (0.64 µm) images, with station identifiers plotted in yellow [click to play animation]
A “floating”
Mesoscale Sector provided 1-minute imagery during the eclipse
(above).
Polar-orbiting satellite images (Terra MODIS, and Suomi-NPP VIIRS)
![Terra MODIS Visible (0.65 µm). Land Surface Temperature product, Shortwave Infrared (3.7 µm) and Infrared Window (11.0 µm) images [click to enlarge]](https://cimss.ssec.wisc.edu/satellite-blog/wp-content/uploads/sites/5/2017/08/170821_1739utc_terra_modis_Visible_LandSurfaceTemperature_ShortwaveInfrared_InfraredWindow_eclipse_shadow_anim.gif)
Terra MODIS Visible (0.65 µm), Land Surface Temperature product, Shortwave Infrared (3.7 µm) and Infrared Window (11.0 µm) images [click to enlarge]
A toggle between Terra MODIS Visible (0.65 µm), Land Surface Temperature product, Shortwave Infrared (3.7 µm) and Infrared Window (11.0 µm) images
(above) showed the eclipse shadow as it was centered over western Nebraska around 1748 UTC. Without a time series of MODIS Land Surface Temperature product images, it is difficult to gauge the exact amount of surface cooling brought about within the shadow of totality. A large-scale high resolution Terra MODIS Visible image is available
here (courtesy of Liam Gumley, SSEC).
![Suomi NPP VIIRS Visible (0.64 µm), Day/Night Band (0.7 µm) and Infrared Window (11.45 µm) images [click to enlarge]](https://cimss.ssec.wisc.edu/satellite-blog/wp-content/uploads/sites/5/2017/08/170821_1827utc_suomi_npp_viirs_Visible_DayNightBand_InfraredWindow_eclipse_shadow_anim.gif)
Suomi-NPP VIIRS Visible (0.64 µm), Day/Night Band (0.7 µm) and Infrared Window (11.45 µm) images [click to enlarge]
A comparison of Suomi-NPP VIIRS Visible (0.64 µm), Day/Night Band (0.7 µm) and Infrared Window (11.45 µm) images
(above) showed the shadow center over eastern Tennessee around 1833 UTC. A closer comparison of Day/Night Band and Infrared images
(below) revealed the presence of cloud features that made it difficult to see a signature of any city lights that may have come on in the Nashville TN (KBNA) metropolitan area.
![Suomi NPP VIIIRS Day/Night Band (0.7 µm) and Infrared Window (11.45 µm) images [click to enlarge]](https://cimss.ssec.wisc.edu/satellite-blog/wp-content/uploads/sites/5/2017/08/170821_1827utc_suomi_npp_viirs_DayNightBand_InfraredWindow_eclipse_shadow_zoom_anim.gif)
Suomi-NPP VIIIRS Day/Night Band (0.7 µm) and Infrared Window (11.45 µm) images [click to enlarge]
View only this post
Read Less


![GOES-16 true-color RGB images [click to play animation]](https://cimss.ssec.wisc.edu/satellite-blog/wp-content/uploads/sites/5/2017/08/170821_goes16_truecolor_eclipse_anim.gif)
![GOES-16 Shortwave Infrared (3.9 µm) images [click to play animation]](https://cimss.ssec.wisc.edu/satellite-blog/wp-content/uploads/sites/5/2017/08/170821_g16_swir_b7_sector1_conus_anim.gif)
![GOES-16 Shortwave Infrared (3.9 µm) images, with hourly surface reports plotted in yellow [click to play animation]](https://cimss.ssec.wisc.edu/satellite-blog/wp-content/uploads/sites/5/2017/08/170821_goes16_shortwave_infrared_STL_eclipse_cu_suppression_anim.gif)
![GOES-16 "Red" Visible (0.64 µm) images, with station identifiers plotted in yellow [click to play animation]](https://cimss.ssec.wisc.edu/satellite-blog/wp-content/uploads/sites/5/2017/08/170821_goes16_visible_band2_mesoscale_sectors_eclipse_anim.gif)
