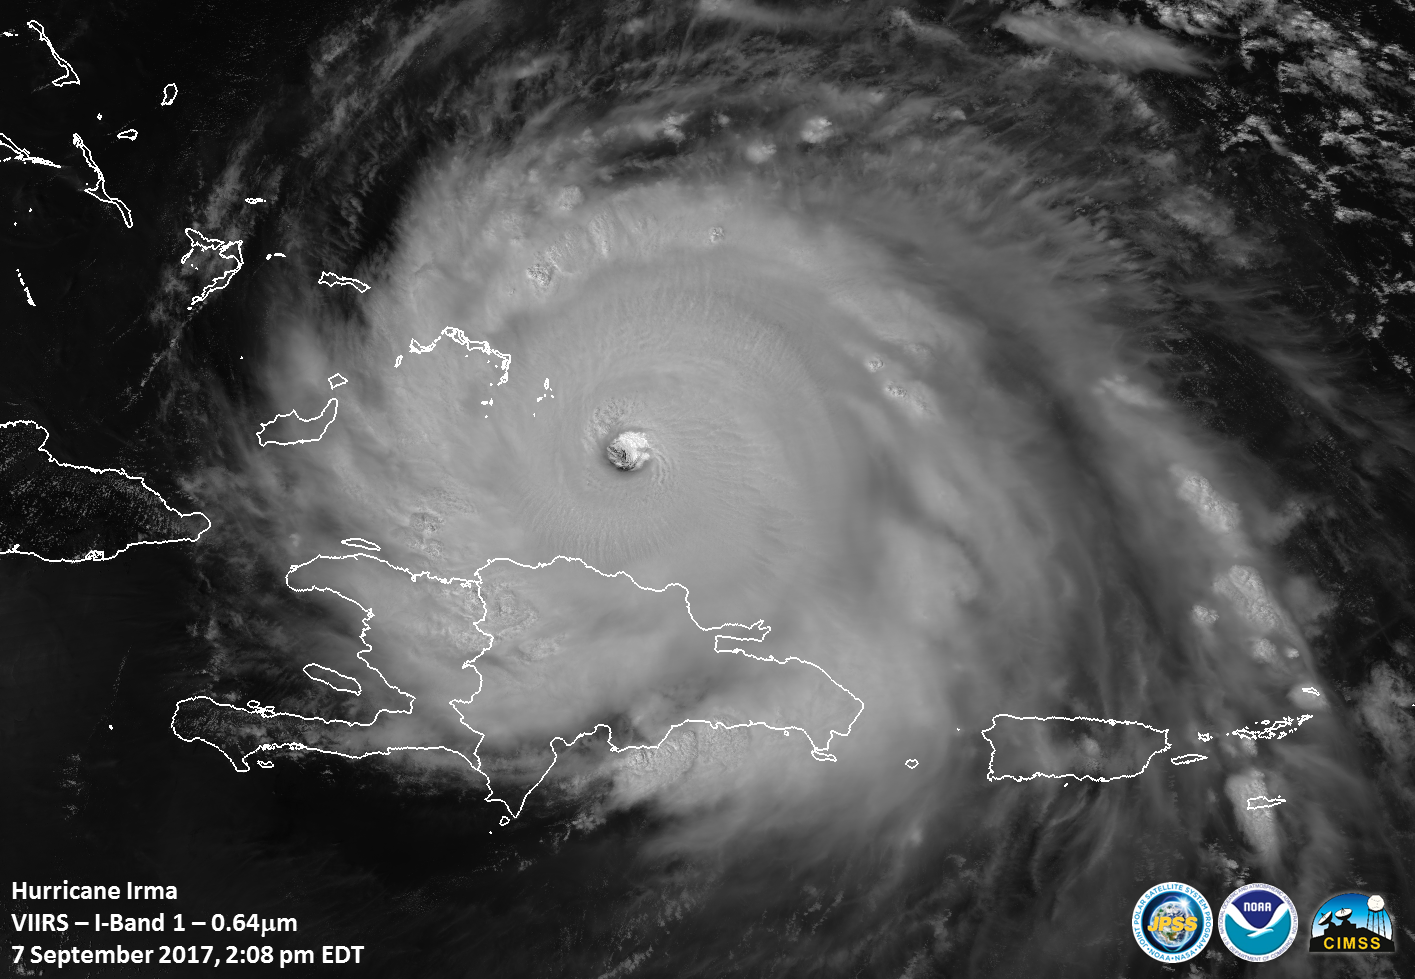
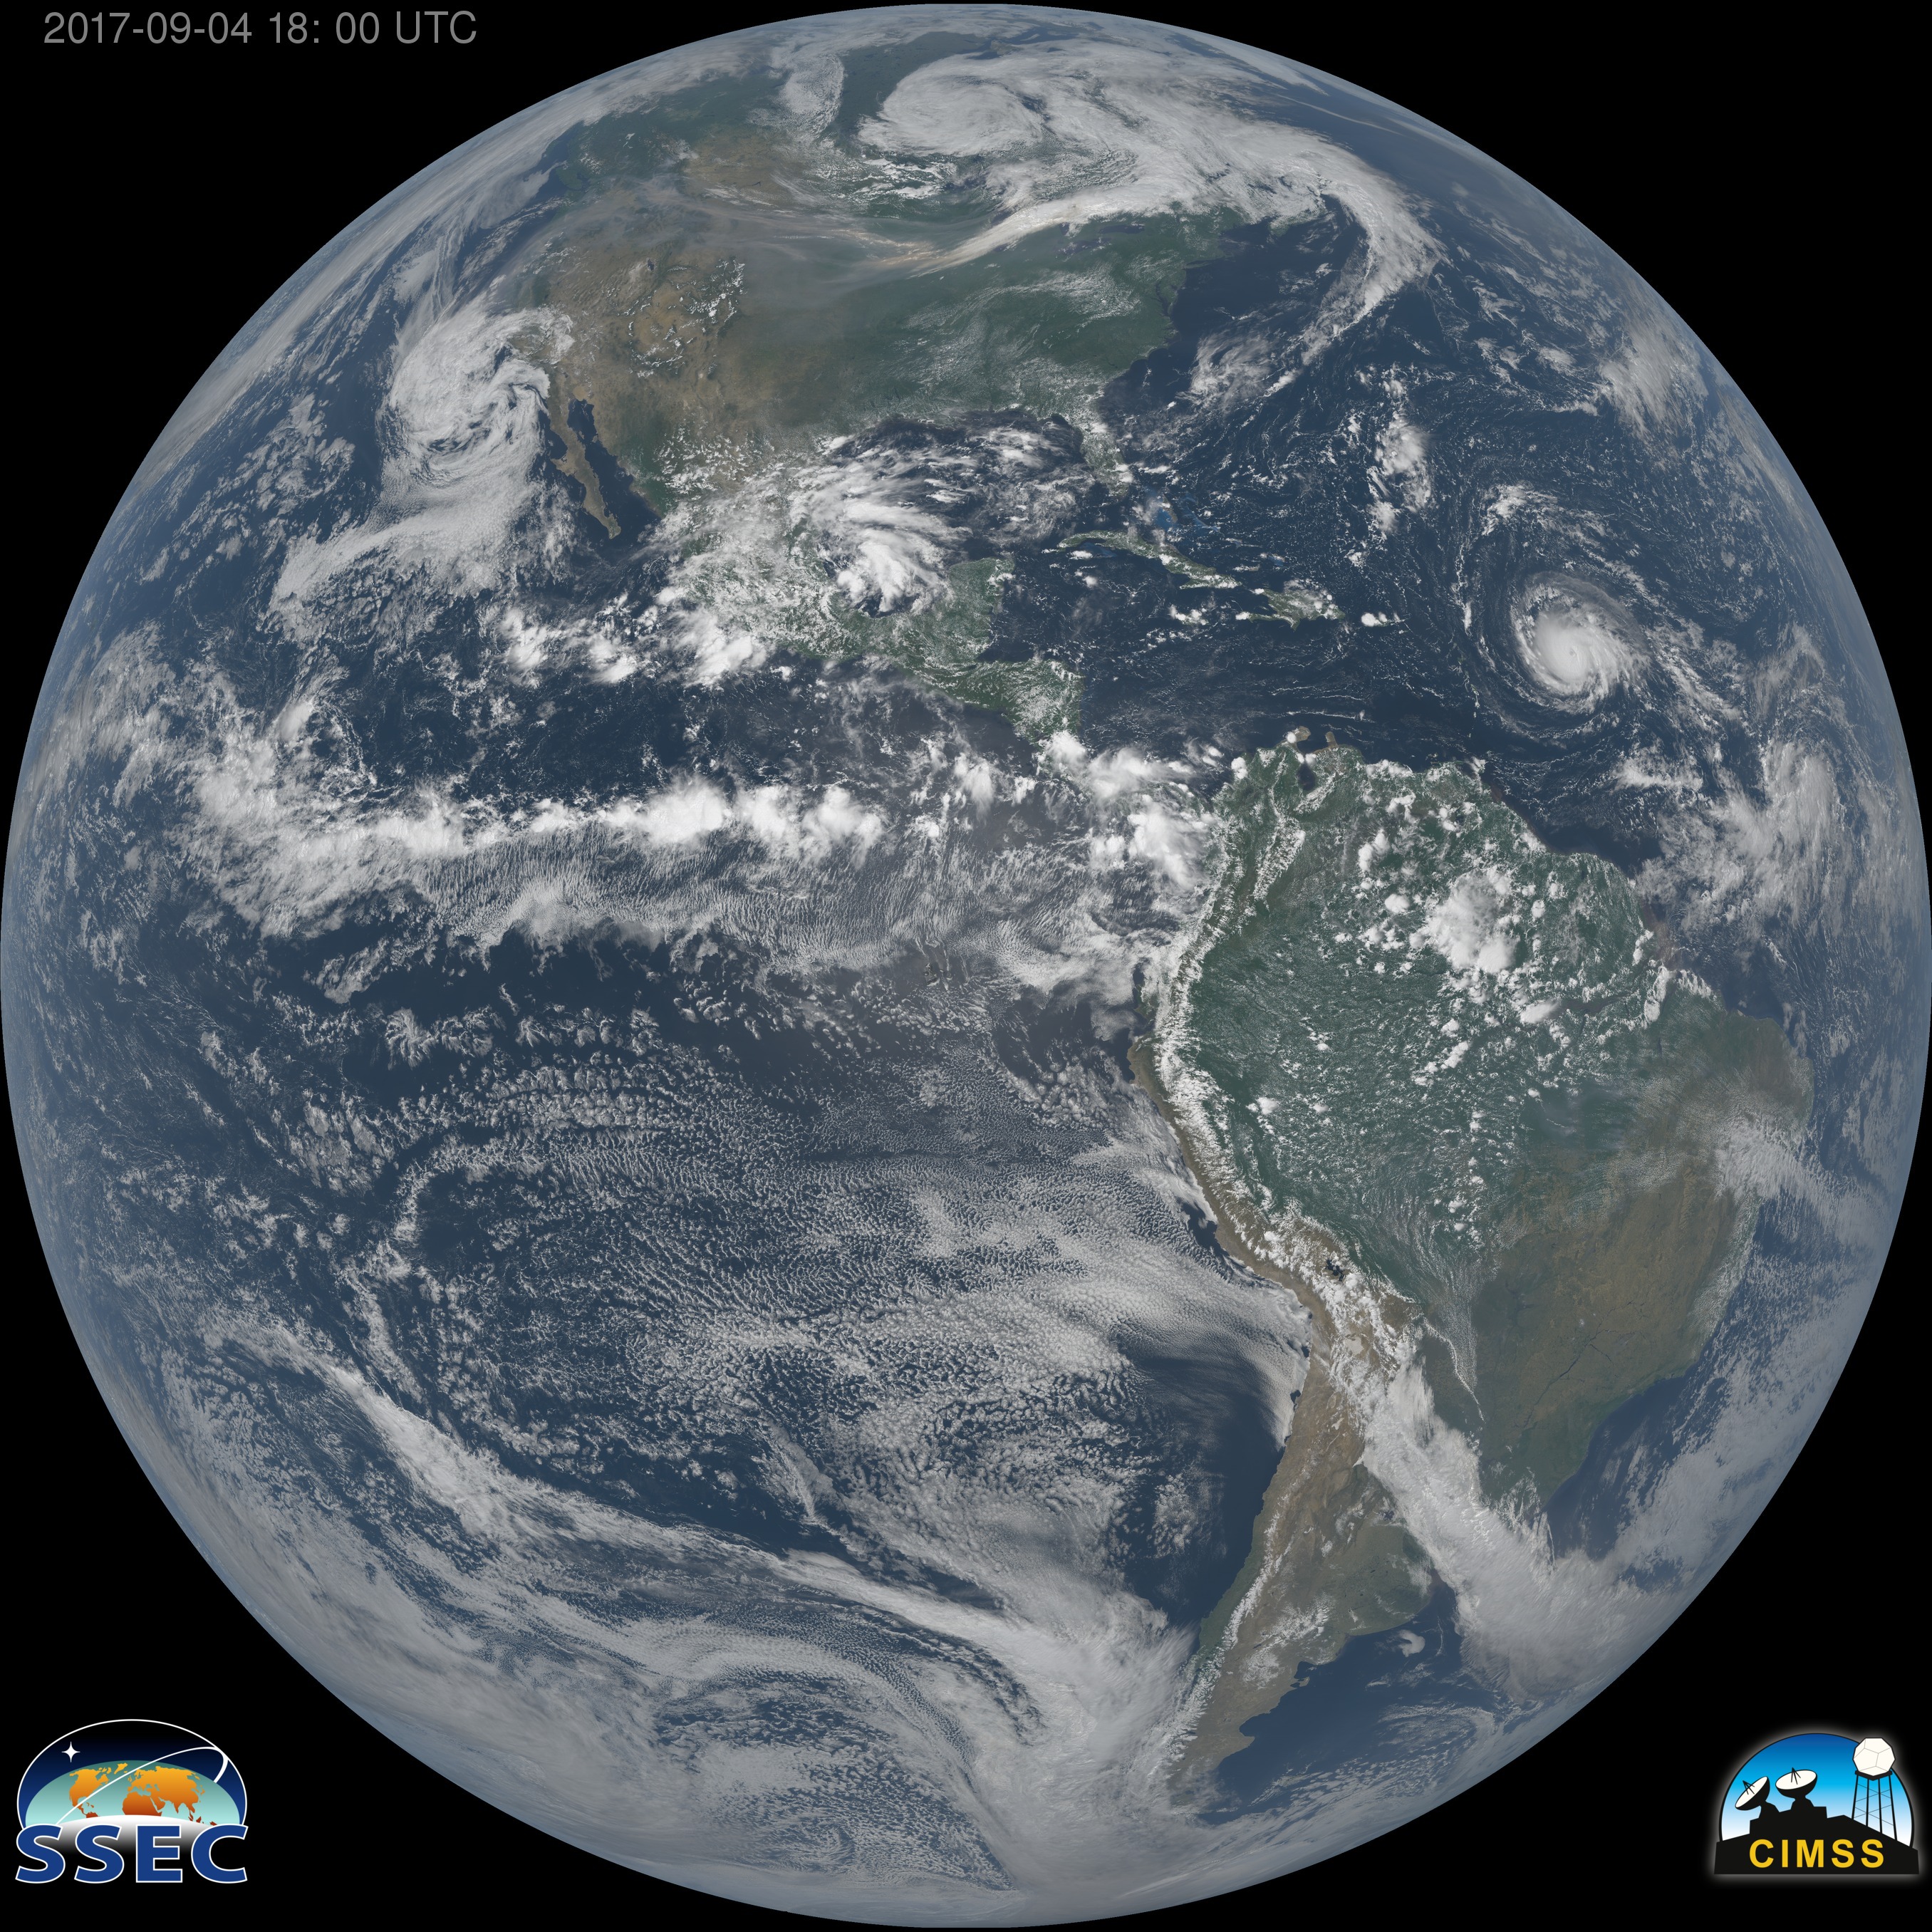
GOES-16 “Clean Window” Imagery (10.3 µm) every six hours from 1500 UTC 31 August to 0900 UTC 8 September, centered on Irma (Click to animate)
GOES-16 data posted on this page are preliminary, non-operational and are undergoing testing
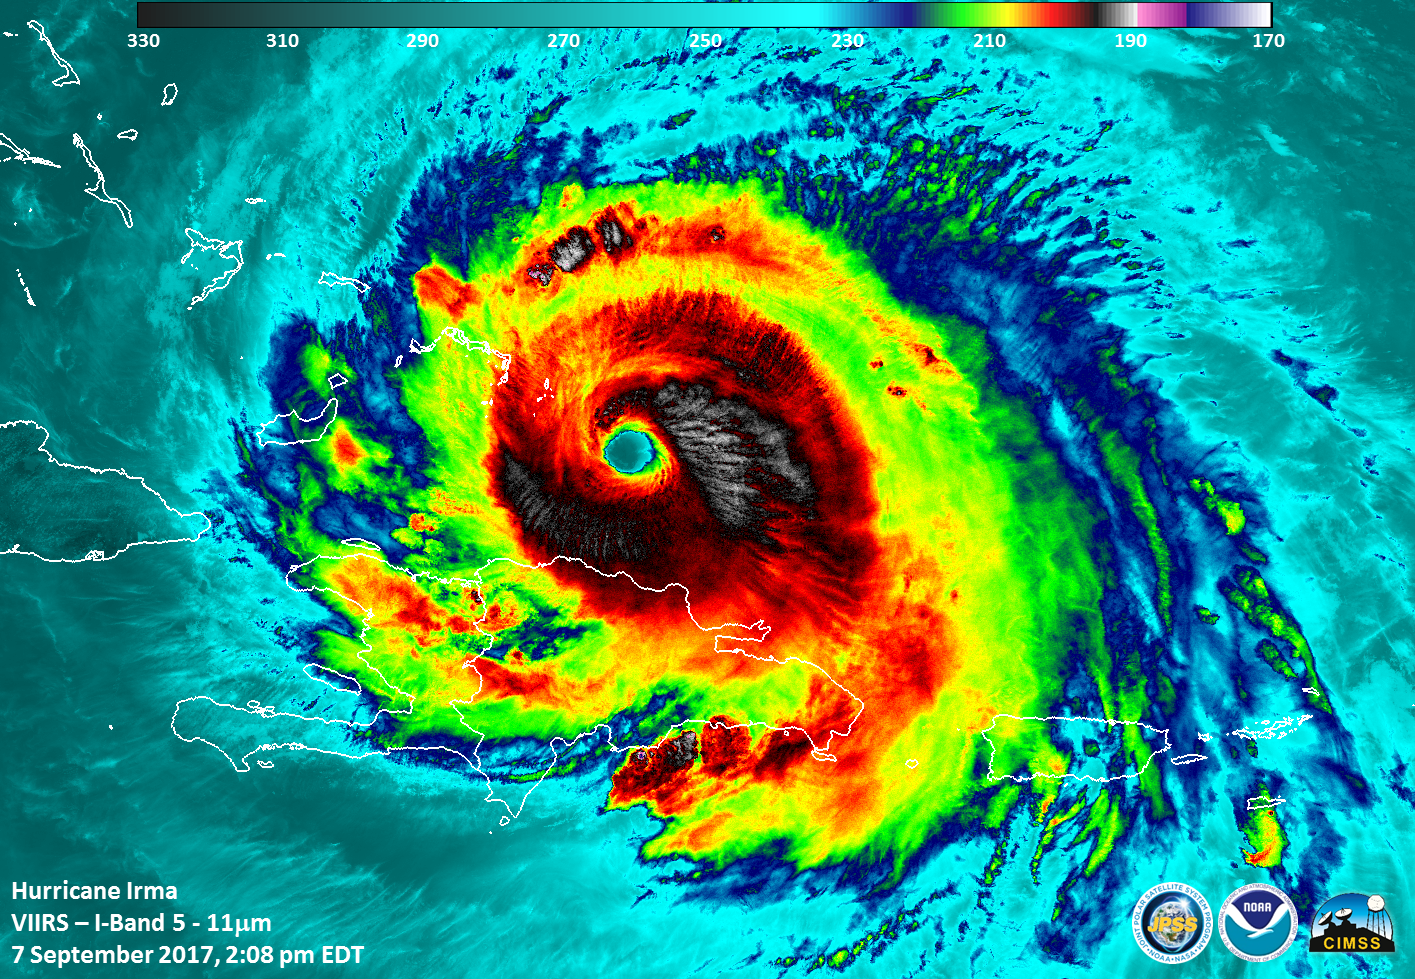
The animation above shows Irma every 6 hours from 31 August through 8 September, using the GOES-16 “Clean Window” Imagery (10.3 µm). The animation below shows the GOES-16 Upper-Level Water Vapor Infrared Imagery (6.19 µm) (Click here for the Low-Level Water Vapor Infrared Imagery — 7.34 µm). All three animations show a gradual increase in the size of the storm. The structure of the storm at the very end suggests a slight weakening, most likely temporary, of Irma.

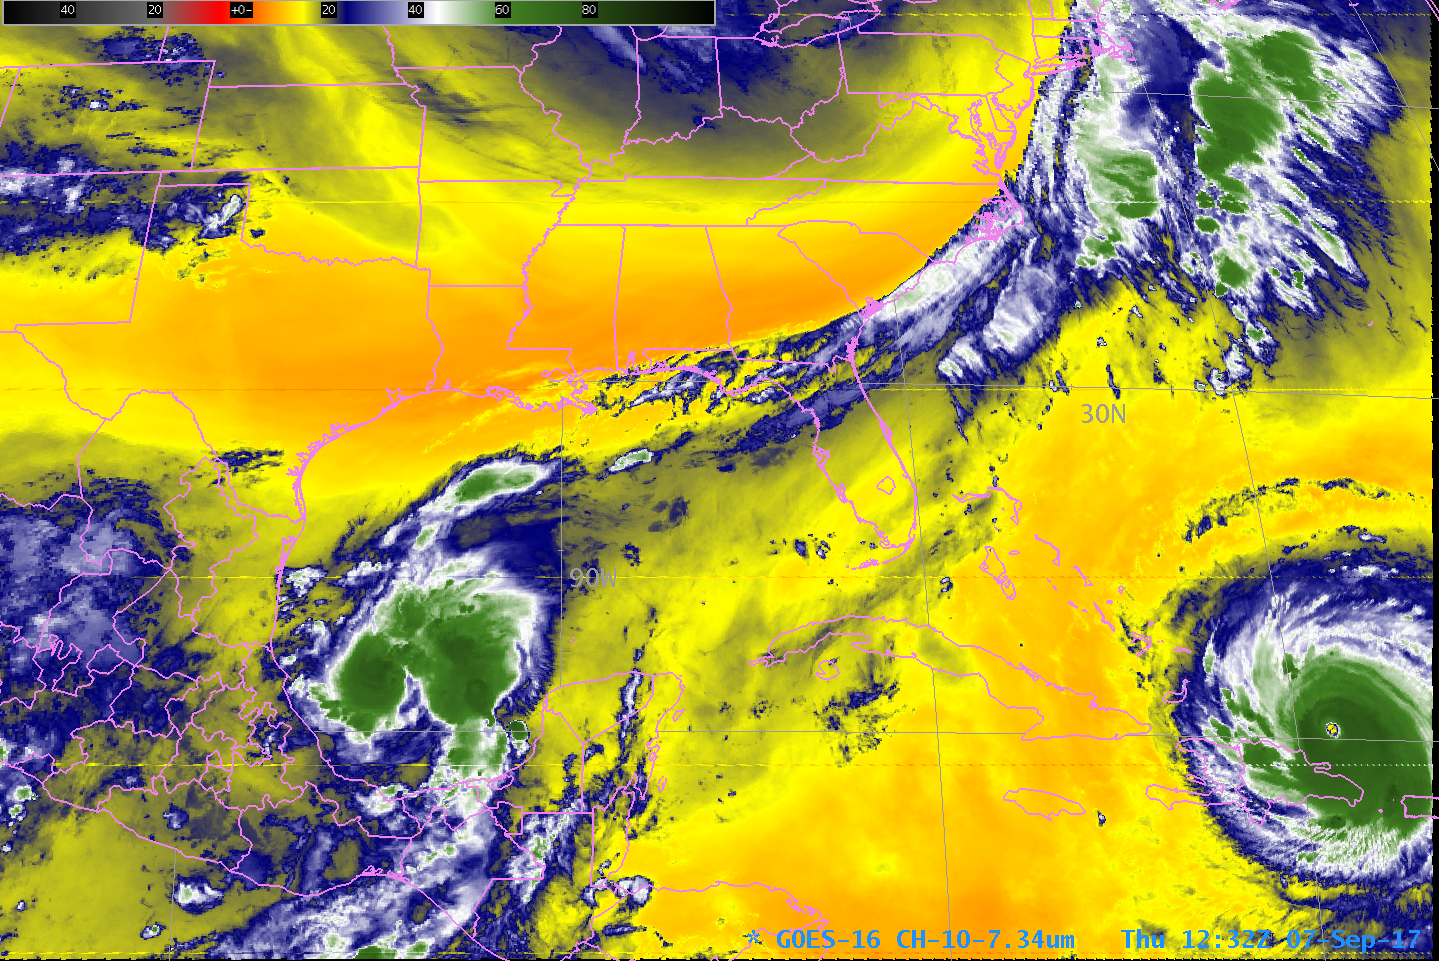
GOES-16 “Low-Level Water Vapor” Infrared Imagery (6.19 µm) every six hours from 1500 UTC 31 August to 0900 UTC 8 September, centered on Irma (Click to animate)
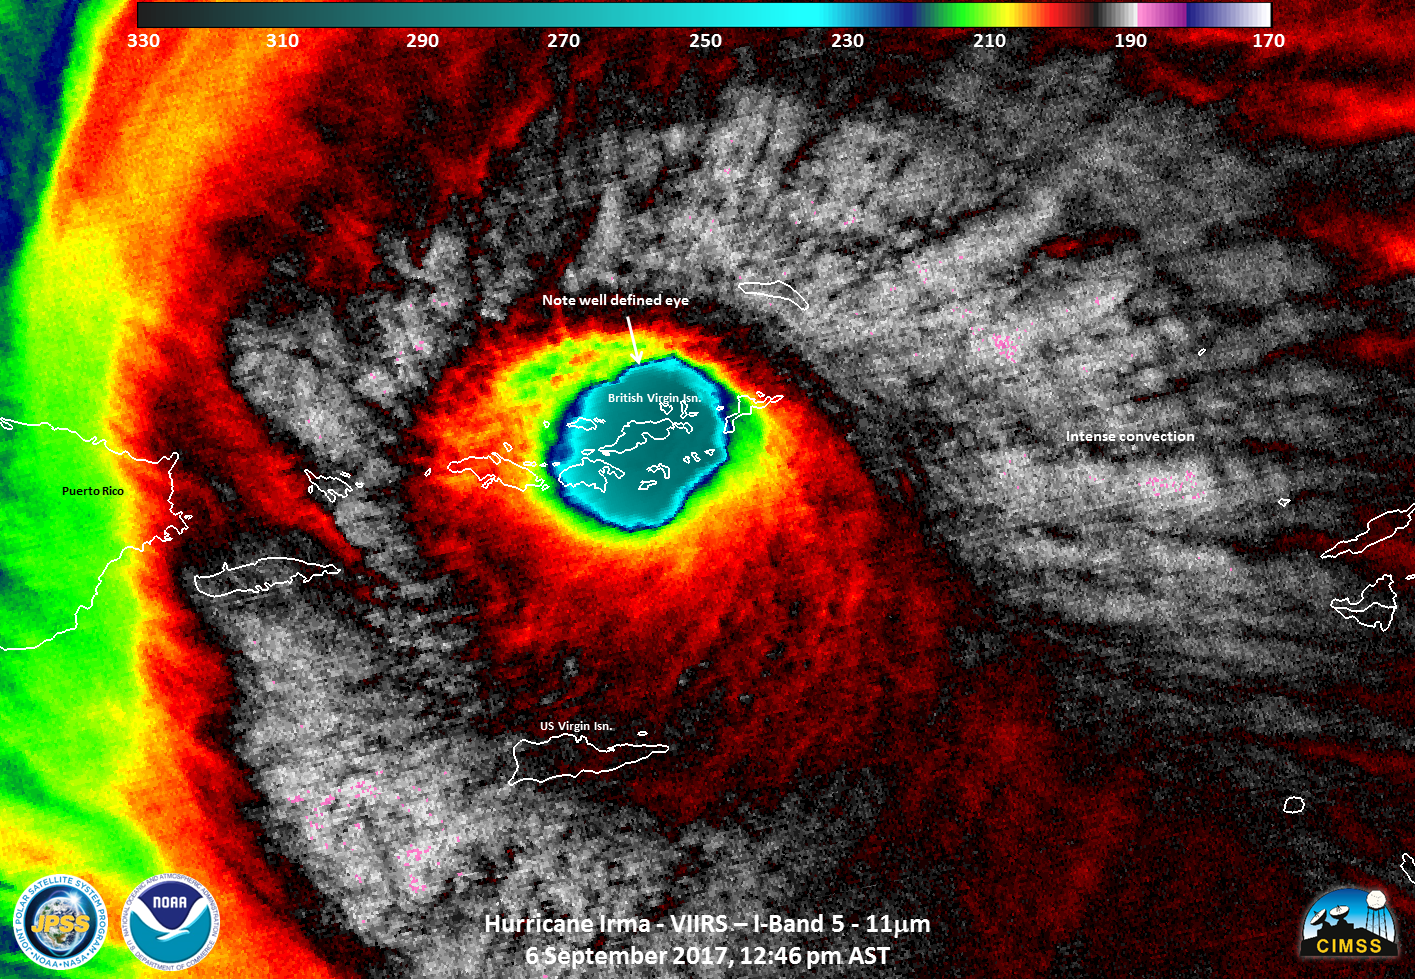
The recent slight weakening of Irma is mostly likely related to an Eyewall Replacement Cycle, shown in the Microwave Imagery below (from this site). In an Eyewall Replacement, an outer eyewall develops around the inner eyewall, after which time the inner eyewall will diminish and then dissipate, usually but not always weakening the storm. The outer eyewall will then contract, usually as the storm re-intensifies (if other environmental parameters that govern strengthening — Sea Surface Temperatures, Moisture, Shear — are favorable).
Morphed Microwave Imagery over Irma for the 48 hours ending 1200 UTC on 8 September 2017 (Click to enlarge)
The imagery below shows a recent 8-hour animation of Irma and Katia using the GOES-16 Clean Window (10.3 µm) Channel. The Inner Core of Irma looks a bit more ragged compared to previous days, although excellent outflow continues, and very little dry air is apparent. Katia in the southwest Gulf of Mexico is occasionally presenting an eye.
GOES-16 “Clean Window” Imagery (10.3 µm) 0717-1522 UTC on 8 September (Click to animate)
For more on this system, please consult the National Hurricane Center Website, or the SSEC/CIMSS Tropical Weather Website.
View only this post Read Less

