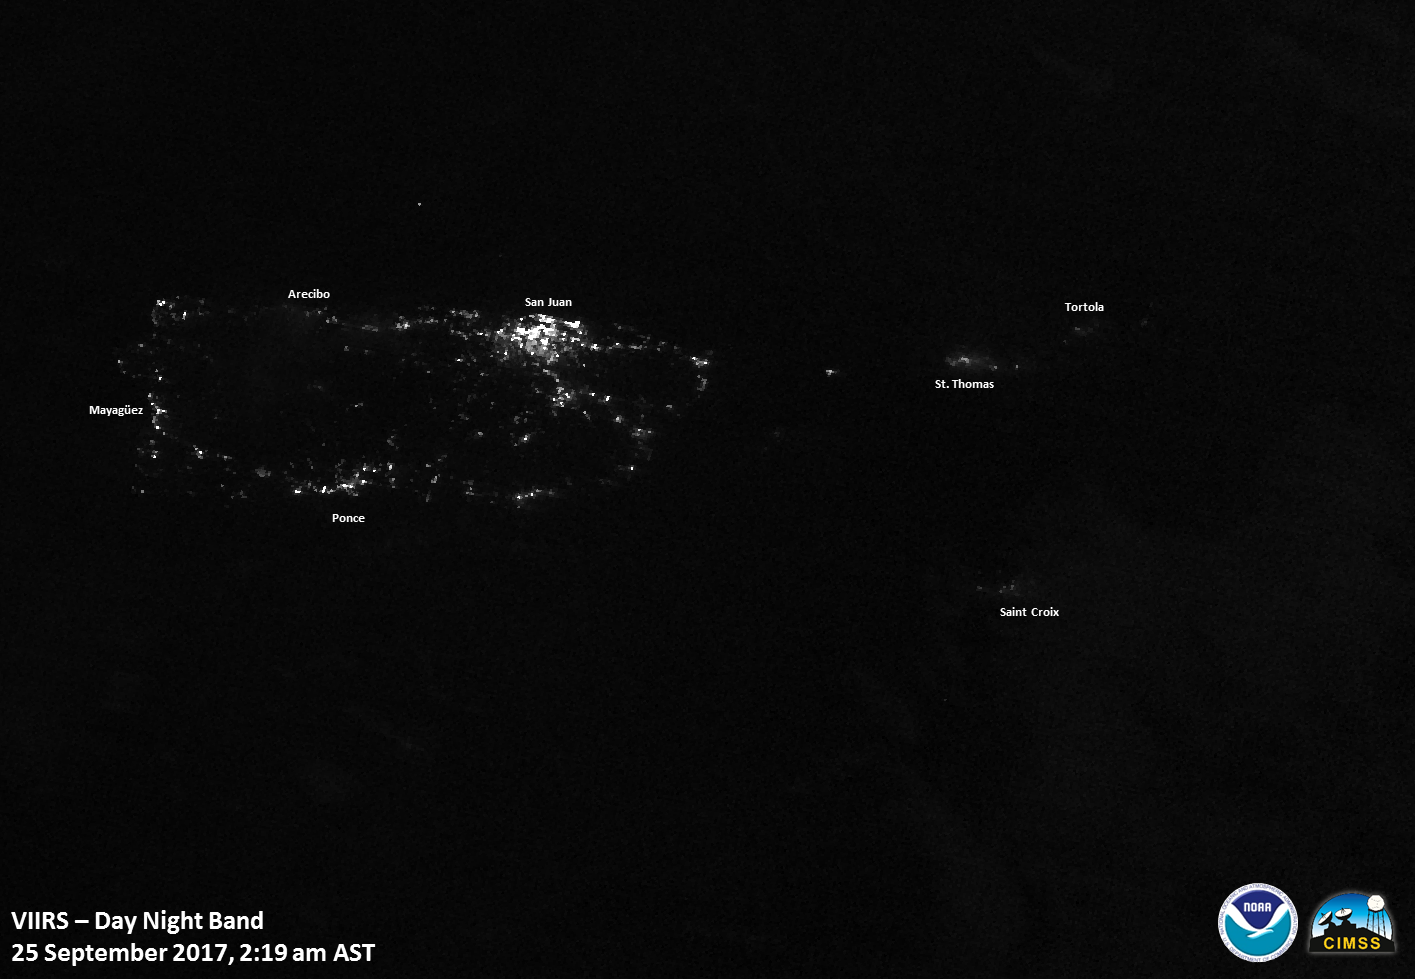
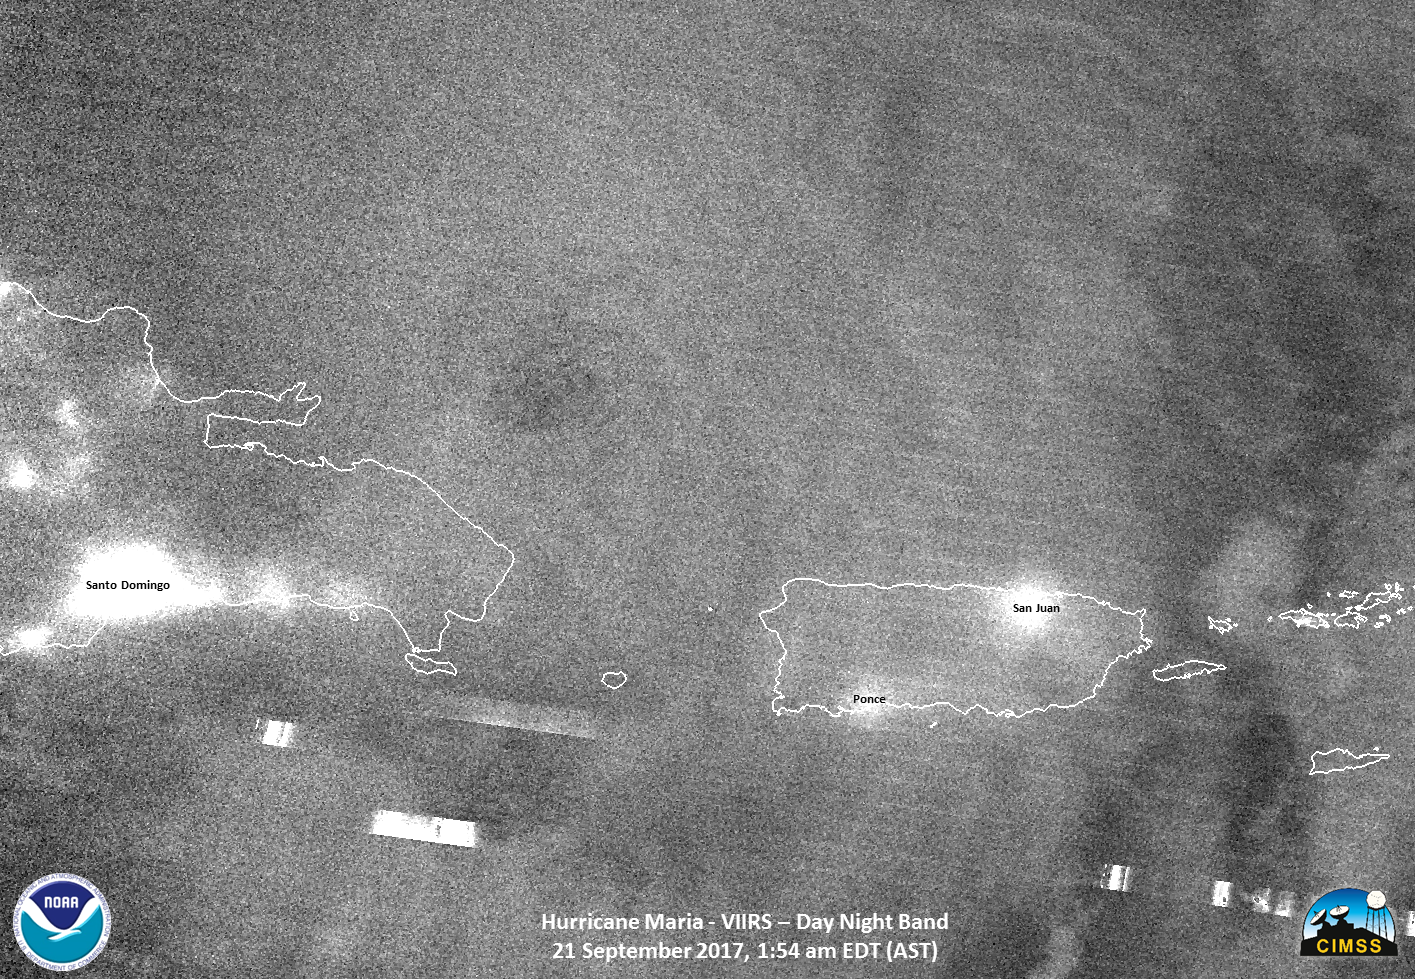
Suomi NPP Day Night Band Visible (0.7 µm) Imagery, 0619 UTC on 25 September 2017 (Click to enlarge)
Mostly clear skies over Puerto Rico early on 25 September 2017 allowed the Day Night Band on Suomi NPP to observe man-made sources of light on that island as shown in the image above (Courtesy of William Straka, CIMSS). (A previous example on this blog showed lights through clouds). A similar view is available at NASA’s Worldview site, or at Real Earth. The Lunar Phase on 25 September 2017 is Waxing Crescent with 26% illumination; similar illumination occurred on 24 August, and a link to the Day Night Band imagery at NASA Worldview on that day is here. The differences are stark.
A RealEarth examination of two Suomi NPP VIIRS Day/Night Band (0.7 µm) images — an archived “clear sky” view from 31 December 2015, and an “after-Maria” image from 26 September 2017 (below) — provides a good before/after comparison showing a reduction in the amount of city light illumination following the passage of the hurricane.
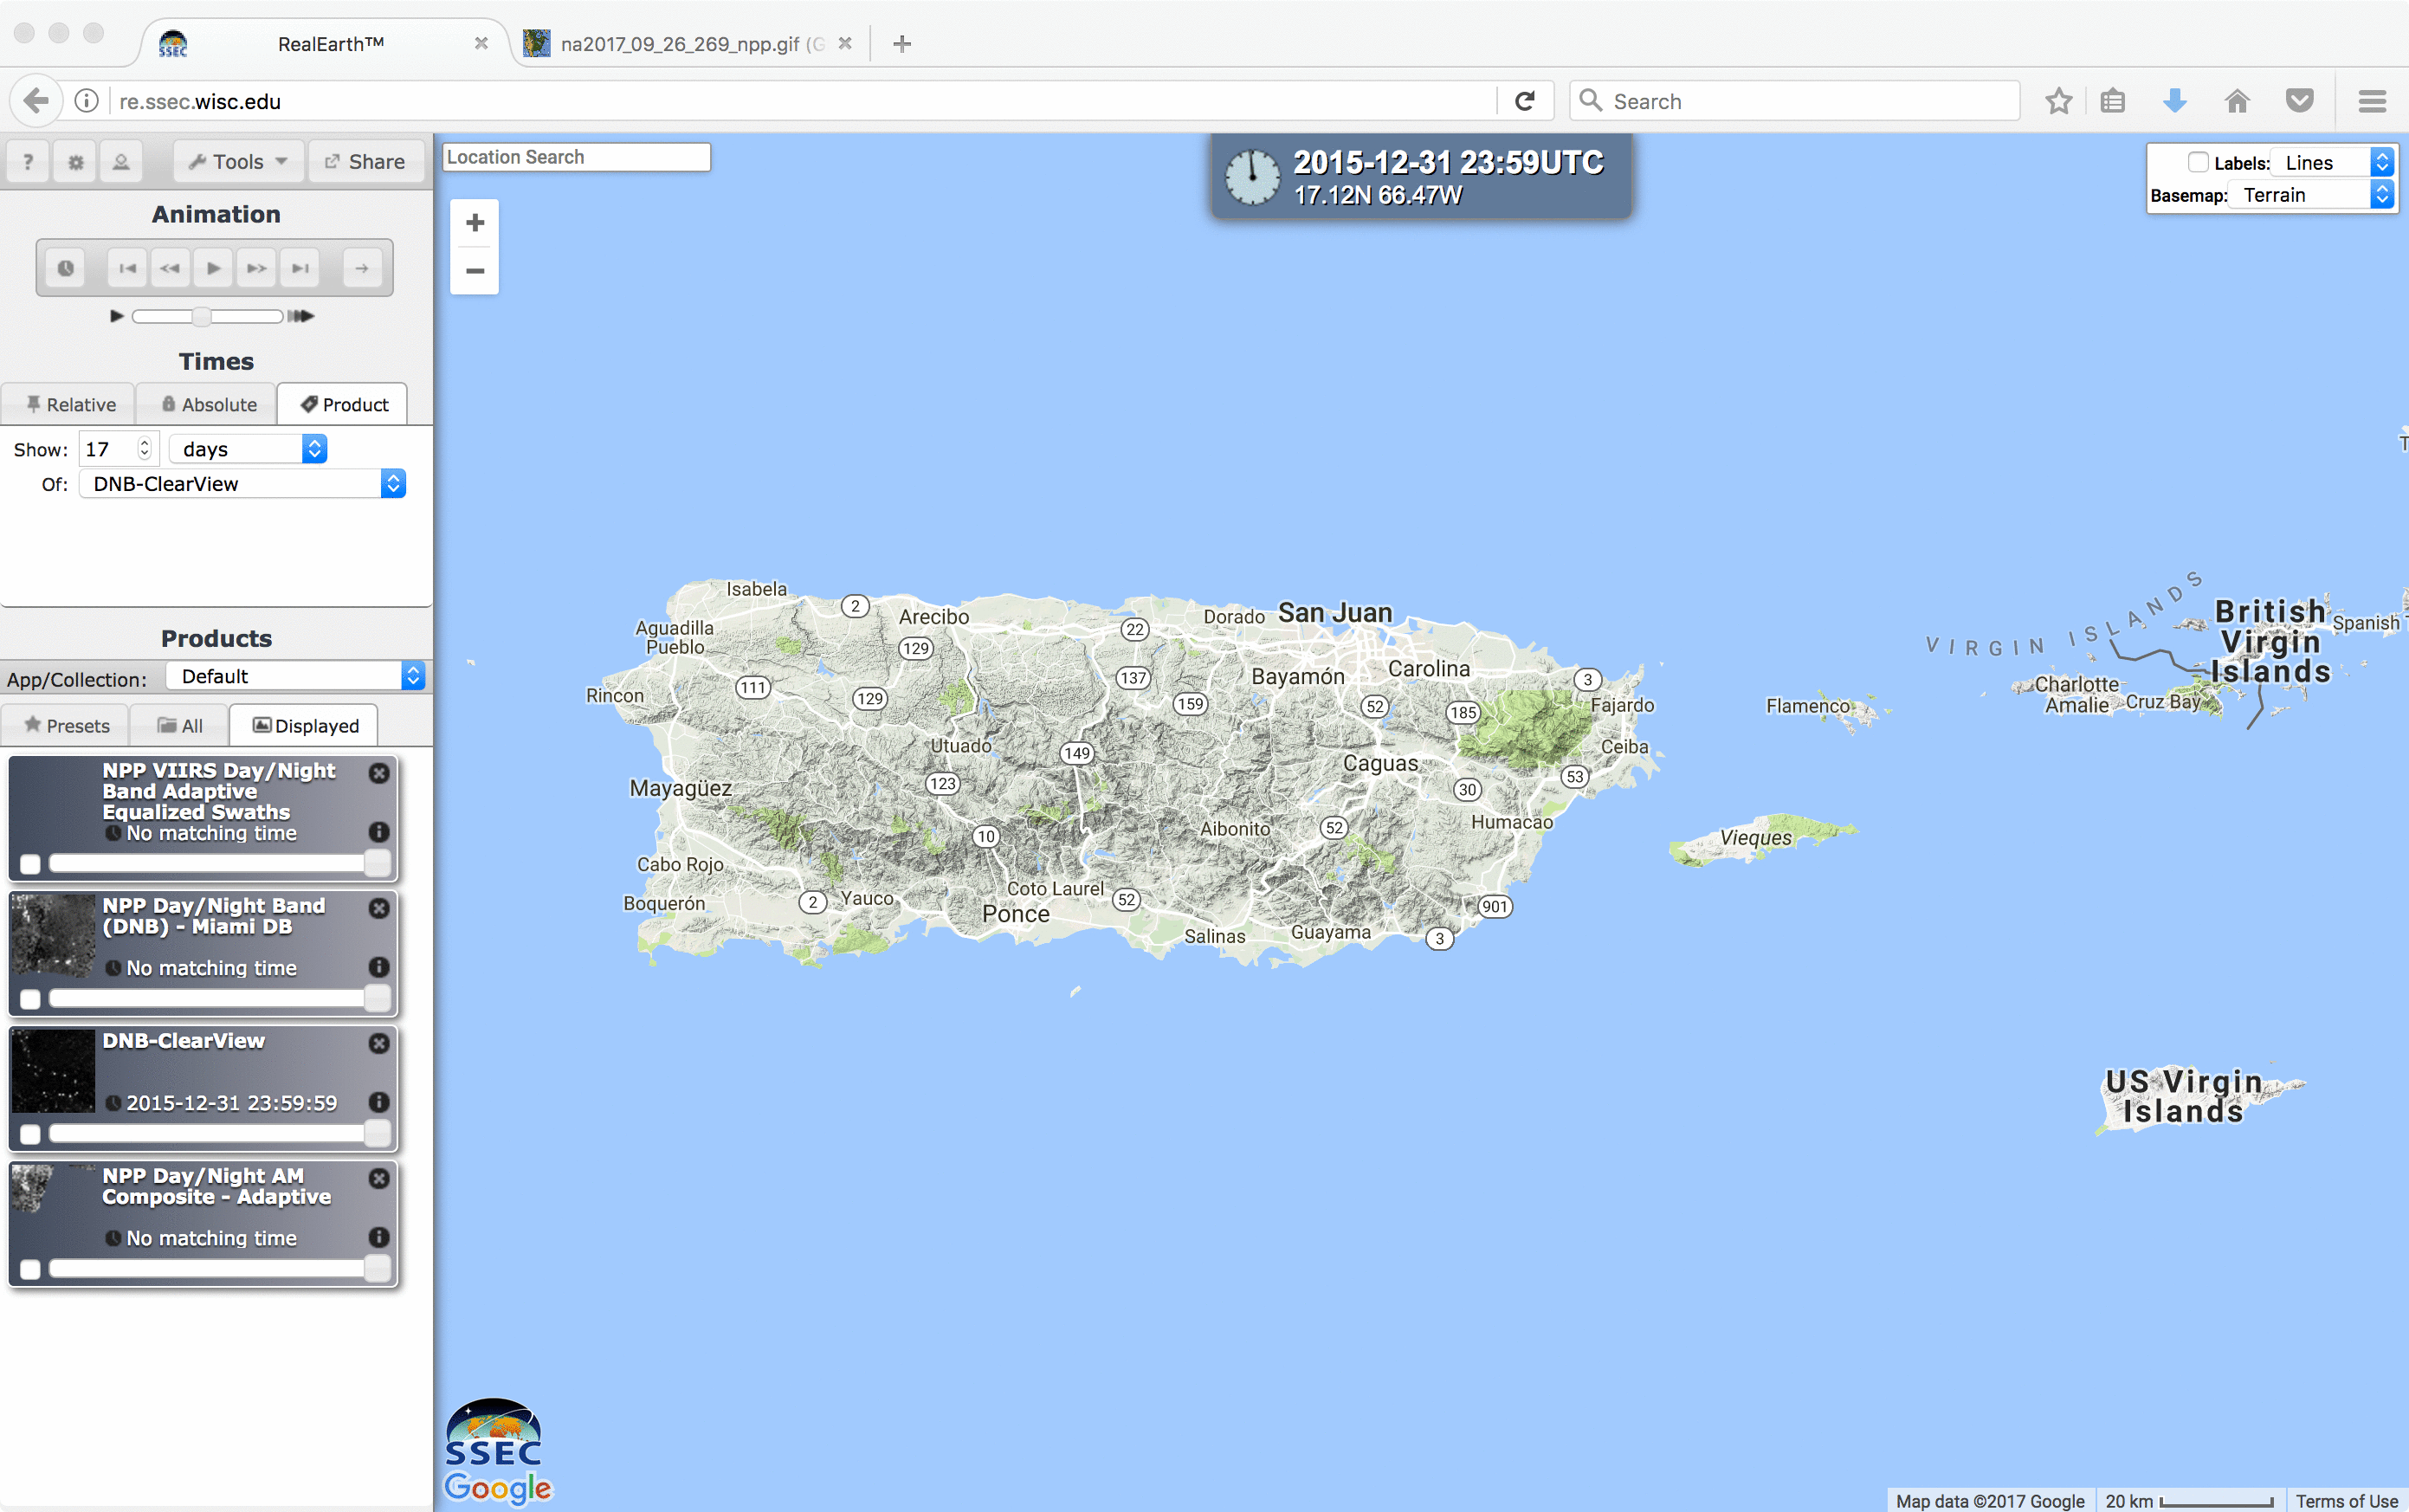
Suomi NPP VIIRS Day/Night Band (0.7 µm) images: an archived “clear sky’ view from 31 December 2015, and a “after-Maria” image from 26 September 2017 [click to enlarge]
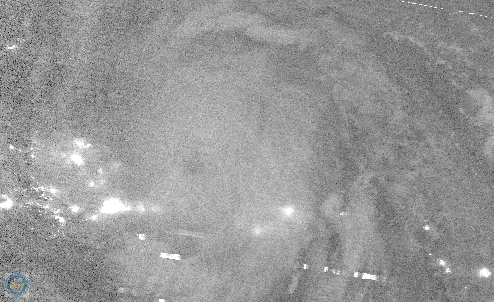
The Infrared Imagery, below, suggests a few clouds over northwest Puerto Rico. Such clouds could alter the perception of light sources in that region.
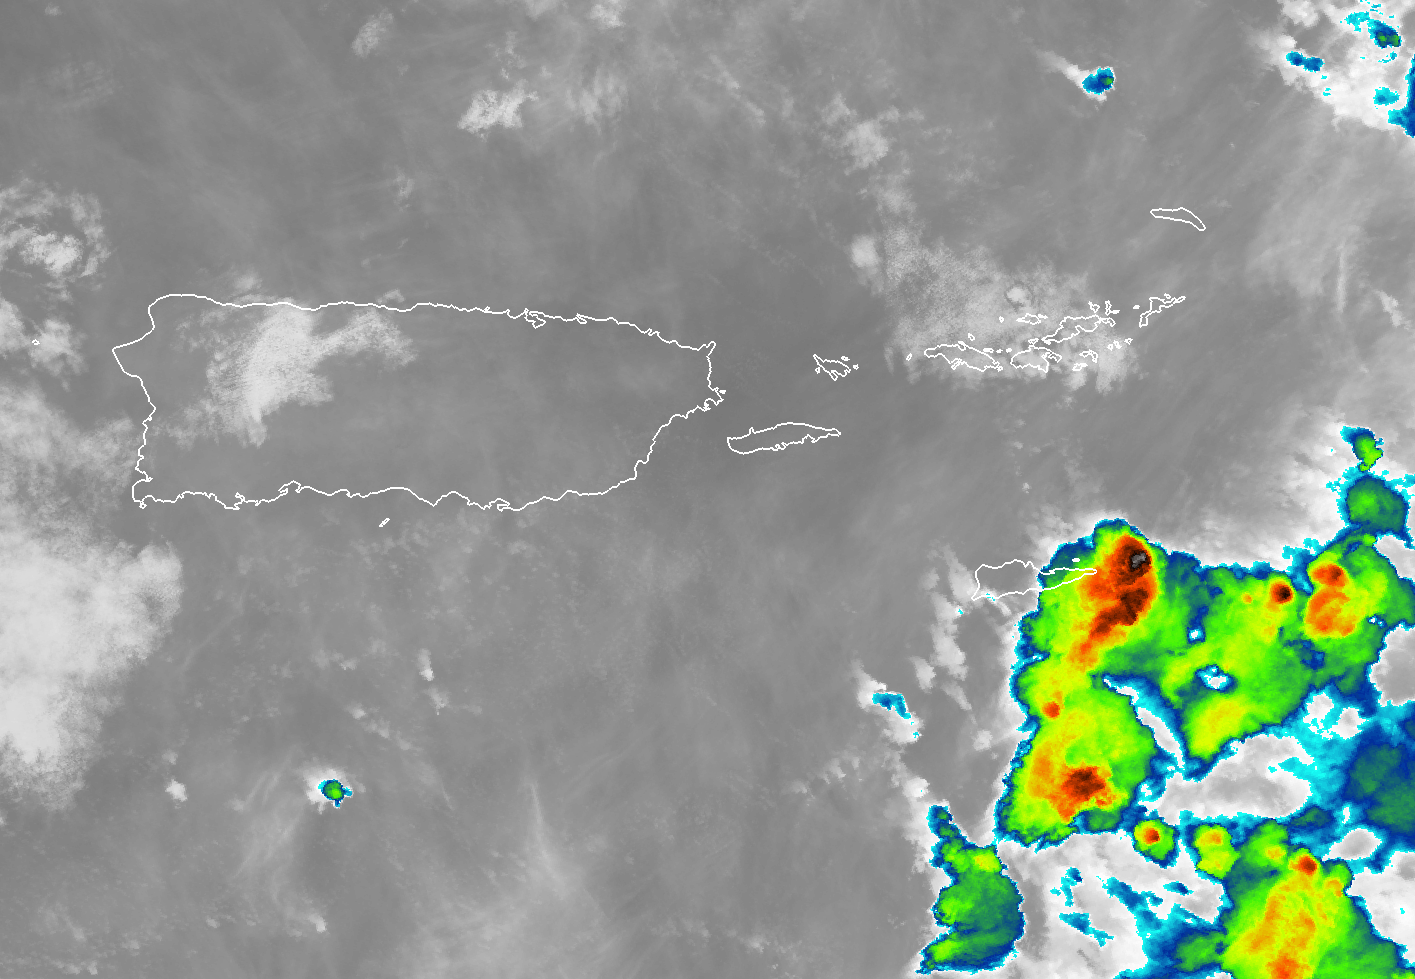
Suomi NPP VIIRS Infrared (11.45 µm) Imagery, 0619 UTC on 25 September 2017 (Click to enlarge)
View only this post Read Less
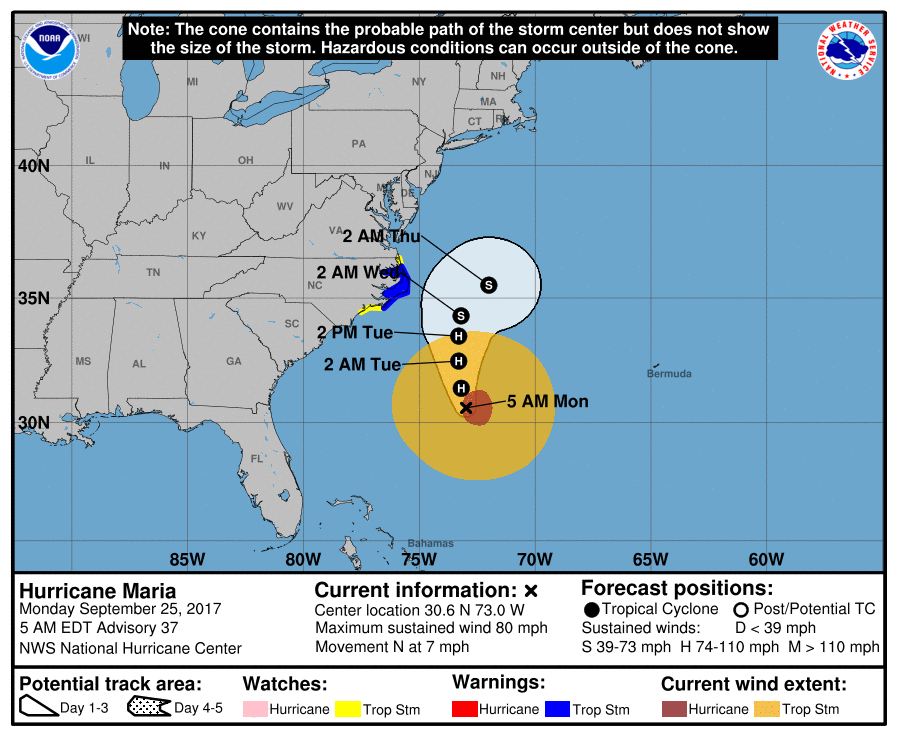
![Track of Hurricane Maria [click to enlarge]](https://cimss.ssec.wisc.edu/satellite-blog/wp-content/uploads/sites/5/2017/09/170924_maria_track.jpg)
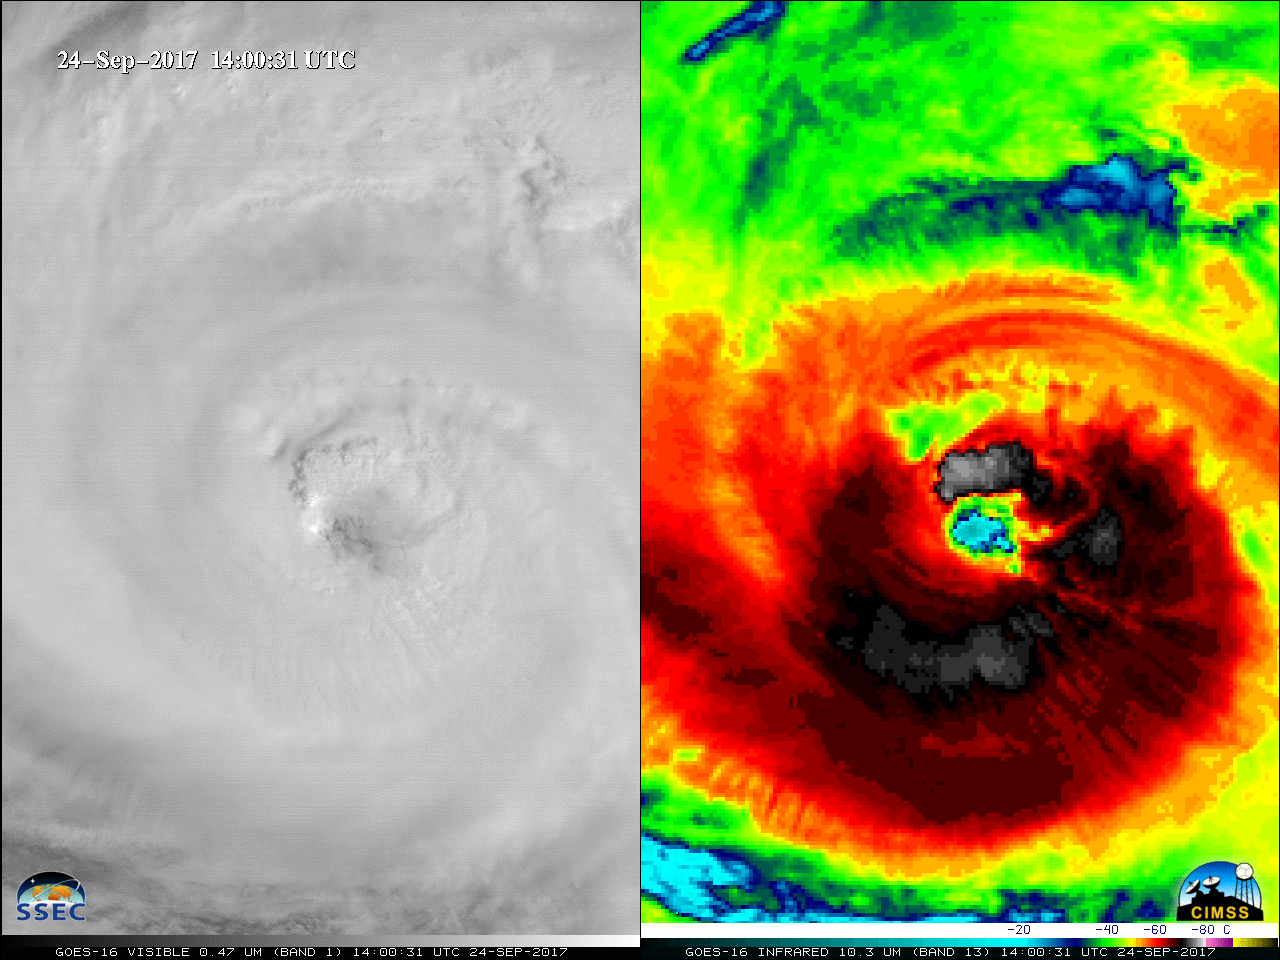
![GOES-16 Visible (0.64 µm, left) and Infrared Window (10.3 µm, right) images [click to play MP4 animation]](https://cimss.ssec.wisc.edu/satellite-blog/wp-content/uploads/sites/5/2017/09/958x638_AGOES16_B213_G16_VIS_IR_MARIA_MESO_24SEP2017_2017267_140031_0002PANELS.GIF)

