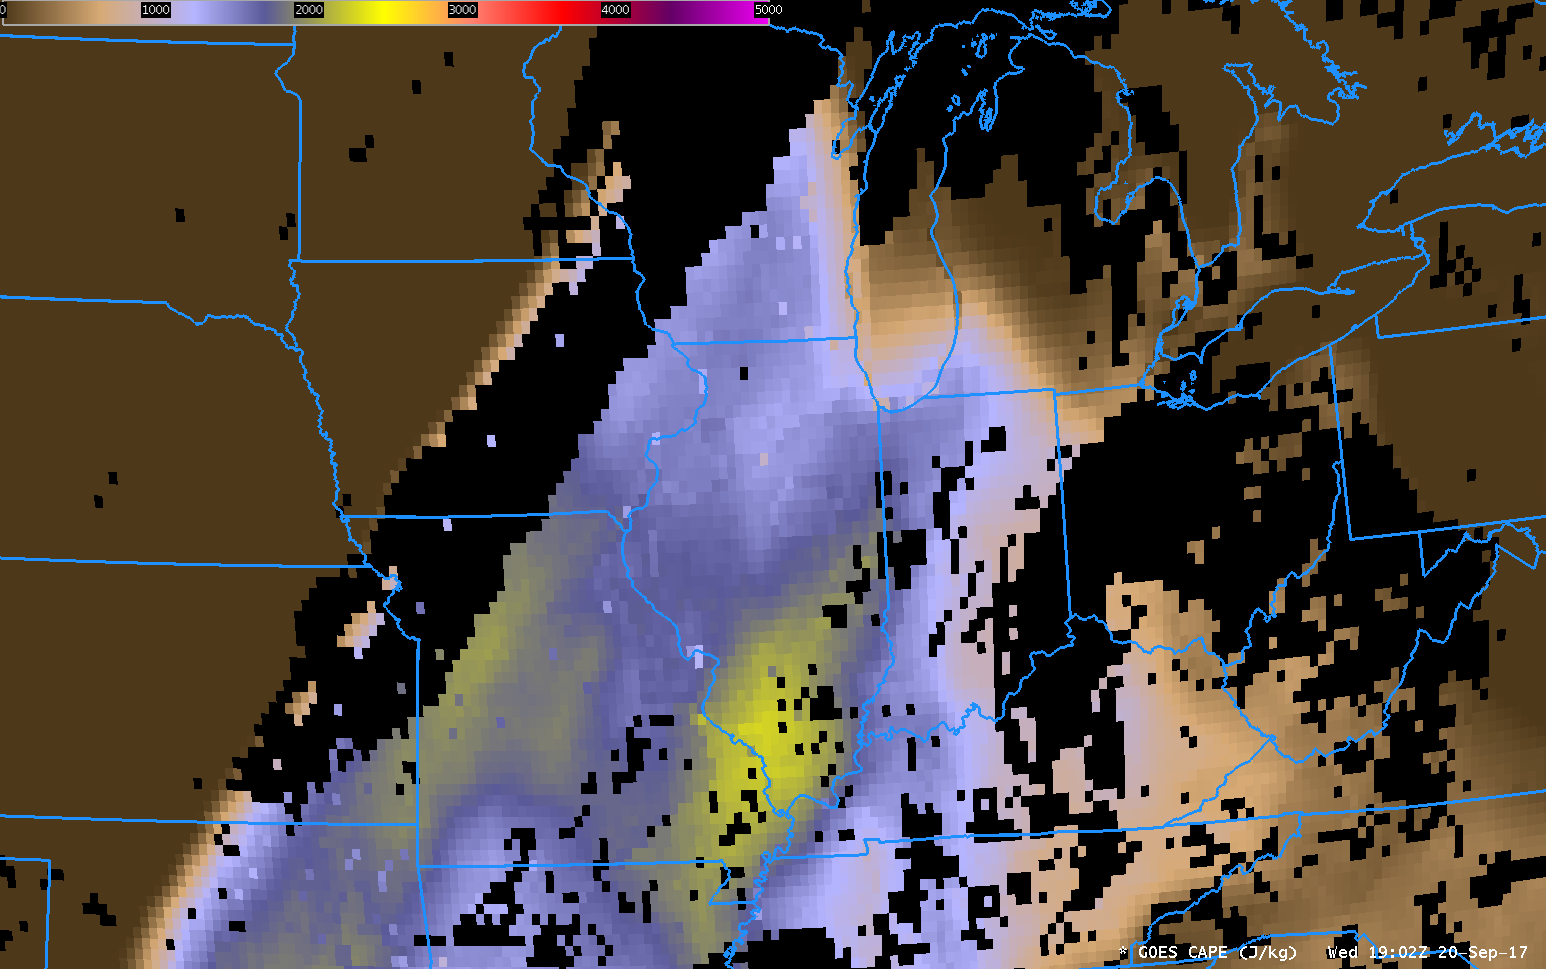
GOES-16 Derived Convective Available Potential Energy (CAPE), 1702-2137 UTC on 20 September 2017 (Click to enlarge)
GOES-16 data posted on this page are preliminary, non-operational and are undergoing testing
GOES-16 Data are used to create many Baseline Products that can be used to monitor and anticipate weather. The animation above shows the GOES-16 Convective Available Potential Energy (CAPE). Values increased by about 50-75% in a corridor from southern Wisconsin southwestward to Missouri over the course of four hours as shown in the loop. CAPE varies over Illinois, with a minimum extending from Chicago southwestward, with larger values to the east and to the west. The CAPE developed in a region where the Storm Prediction Center had a slight risk of severe weather. A Mesoscale Discussion for the region was also issued. Hail up to two inches in diameter was reported in central Wisconsin.
Baseline Stability Products are Clear-Sky only products. (They are also available online here, albeit delayed.) Because they are Clear-Sky products, they are most useful for monitoring the pre-convective environment.
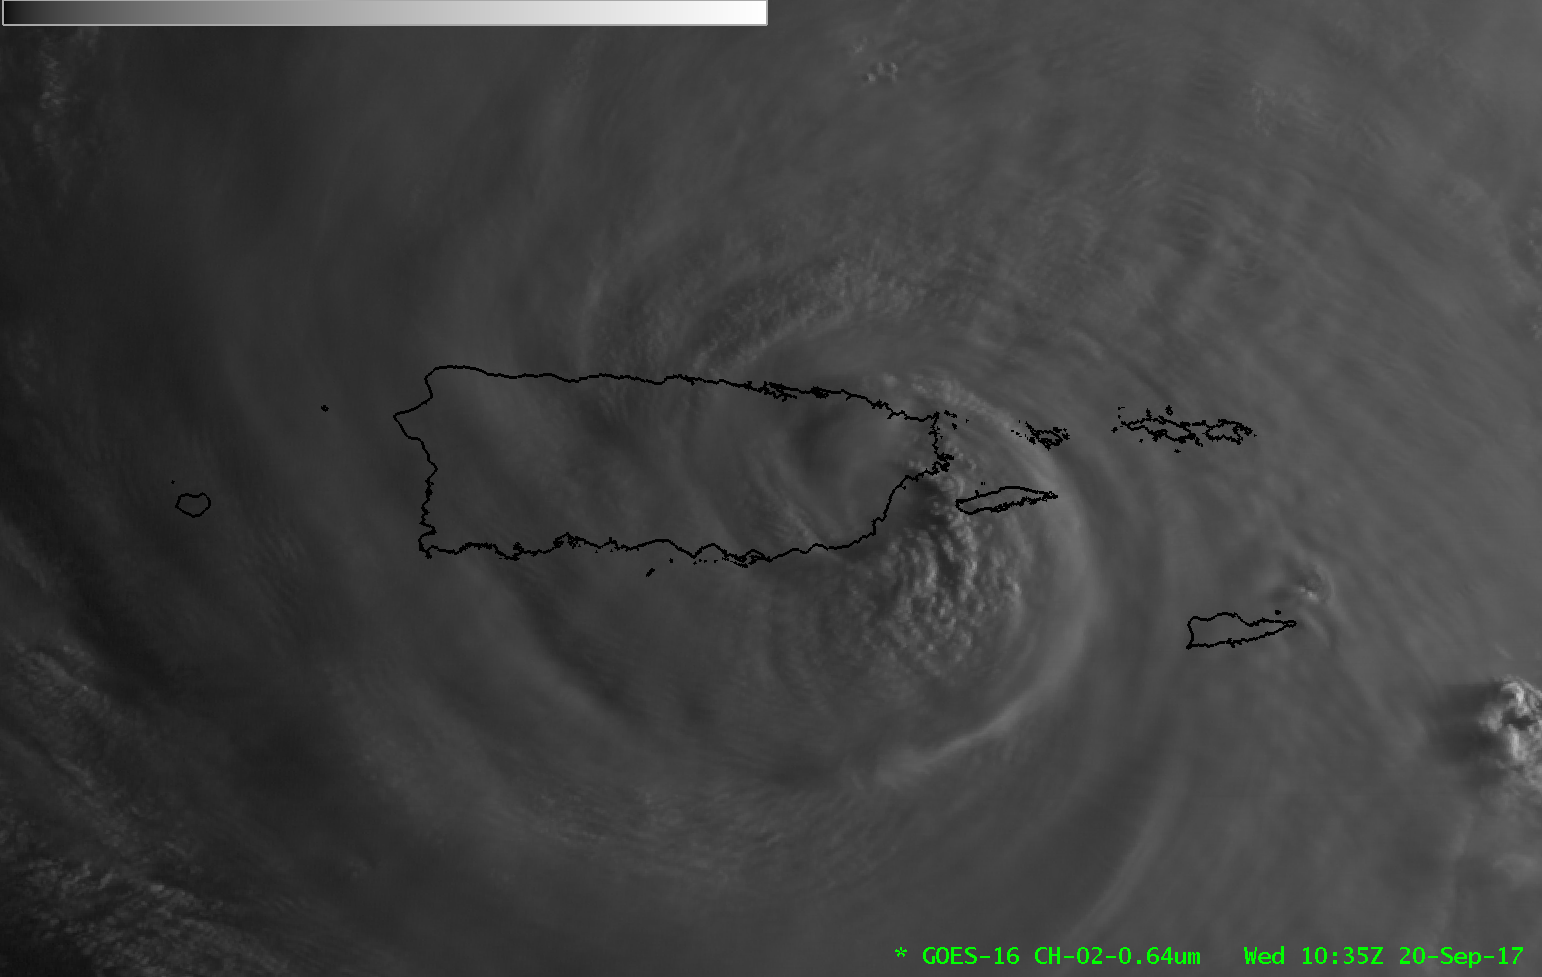
GOES-16 Visible (0.64 µm) Imagery, 1702-2137 UTC on 20 September 2017 (Click to enlarge)
Visible Imagery (0.64 µm) for the same period as the CAPE animation, above, shows the development of convection along a front moving into Wisconsin. Note also the lack of cumulus development in the CAPE minimum over Illinois. The large CAPE values over southwestern Missouri were not tapped, as convection did not trigger there.
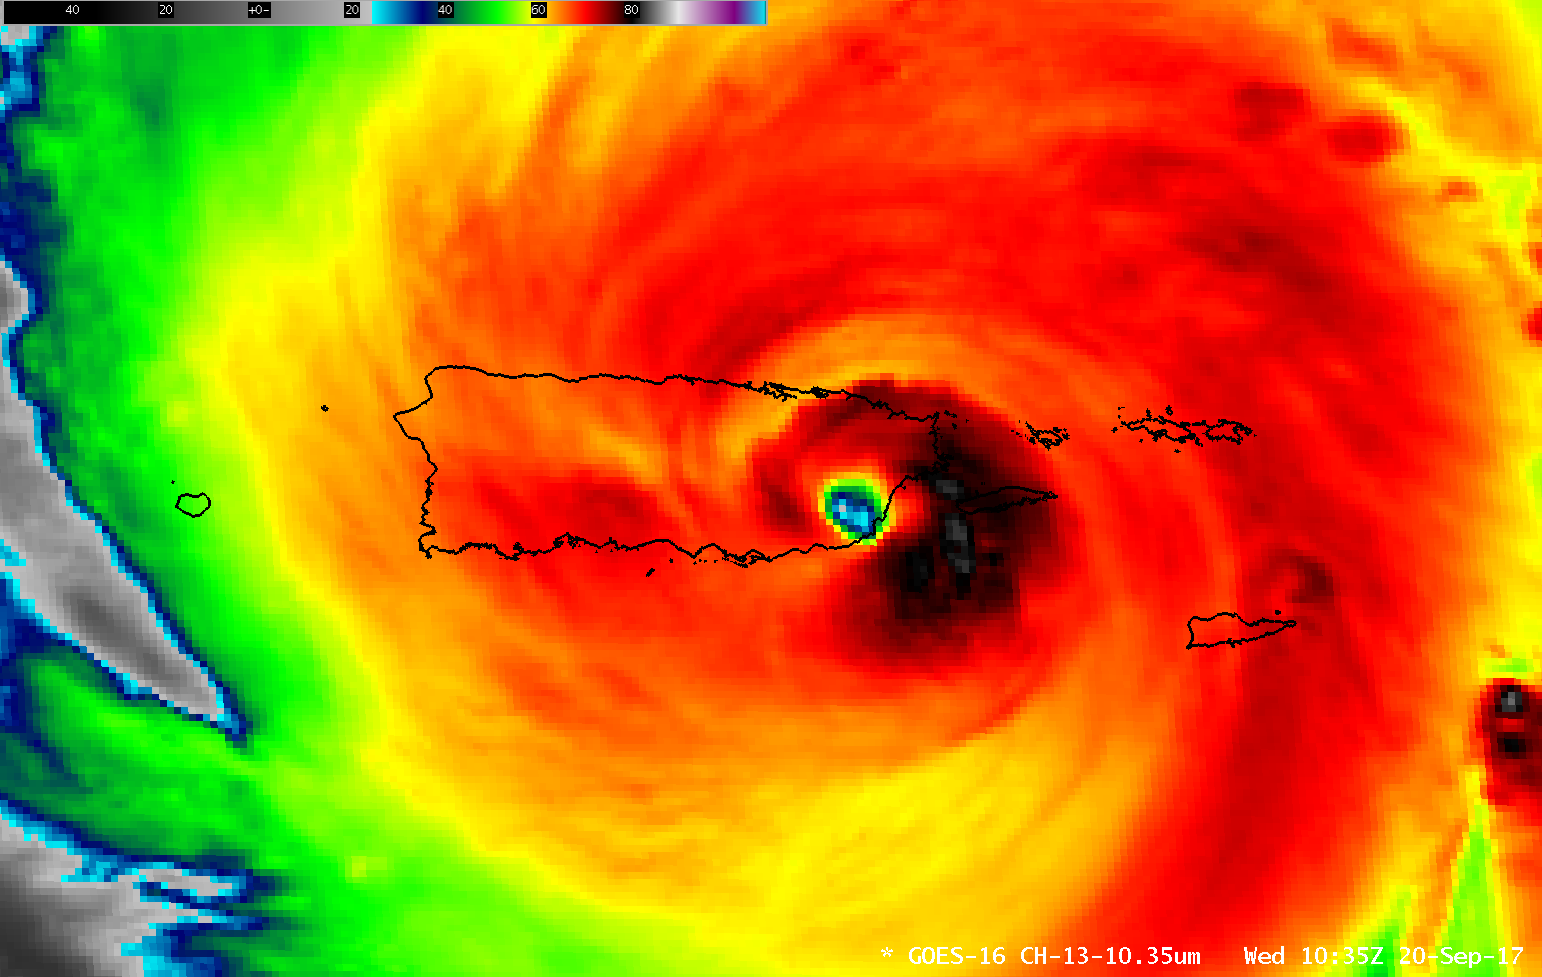
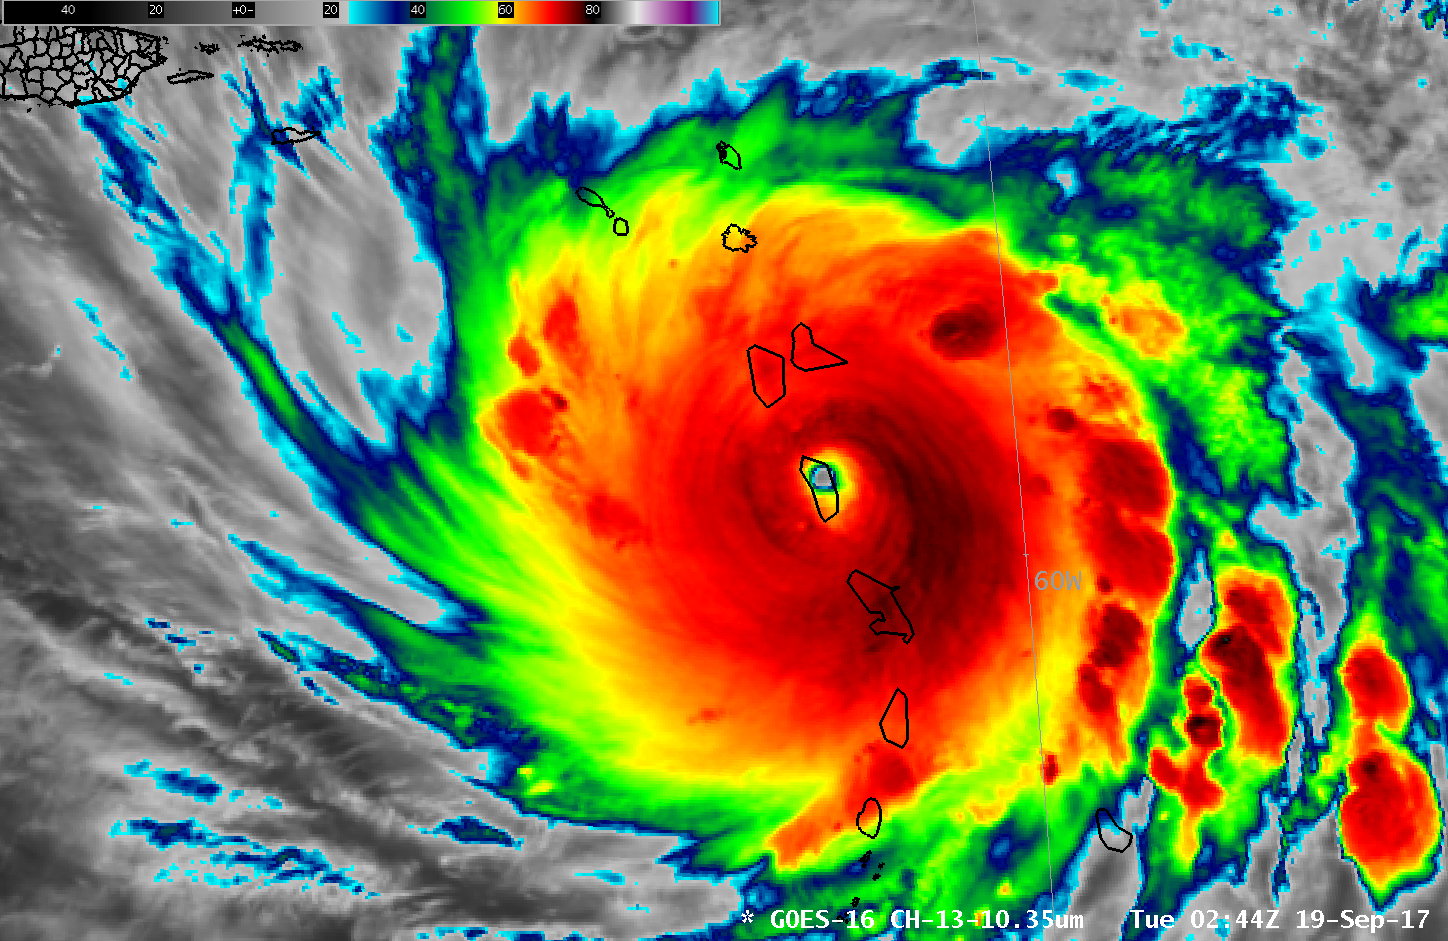
(Added: Click here to see a Band 13 “Clean Window” Infrared (10.3 µm) animation from GOES-16, from 2302 UTC on 20 September to 0652 UTC on 21 September.)
View only this post Read Less


