
GOES-16 Brightness Temperature Difference (10.3 µm – 3.9 µm) “Fog Product” from 0202 – 0357 UTC on 18 October 2017 (Click to animate)
GOES-16 data posted on this page are preliminary, non-operational and are undergoing testing.
Stratus and Fog formed over the valleys of Kentucky (and in surrounding states) early on 18 October 2017 (It was there on 17 October as well). When was the fog first obvious from Satellite imagery? It very much depends on the spatial resolution of the Satellite viewing the scene. The Brightness Temperature Difference field (10.3 µm – 3.9 µm) from GOES-16, shown above, can be used to identify regions of stratus clouds that are made up of water droplets. Carefully examine the animation; the time when fog is definitively present over valleys of eastern Kentucky (around 84º W Longitude) is around 0327 UTC.
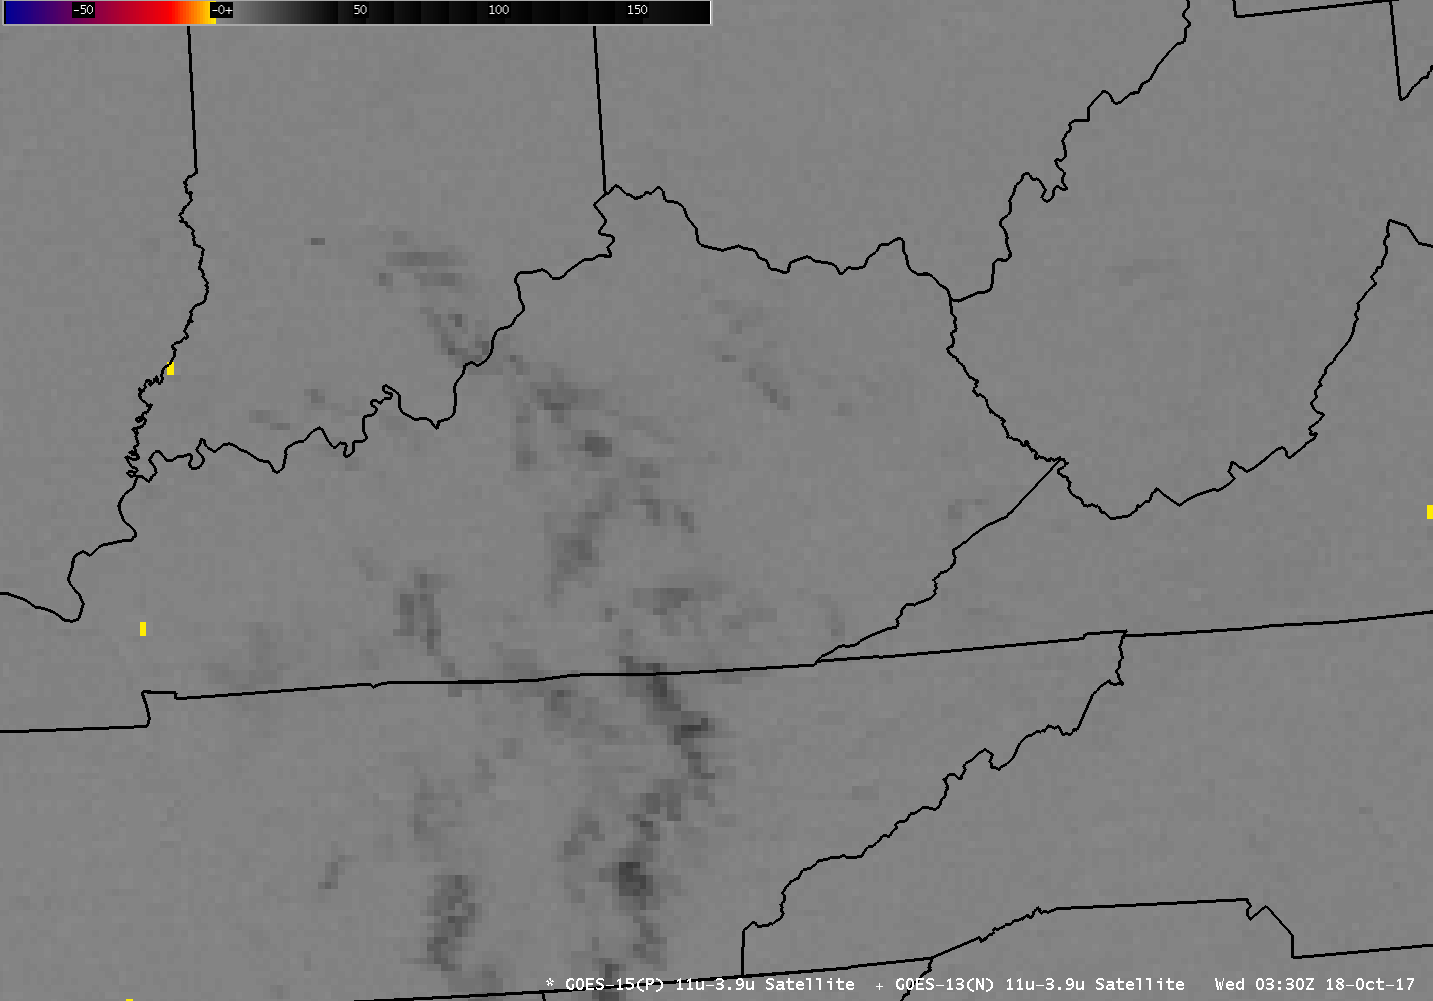
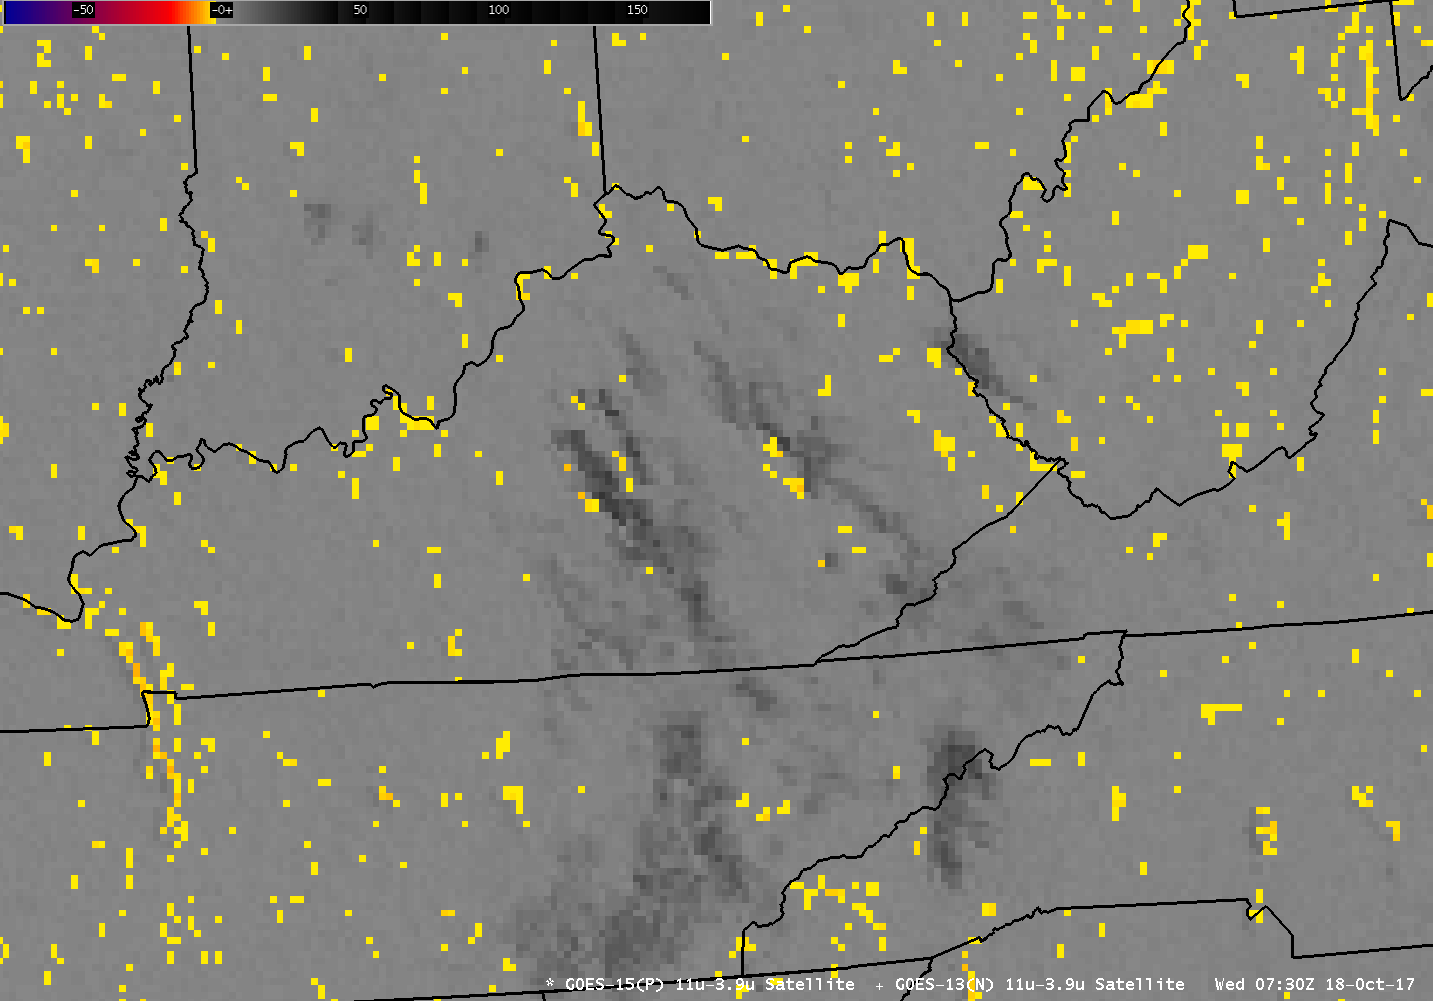
GOES-16 has 2-km resolution (at the sub-satellite point — 89.5º W Longitude during GOES-16 Check-out); this is superior to GOES-13’s nominal 4-km resolution at the subpoint (75º West Longitude). The GOES-13 Brightness Temperature Difference Field (10.7 µm – 3.9 µm) at 0330 UTC shows no distinct indication of Fog/Stratus over eastern Kentucky. A series of animations of the GOES-13 Brightness Temperature Difference field, from 0215-0345 UTC, from 0415-0500, from 0545-0700 and from 0700-0815 suggest GOES-13 identified the region of fog about 4 hours after GOES-16, at 0730 UTC.
The GOES-13 vs. GOES-16 toggle below, from 0700 UTC on 18 October 2017, shows how the resolution improvement with GOES-16 facilitates earlier detection of fog and stratus as it develops overnight.

Toggle between 0700 UTC 18 October 2017 Brightness Temperature Differences from GOES-13 (10.7 µm – 3.9 µm) and GOES-16 (10.3 µm – 3.9 µm) (Click to enlarge)
View only this post Read Less
![Meteosat-10 Water Vapor (6.25 µm) images, with hourly surface wind gusts (knots) plotted in red [click to play MP4 animation]](https://cimss.ssec.wisc.edu/satellite-blog/wp-content/uploads/sites/5/2017/10/960x1280_AMET10_B5_MET10_WV_OPHELIA_16OCT2017_2017289_071500_0001PANEL.GIF)
![Meteosat-10 Water Vapor (7.35 µm) images, with hourly surface wind gusts (knots) plotted in red [click to play MP4 animation]](https://cimss.ssec.wisc.edu/satellite-blog/wp-content/uploads/sites/5/2017/10/960x1280_AMET10_B6_MET10_B6_WV_OPHELIA_16OCT2017_2017289_071500_0001PANEL.GIF)
![Time series plot of surface data from Cork, Ireland [click to enlarge]](https://cimss.ssec.wisc.edu/satellite-blog/wp-content/uploads/sites/5/2017/10/171016_EICK_SFCMG.GIF)
![Time series plot of surface data from Valley, United Kingdom [click to enlarge]](https://cimss.ssec.wisc.edu/satellite-blog/wp-content/uploads/sites/5/2017/10/171016_EGOV_SFCMG.GIF)
![Terra and Aqua MODIS true-color images [click to enlarge]](https://cimss.ssec.wisc.edu/satellite-blog/wp-content/uploads/sites/5/2017/10/171016_terra_aqua_modis_ex_ophelia_anim.gif)
![Time series plot of surface data from Isle of Man [click to enlarge]](https://cimss.ssec.wisc.edu/satellite-blog/wp-content/uploads/sites/5/2017/10/171016_EGNS_SFCMG.GIF)
![GOES-13 Visible (0.63 µm, left) and Infrared Window (10.7 µm, right) images, with hourly surface reports (in metric units) plotted in yellow [click to animate]](https://cimss.ssec.wisc.edu/satellite-blog/wp-content/uploads/sites/5/2017/10/171014_goes13_visible_infrared_Ophelia_anim.gif)
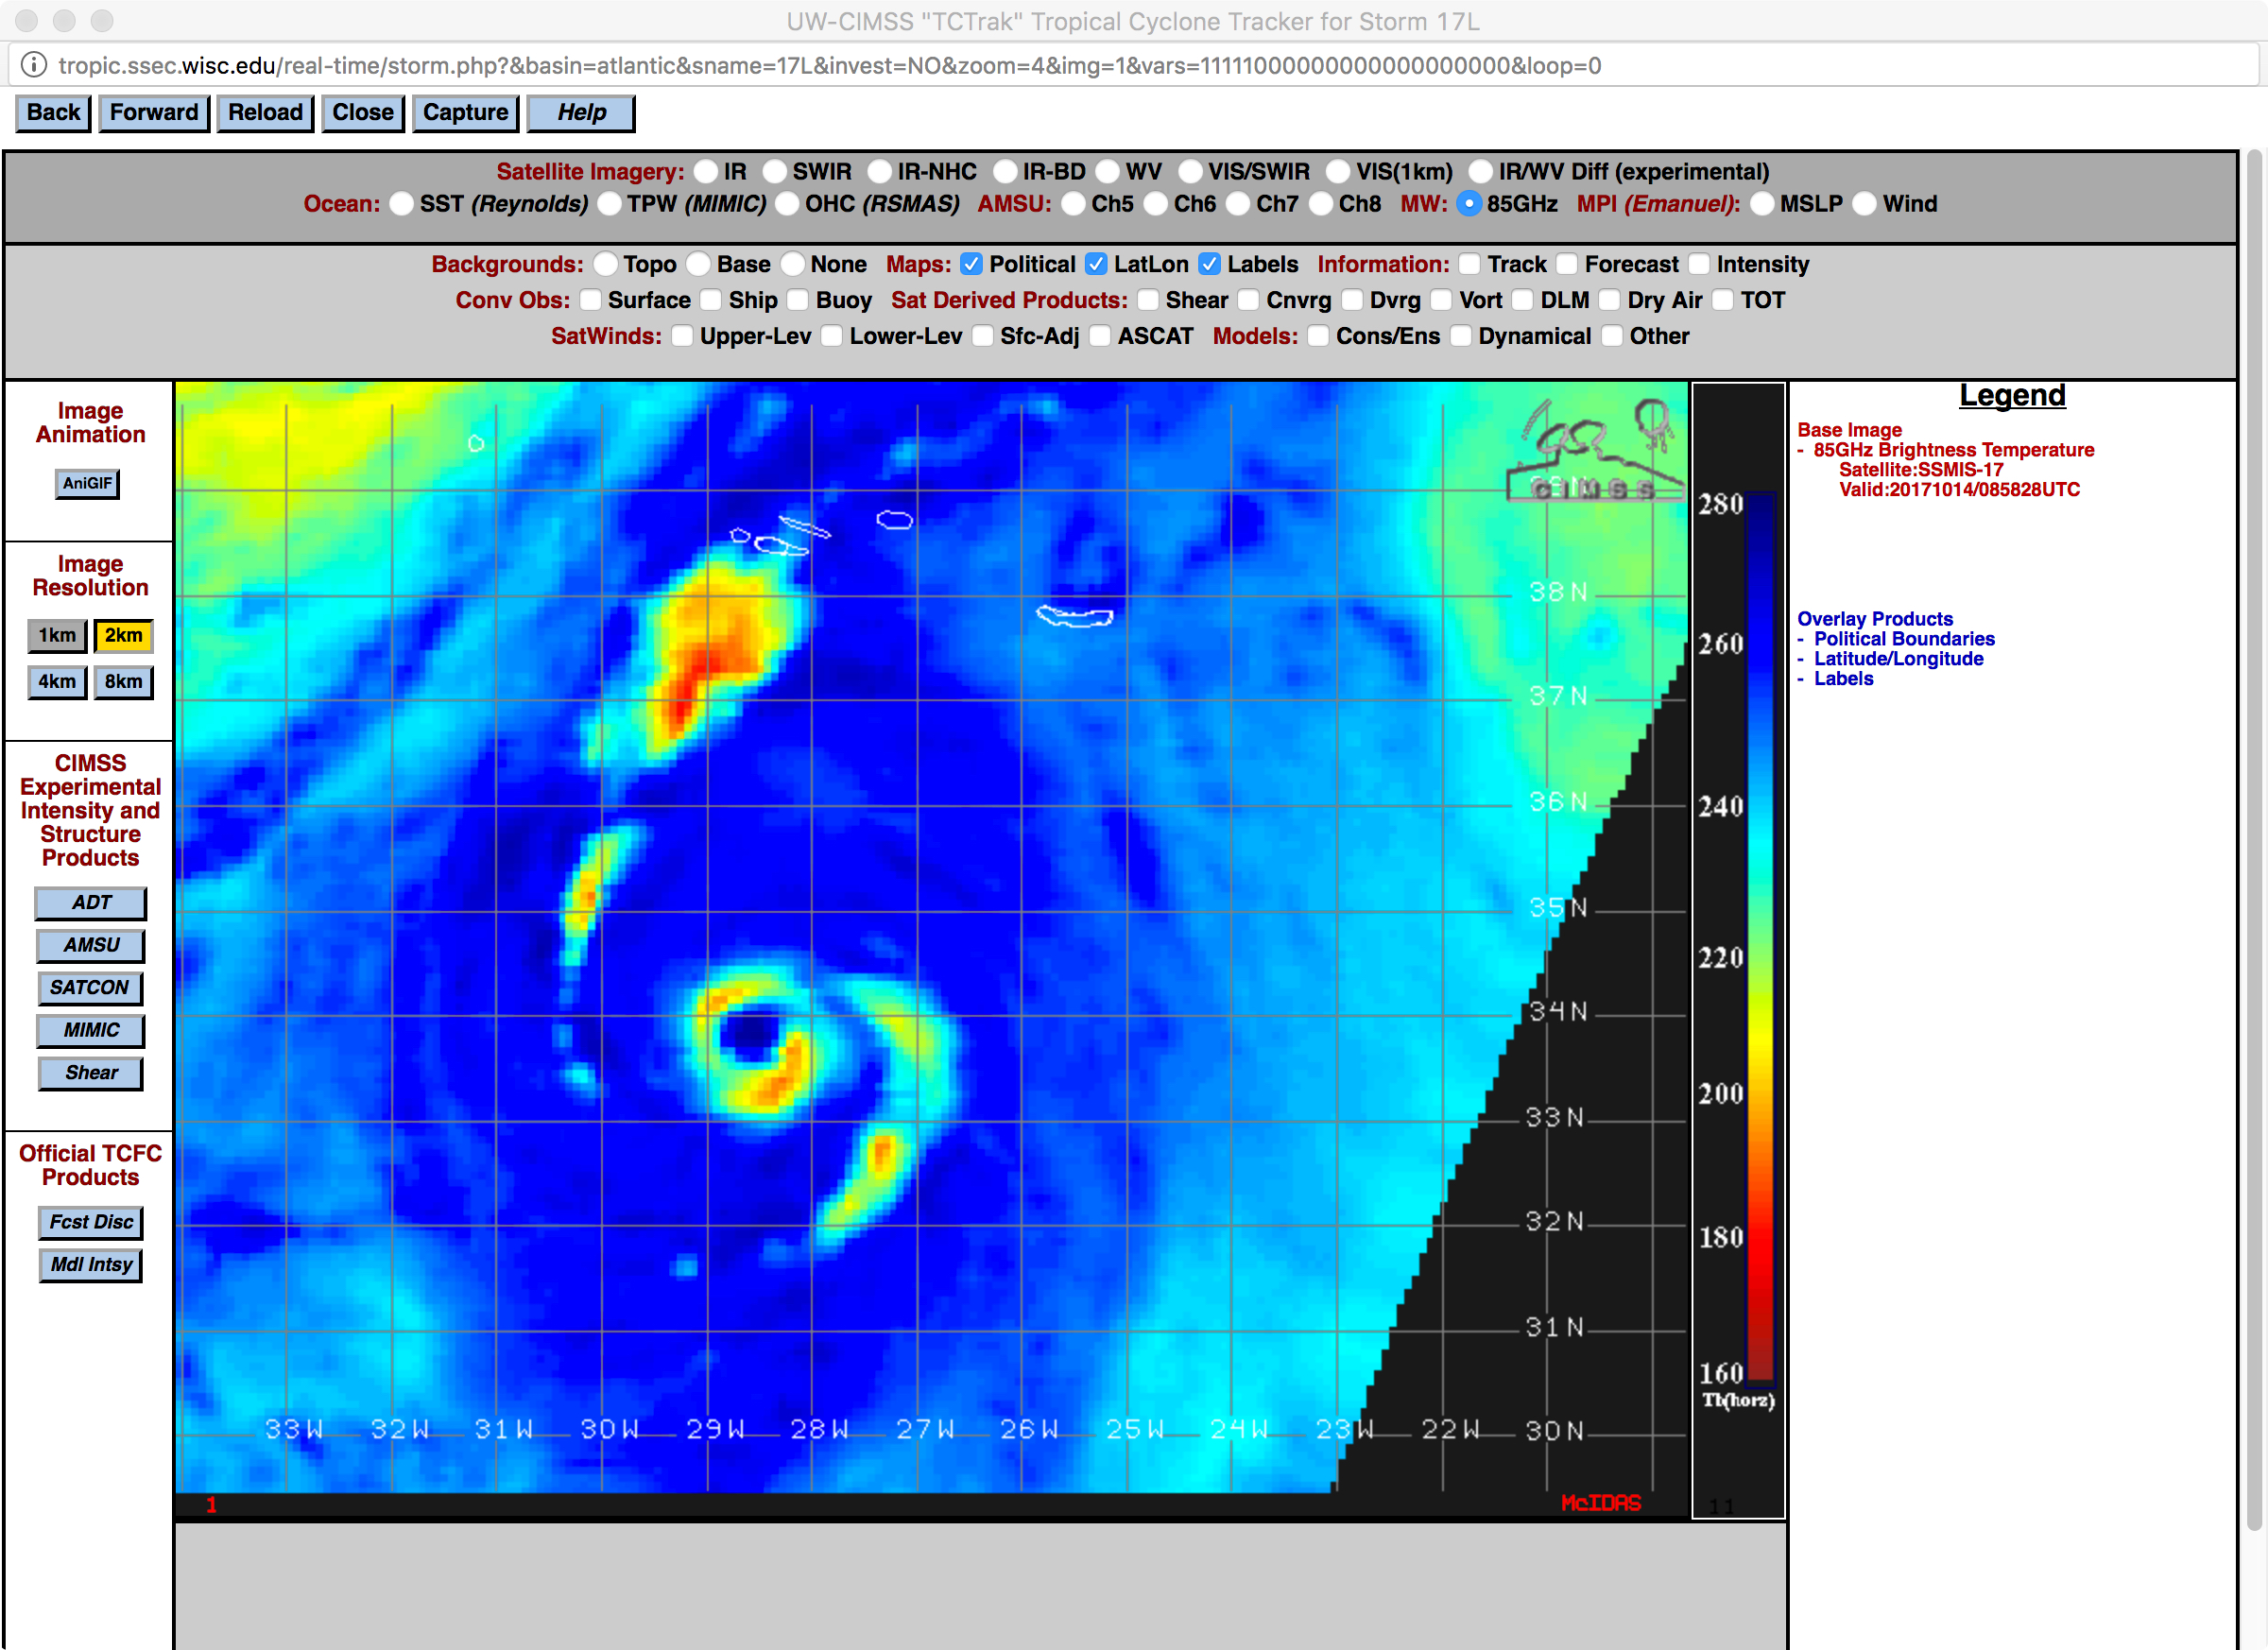
![DMSP-17 SSMIS Microwave (85 GHz) image [click to enlarge]](https://cimss.ssec.wisc.edu/satellite-blog/wp-content/uploads/sites/5/2017/10/171014_0858utc_dmsp17_ssmis_microwave_Ophelia.jpg)
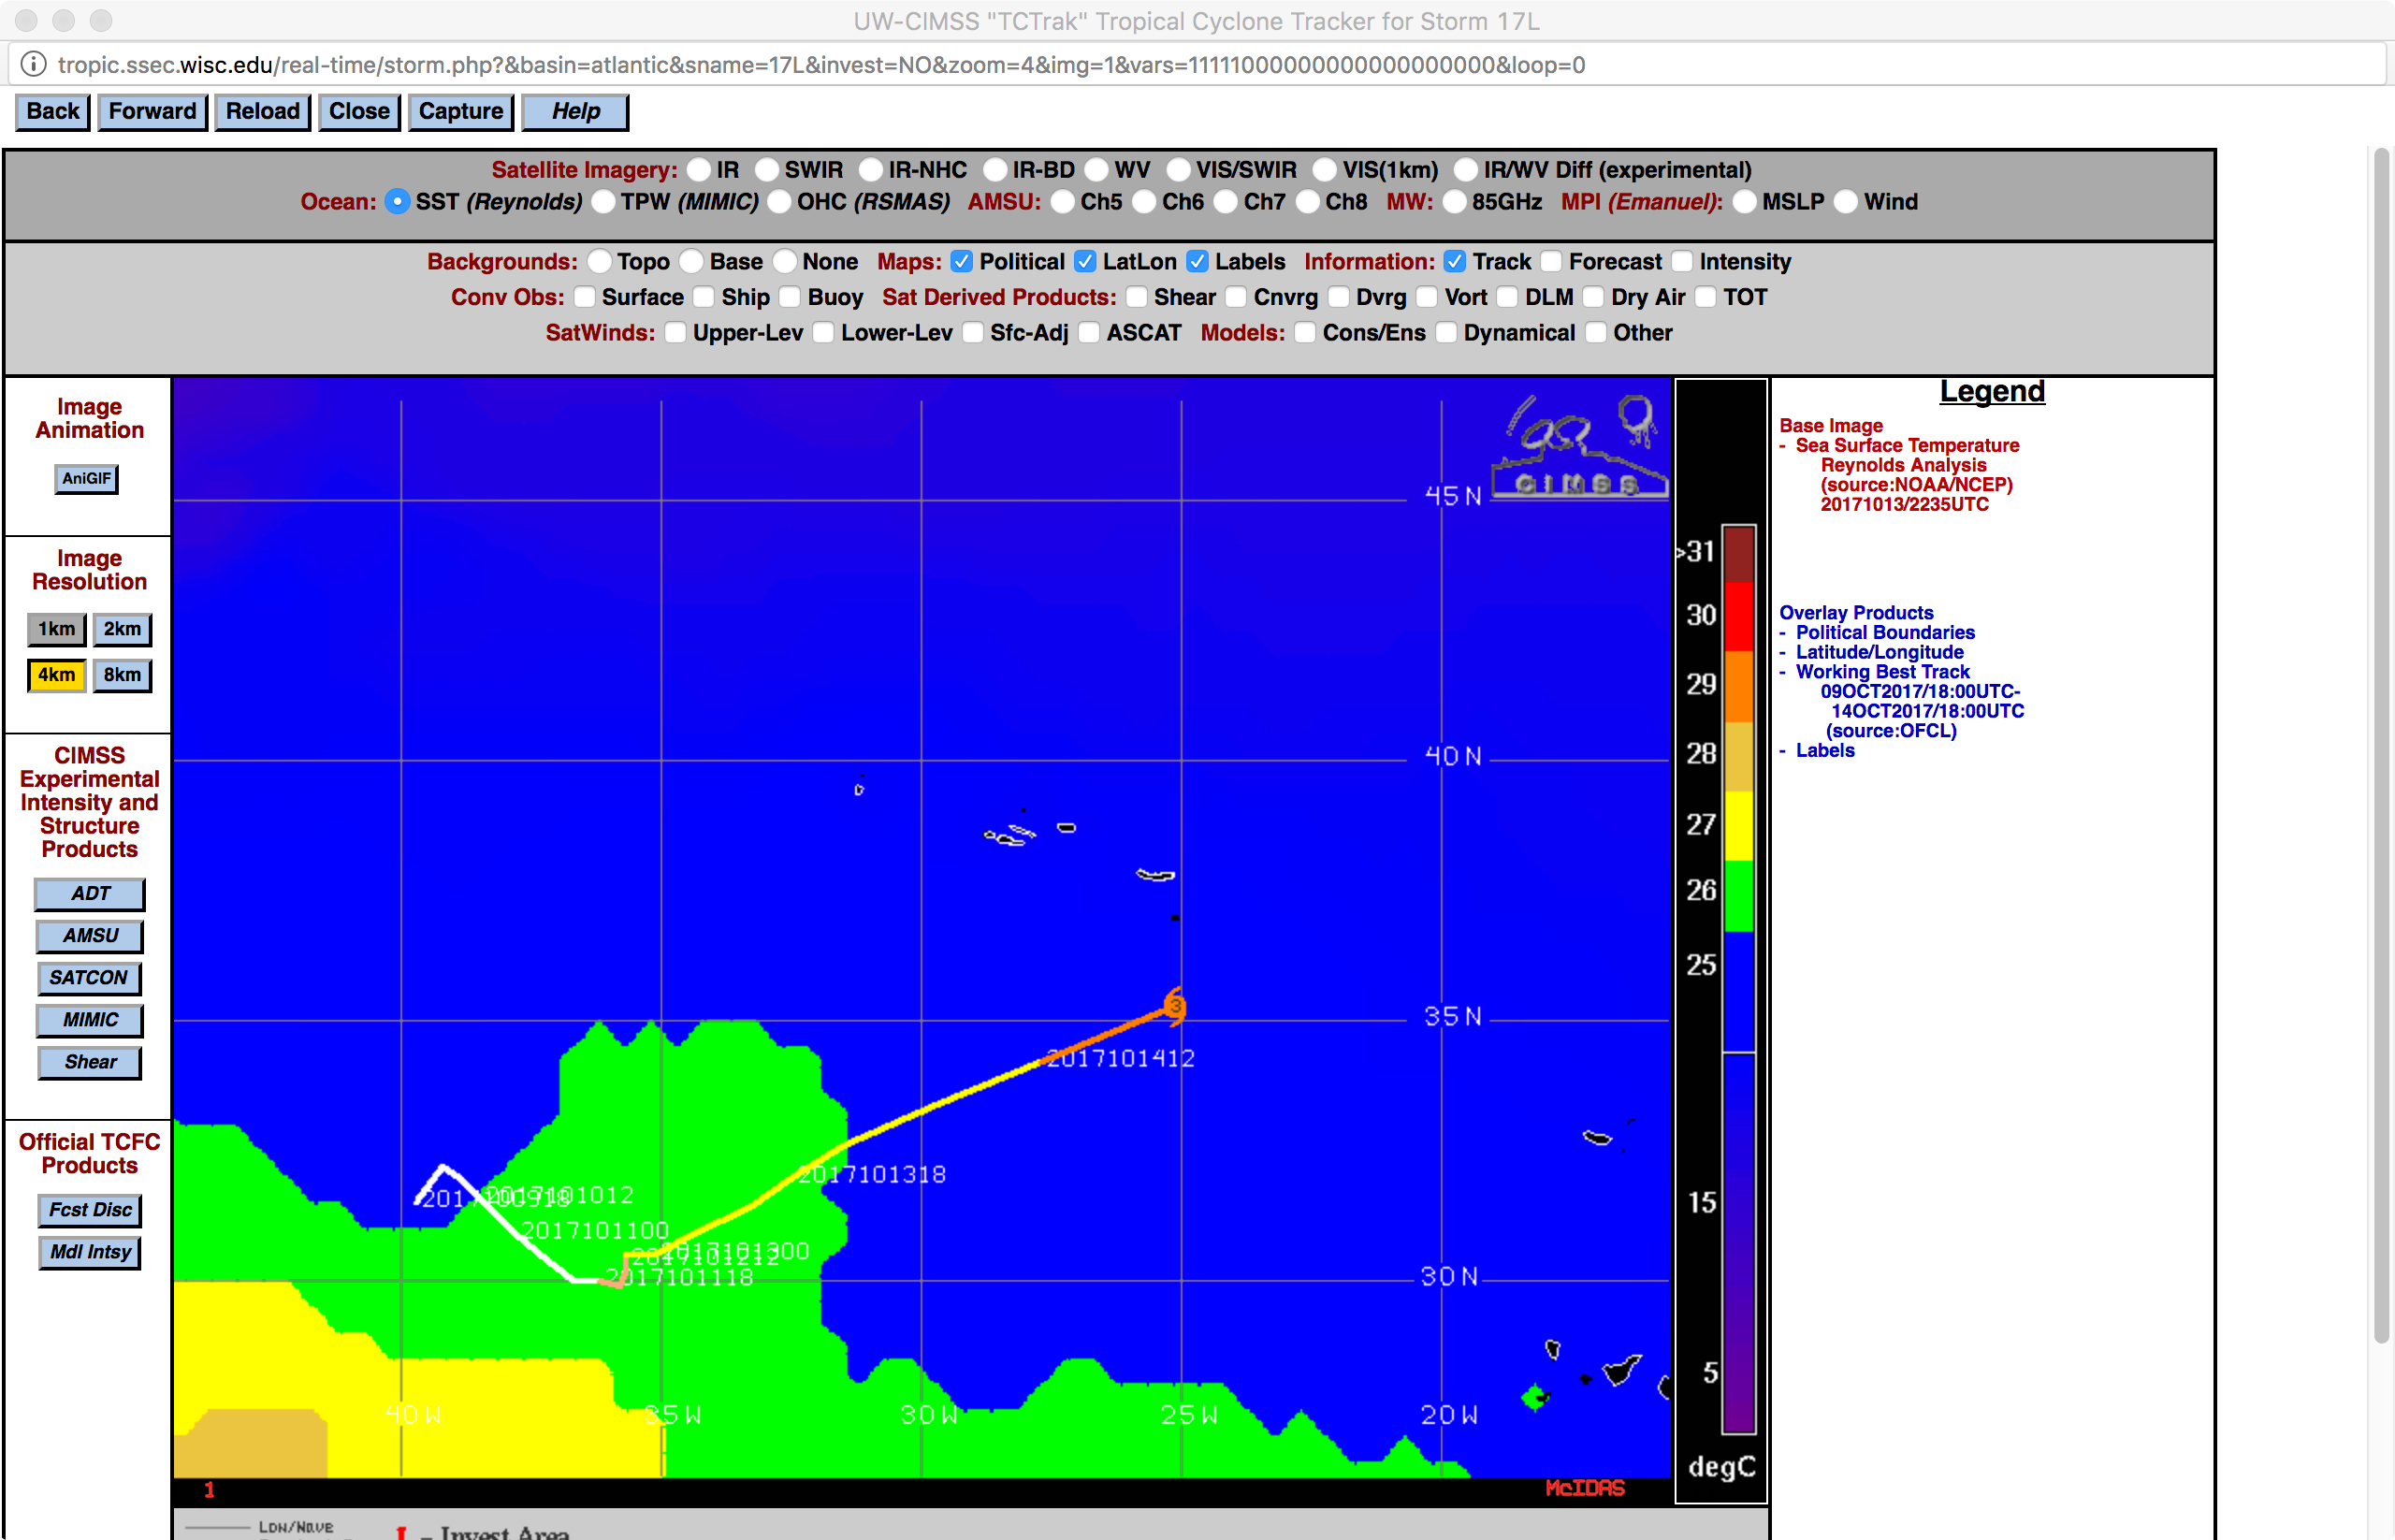
![Maximum Potential Instability wind speed plot from 13 October, with the track of Ophelia as of 18 UTC on 14 October [click to enlarge]](https://cimss.ssec.wisc.edu/satellite-blog/wp-content/uploads/sites/5/2017/10/171013_1300utc_mpi_wind_speed_Ophelia.jpg)


