A waterspout developed over Humboldt Bay Thursday, January 25th around 4:40 pm and moved through the Woodley Island Marina, dissipating only a minute or so later. Security cameras captured the waterspout moving through the marina onto the island. https://t.co/EIgAPN2BTE
— NWS Eureka (@NWSEureka) January 27, 2018
A waterspout moved inland near the NWS Eureka forecast office during the late afternoon hours on 25 January 2018. The brief tornado caused some EF-0 damage (interestingly, it was the only report of severe weather in the US that day, and the first tornado in the Eureka forecast area since 1998).
A comparison of GOES-16 (GOES-East) “Red” Visible (0.64 µm) and “Clean” Infrared Window (10.3 µm) images (below) showed the line of convection as it moved across the area (Eureka and the location of the 0040-0041 UTC tornado are a few miles south-southwest of the airport KACV) — the coldest cloud-top infrared brightness temperatures on the 0037 UTC and 0042 UTC GOES-16 images were -30.7ºC (dark blue color enhancement). Note: there were no western US images available from GOES-15 (GOES-West) between 0030 and 0100 UTC, due to a routine “New Day Schedule Transition” and a 0051 UTC Southern Hemisphere scan.
GOES-16 “Red” Visible (0.64 µm, left) and “Clean” Infrared Window (10.3 µm, right) images, with plots of hourly surface reports [click to play animation]
![NOAA-19 and GOES-16 Visible images at 2252 UTC, with plots of 23 UTC surface reports [click to enlarge]](https://cimss.ssec.wisc.edu/satellite-blog/wp-content/uploads/sites/5/2018/01/180126_0052utc_noaa19_goes16_visible_Eureka_CA_anim.gif)
NOAA-19 and GOES-16 Visible images at 2252 UTC, with plots of 23 UTC surface reports [click to enlarge]
![NOAA-19 and GOES-16 Infrared Window images at 2252 UTC, with plots of 23 UTC surface reports [click to enlarge]](https://cimss.ssec.wisc.edu/satellite-blog/wp-content/uploads/sites/5/2018/01/180126_0052utc_noaa19_goes16_infrared_Eureka_CA_anim.gif)
NOAA-19 and GOES-16 Infrared Window images at 2252 UTC, with plots of 23 UTC surface reports [click to enlarge]
![MODIS Sea Surface Temperature product [click to enlarge]](https://cimss.ssec.wisc.edu/satellite-blog/wp-content/uploads/sites/5/2018/01/180125_modis_sst_anim.gif)
MODIS Sea Surface Temperature product [click to enlarge]
View only this post Read Less
![GOES-16 Water Vapor (6.9 µm) images, with hourly precipitation type plotted in yellow [click to play MP4 animation]](https://cimss.ssec.wisc.edu/satellite-blog/wp-content/uploads/sites/5/2018/01/G16_WV9_WX1_BLIZZARD_22JAN2018_960x1280_B9_2018022_120220_0001PANEL_00145.GIF)
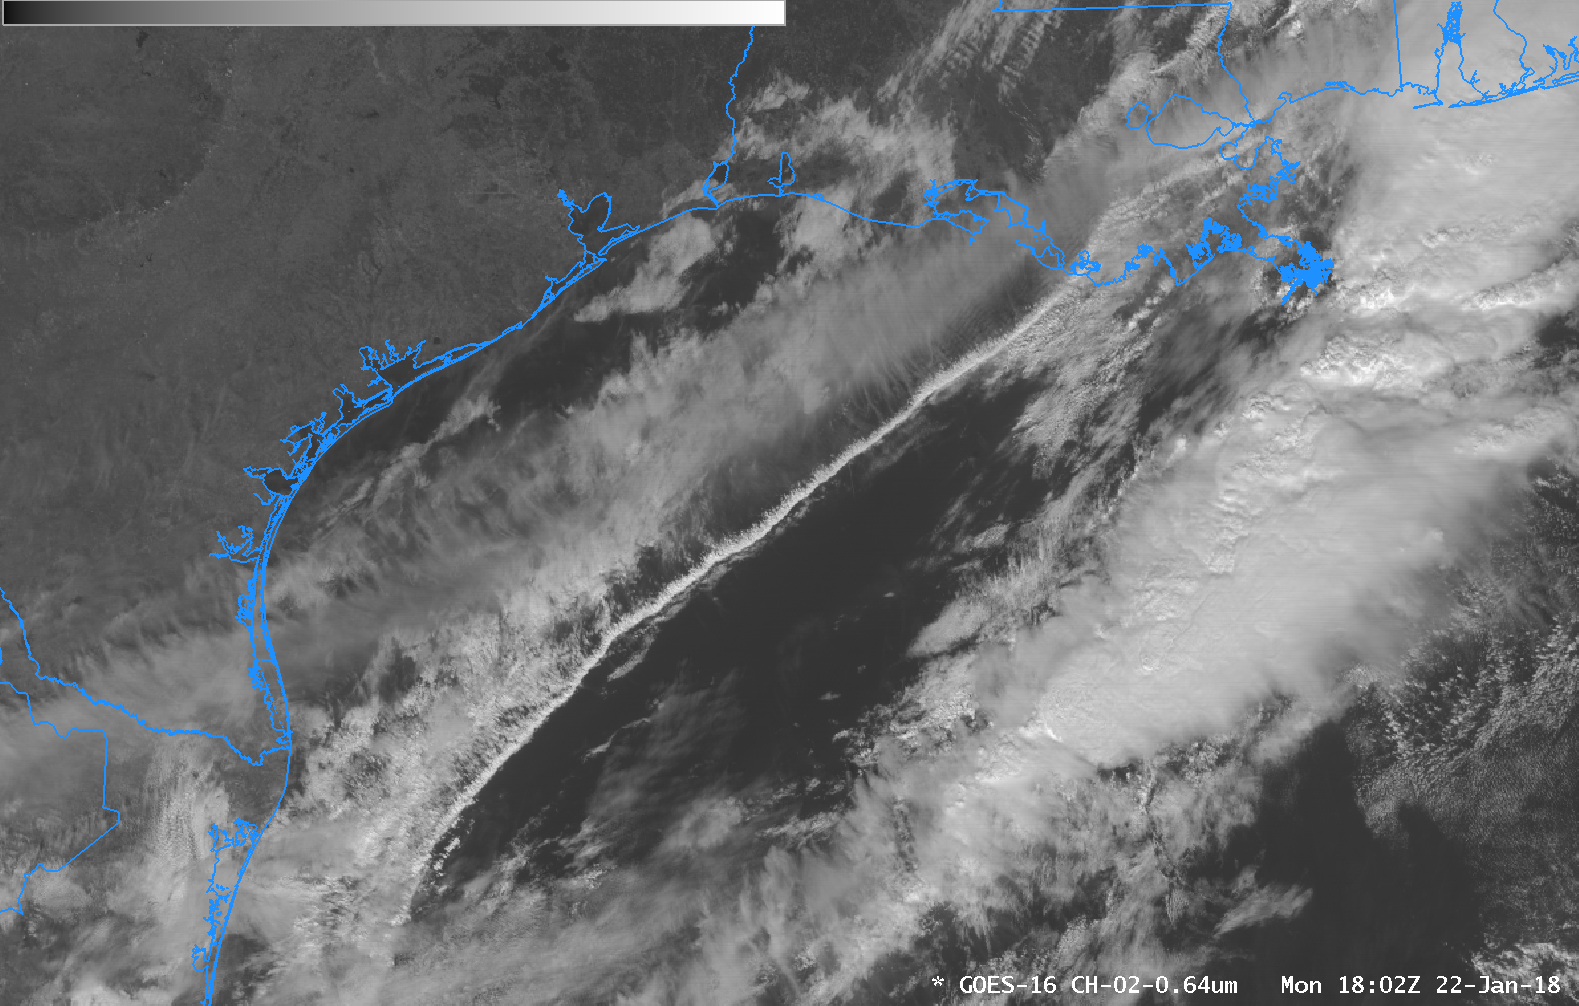
![GOES-16 Visible (0.64 µm) images, with hourly precipitation type plotted in yellow [click to play MP4 animation]](https://cimss.ssec.wisc.edu/satellite-blog/wp-content/uploads/sites/5/2018/01/G16_VIS_BLIZZARD_22JAN2018_960x1280_B2_2018022_180028_0001PANEL_00181.GIF)
![30-second GOES-16 Visible (0.64 µm) images, with hourly precipitation type plotted in yellow [click to play MP4 animation]](https://cimss.ssec.wisc.edu/satellite-blog/wp-content/uploads/sites/5/2018/01/G16_VIS_MESO_BLIZZARD_22JAN2018_960x1280_B2_2018022_153858_0001PANEL_00078.GIF)

![Himawari-8 False-color RGB images [click to animate]](https://cimss.ssec.wisc.edu/satellite-blog/wp-content/uploads/sites/5/2018/01/180122_himawari8_Mayon_rgb_anim.gif)
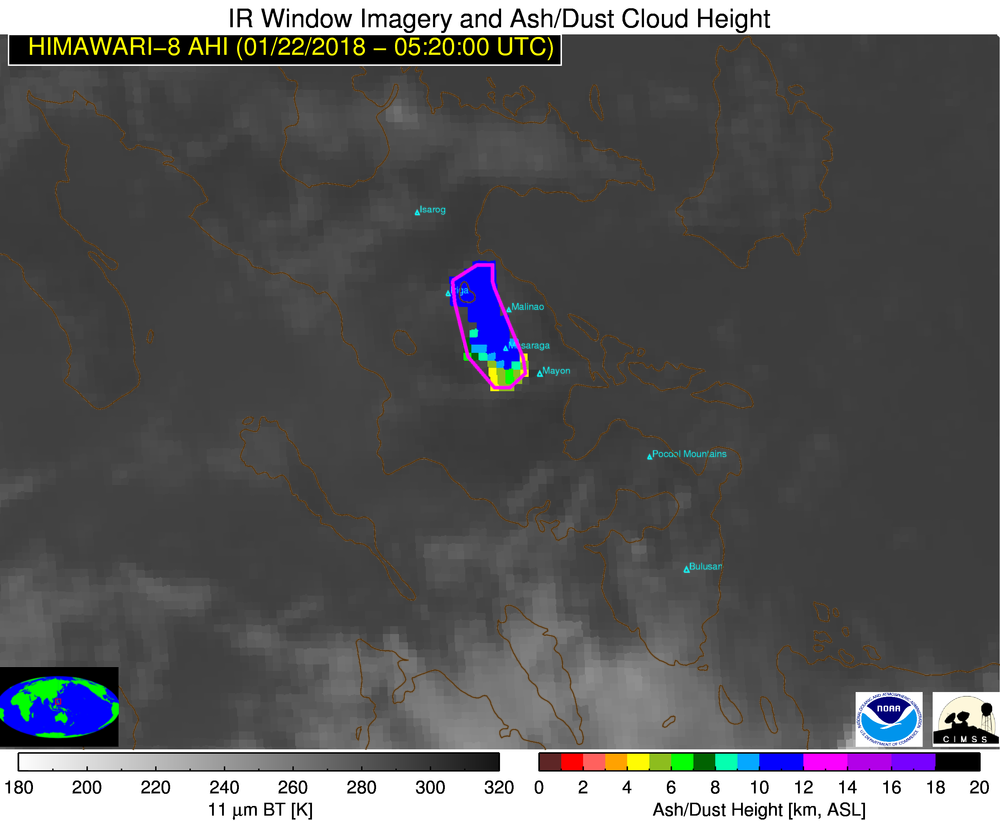
![Himawari-8 Ash Cloud Height product [click to animate]](https://cimss.ssec.wisc.edu/satellite-blog/wp-content/uploads/sites/5/2018/01/180122_himawari8_Mayon_ash_height_anim.gif)
![Plot of rawinsonde data from Legaspi, Philippines [click to enlarge]](https://cimss.ssec.wisc.edu/satellite-blog/wp-content/uploads/sites/5/2018/01/180122_00UTC_98444_RAOB.GIF)
![Suomi NPP VIIRS True-color RGB image [click to enlarge]](https://cimss.ssec.wisc.edu/satellite-blog/wp-content/uploads/sites/5/2018/01/180122_0507utc_suomi_npp_viirs_truecolor_Mayon_anim.gif)

/ASIA2018_01_22_022_npp.gif)