A large cluster of fires burning in central Argentina became hot enough to generate a brief pyrocumulonimbus (pyroCb) cloud on 29 January 2018; according to media reports, on that day there were winds of 55 km/hour (34 mph) and temperatures of 37 ºC (98.6 ºF) in the vicinity of these La... Read More
![GOES-16 Visible (0.64 µm, top), Shortwave Infrared (3.9 µm, center) and Infrared Window (10.3 µm) images [click to play animation]](https://cimss.ssec.wisc.edu/satellite-blog/wp-content/uploads/sites/5/2018/01/320x1280_AGOES16_B2713_GOES16_VIS_SWIR_IR_3PANEL_ARGENTINA_PYROCU_29JAN2018_2018029_174543_0003PANELS.GIF)
GOES-16 Visible (0.64 µm, top), Shortwave Infrared (3.9 µm, center) and Infrared Window (10.3 µm, bottom) images [click to play animation]
A large cluster of fires burning in central Argentina became hot enough to generate a brief pyrocumulonimbus (pyroCb) cloud on 29 January 2018; according to
media reports, on that day there were winds of 55 km/hour (34 mph) and temperatures of 37 ºC (98.6 ºF) in the vicinity of these La Pampa province fires. GOES-16
(GOES-East) “Red” Visible (
0.64 µm), Shortwave Infrared (
3.9 µm) and “Clean” Infrared Window (
10.3 µm) images
(above; also available as an MP4 animation) showed the smoke plumes, fire thermal anomalies or “hot spots”
(red pixels) and the cold cloud-top infrared brightness temperatures, respectively. The minimum 10.3 µm temperature was -32.6 ºC at
1745 UTC. Note the relatively warm
(darker gray) appearance on the 3.9 µm image — this is a characteristic signature of pyroCb clouds tops, driven by the aerosol-induced shift toward smaller ice particles (which act as more efficient reflectors of incoming solar radiation).
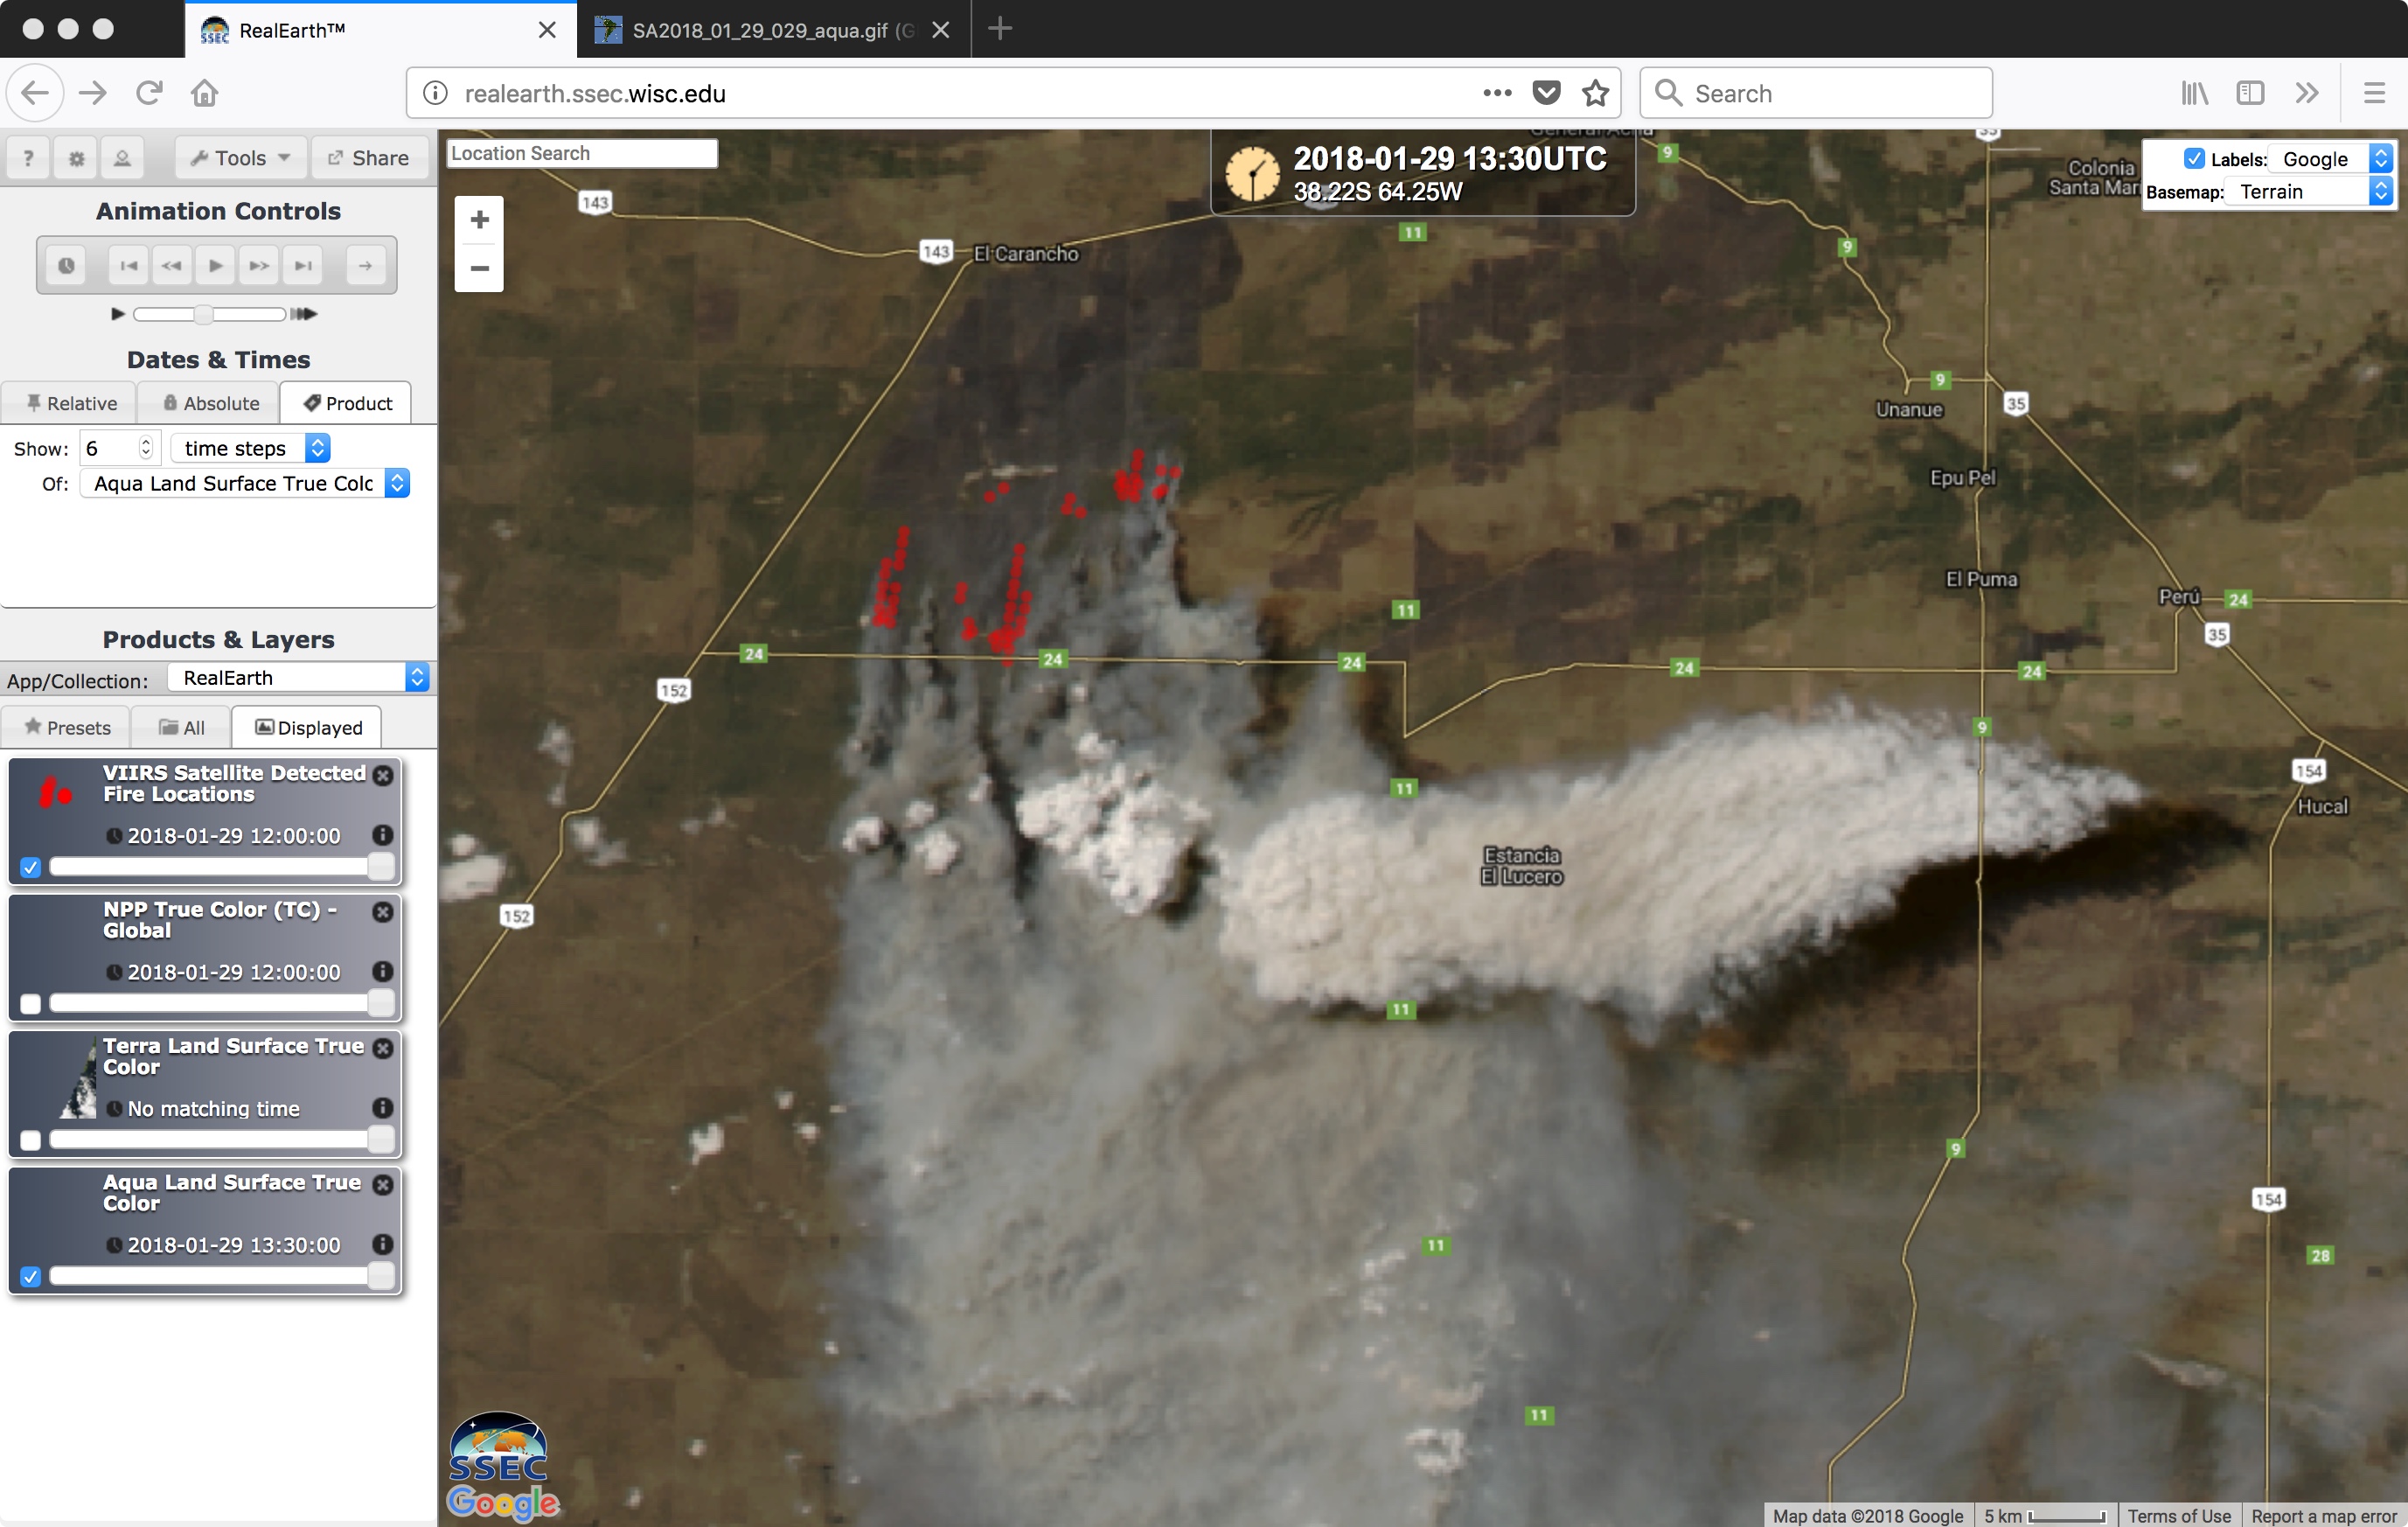
An Aqua MODIS True-color Red-Green-Blue (RGB) image viewed using RealEarth (below) showed the dense lower-tropospheric smoke drifting southward and southeastward from the fire source region, as well as the narrow upper-tropospheric anvil of the pyroCb cloud. Suomi NPP VIIRS fire detection locations are plotted as red dots on the final zoomed-in image. The actual time of the Aqua satellite pass over Argentina was 1812 UTC.
![Aqua MODIS True-color RGB image, with Suomi NPP VIIRS fire detection locations [click to enlarge]](https://cimss.ssec.wisc.edu/satellite-blog/wp-content/uploads/sites/5/2018/01/180129_aqua_modis_truecolor_Argentina_pyroCb_anim.gif)
Aqua MODIS True-color RGB image, with Suomi NPP VIIRS fire detection locations [click to enlarge]
According to
Worldview the coldest MODIS Infrared Window (11.0 µm) cloud-top brightness temperature was -41.2 ºC, thus surpassing the -40 ºC threshold that is generally accepted to classify it as a pyroCb. This is believed to be the first confirmed pyroCb event in South America.
Approximately 120 km north-northeast of the pyroCb cloud, rawinsonde data from Santa Rosa, Argentina (below) indicated that the -41 ºC cloud-top temperature corresponded to altitudes in the 10.8 to 11.6 km range. The air was very dry at that level in the upper troposphere, contributing to the rapid dissipation of the pyroCb cloud material as seen in GOES-16 imagery.
![Plots of rawinsonde data from Santa Rosa, Argentina [click to enlarge]](https://cimss.ssec.wisc.edu/satellite-blog/wp-content/uploads/sites/5/2018/01/180129_12UTC_180130_00UTC_87623_RAOBS.GIF)
Plots of rawinsonde data from Santa Rosa, Argentina [click to enlarge]
48-hour HYSPLIT forward trajectories originating from the center of the pyroCb cloud at altitudes of 7, 9 and 11 km
(below) suggested that a rapid transport of smoke over the adjacent offshore waters of the Atlantic Ocean was likely at those levels.
![HYSPLIT forward trajectories originating at altitudes of 7, 9 and 11 km [click to enlarge]](https://cimss.ssec.wisc.edu/satellite-blog/wp-content/uploads/sites/5/2018/01/180129_18utc_Argentina_pyrocb_7_9_11_km_traj.gif)
HYSPLIT forward trajectories originating at altitudes of 7, 9 and 11 km [click to enlarge]
On 30 January, Suomi NPP OMPS Aerosol Index values
(below; courtesy of Colin Seftor, SSAI at NASA Goddard) were as high as 4.3 over the South Atlantic (at 41.81º South latitude, 53.22º West longitude, 17:31:34 UTC) — consistent with the HYSPLIT transport originating at 7 km.
![Suomi NPP OMPS Aerosol Index on 30 January [click to enlarge]](https://cimss.ssec.wisc.edu/satellite-blog/wp-content/uploads/sites/5/2018/01/180130_suomi_npp_omps_AI_Argentina_pyrocb.jpeg)
Suomi NPP OMPS Aerosol Index on 30 January [click to enlarge]
Additional Suomi NPP VIIRS True-color and OMPS Aerosol Index images can be found on the
OMPS Blog.
===== 01 February Update =====
This analysis of CALIPSO CALIOP data (courtesy of Mike Fromm, NRL) suggests that the upper-tropospheric smoke from this pyroCb event was transported as far as the eastern South Atlantic Ocean by 02 UTC on 01 February, having ascended to altitudes in the 9-10 km range.
View only this post
Read Less

![GOES-16 Low-level (7.3 µm, left), Mid-level (6.9 µm, center) and Upper-level (6.2 µm) images [click to play MP4 animation]](https://cimss.ssec.wisc.edu/satellite-blog/wp-content/uploads/sites/5/2018/01/G16_WATER_VAPOR_ATL_LOW_29AN2018_EXP_960x427_B1098_2018029_150043_0003PANELS_00061.GIF)
![GOES-16 Deep-layer Wind Shear products [click to play animation]](https://cimss.ssec.wisc.edu/satellite-blog/wp-content/uploads/sites/5/2018/01/180129_goes16_deep_layer_shear_anim.gif)
![GOES-16 Visible (0.64 µm, top), Shortwave Infrared (3.9 µm, center) and Infrared Window (10.3 µm) images [click to play animation]](https://cimss.ssec.wisc.edu/satellite-blog/wp-content/uploads/sites/5/2018/01/180129_goes16_visible_swir_ir_Argentina_pyrocu_anim.gif)
![NOAA-19 and GOES-16 Visible images at 2252 UTC, with plots of 23 UTC surface reports [click to enlarge]](https://cimss.ssec.wisc.edu/satellite-blog/wp-content/uploads/sites/5/2018/01/180126_0052utc_noaa19_goes16_visible_Eureka_CA_anim.gif)
![NOAA-19 and GOES-16 Infrared Window images at 2252 UTC, with plots of 23 UTC surface reports [click to enlarge]](https://cimss.ssec.wisc.edu/satellite-blog/wp-content/uploads/sites/5/2018/01/180126_0052utc_noaa19_goes16_infrared_Eureka_CA_anim.gif)
![MODIS Sea Surface Temperature product [click to enlarge]](https://cimss.ssec.wisc.edu/satellite-blog/wp-content/uploads/sites/5/2018/01/180125_modis_sst_anim.gif)
![GOES-16 Water Vapor (6.9 µm) images, with hourly precipitation type plotted in yellow [click to play MP4 animation]](https://cimss.ssec.wisc.edu/satellite-blog/wp-content/uploads/sites/5/2018/01/G16_WV9_WX1_BLIZZARD_22JAN2018_960x1280_B9_2018022_120220_0001PANEL_00145.GIF)
![GOES-16 Visible (0.64 µm) images, with hourly precipitation type plotted in yellow [click to play MP4 animation]](https://cimss.ssec.wisc.edu/satellite-blog/wp-content/uploads/sites/5/2018/01/G16_VIS_BLIZZARD_22JAN2018_960x1280_B2_2018022_180028_0001PANEL_00181.GIF)
![30-second GOES-16 Visible (0.64 µm) images, with hourly precipitation type plotted in yellow [click to play MP4 animation]](https://cimss.ssec.wisc.edu/satellite-blog/wp-content/uploads/sites/5/2018/01/G16_VIS_MESO_BLIZZARD_22JAN2018_960x1280_B2_2018022_153858_0001PANEL_00078.GIF)

/SA2018_01_29_029_aqua.gif)