
GOES-16 ABI Shortwave Infrared imagery (3.9 µm), 1905-2058 UTC on 23 March 2018 (Click to animate)
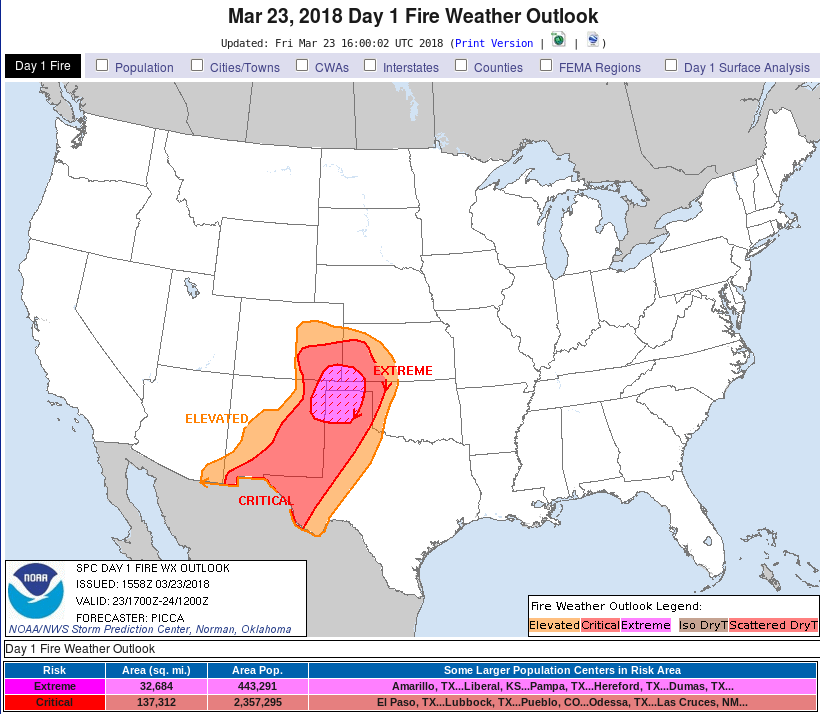
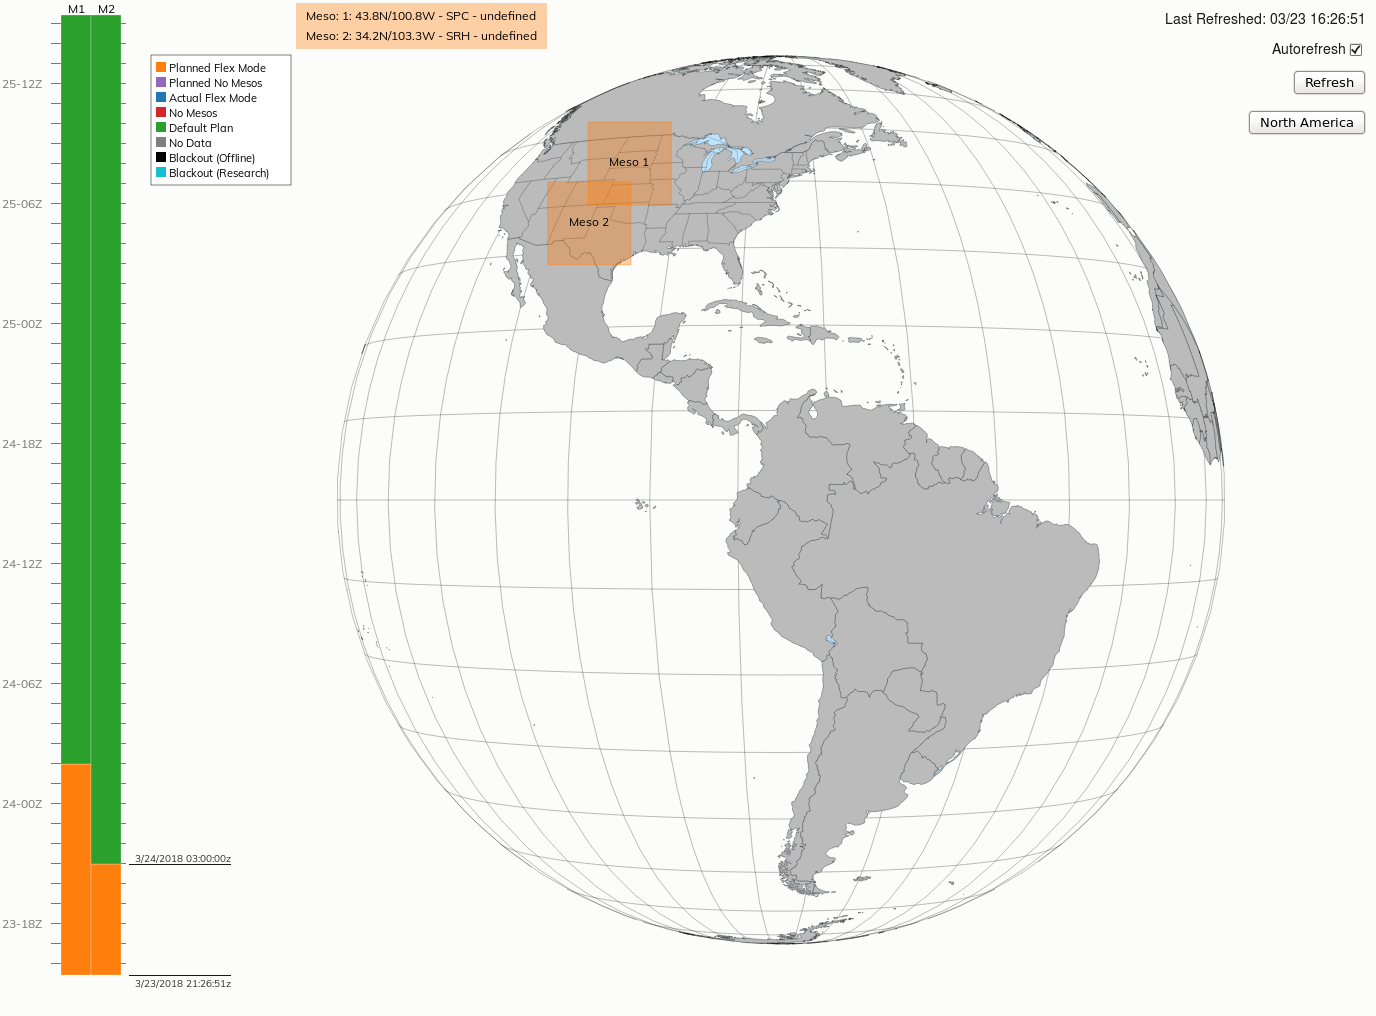
The Storm Prediction Center issued an Extreme Fire Weather advisory for 23 March 2018, and a GOES-16 Mesoscale Sector (#2, from this site) was positioned over the High Plains of Texas to monitor.
The GOES-16 Shortwave Infrared imagery, above, from 1905-2058 UTC on 23 March 2018 shows rapid warming of pixels near Borger TX (KBGD), and then southeast of Borger and northeast of Amarillo (KAMA). Surface observations show gusty southwest winds and low dewpoints, ideal for fire. Under the cirrus shield to the south, decreased solar insolation meant less vertical mixing of dry air and high winds, so dewpoints were higher and winds were weaker, lessening the fire danger.
Note that missing pixels are apparent in the GOES-16 Shortwave IR imagery around 2010 UTC. Quality flags that highlight the extreme warmth of the pixel have been activated, and AWIPS data are reported as missing in those locations.
Visible imagery, both Band 1 (“Blue” Visible, 0.47 µm) and Band 2 (“Red” Visible, 0.64 µm) from the GOES-16 ABI, below, show visible smoke plumes starting around 1940 UTC for the fire near Borger, and closer to 2000 UTC for the fire southeast of Borger. The plumes appear in both visible bands at approximately the same time, although they are more distinct in the blue band because of the enhanced scattering in the atmosphere at that wavelength.
GOES-16 ABI “Blue” Visible imagery (0.47 µm), 1905-2058 UTC on 23 March 2018 (Click to animate)
GOES-16 ABI “Red” Visible imagery (0.64 µm), 1905-2058 UTC on 23 March 2018 (Click to animate)
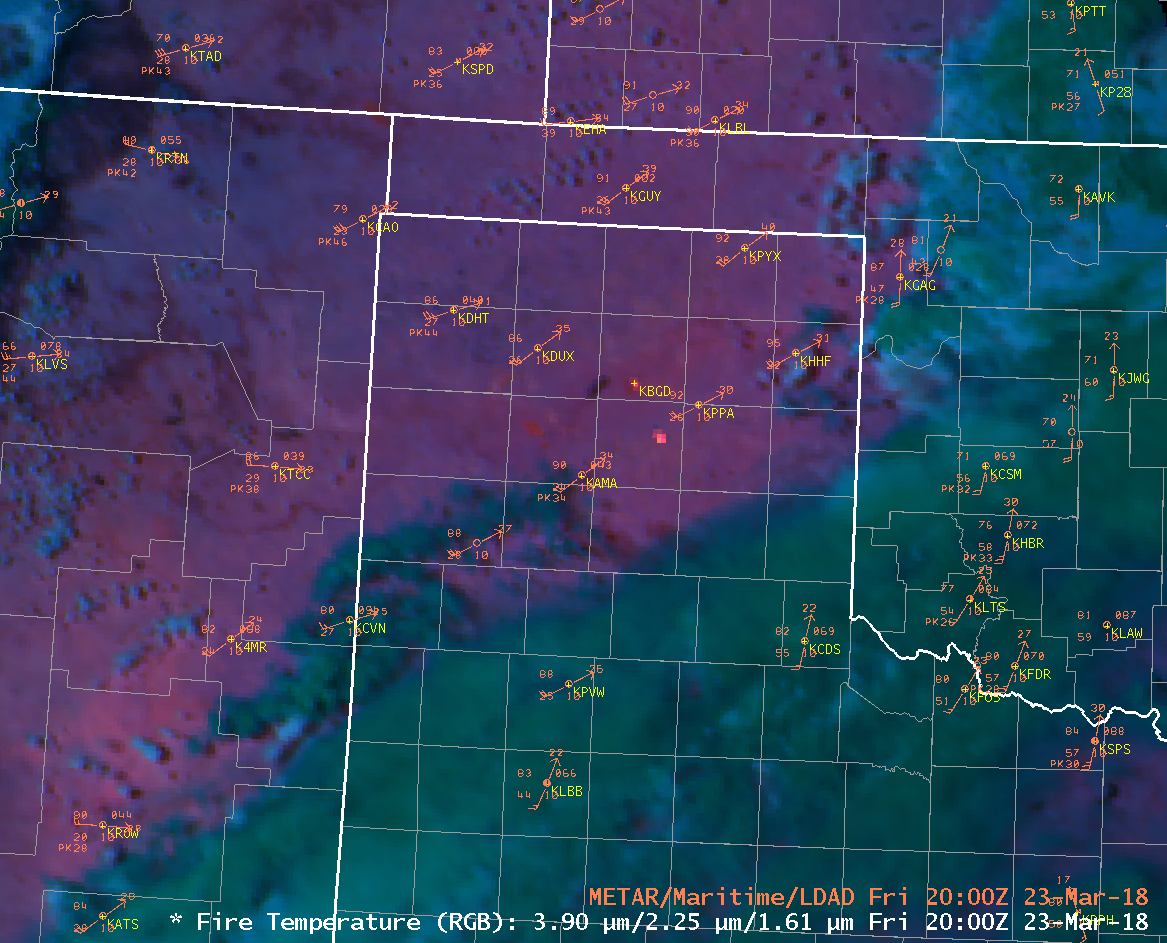
A qualitative method of identifying fires is the Fire RGB that combines the shortwave IR (3.9 µm, the red component of the RGB) with the 2.2 µm (Green) and 1.6 µm (Blue) reflectance channels. As fires become progressively hotter, they emit more and more radiation at shorter wavelengths that can be detected by the ABI on GOES-16, and this alters the color of the RGB over the fire. The Fire RGB animation is shown below. When the 3.9 µm imagery is missing from AWIPS (2005 UTC, 2007-2011 UTC, 2015 UTC because the pixels are hot enough that quality control flags are activated, so the data are not shown), the red pixels in the Fire RGB turn green because no Red component is present (Click here to see the Fire RGB and Shortwave IR animated 2004-2016 UTC).
GOES-16 ABI Fire RGB imagery (3.9 µm, 2.2 µm, 1.6 µm), 1905-2058 UTC on 23 March 2018 (Click to animate)
There are Baseline products that allow a quantitative estimate of fire properties. The animation below shows the Mesoscale Domain Band 7 Shortwave Infrared (3.9 µm) imagery zoomed in over the Texas Panhandle, at 1-minute time-steps; superimposed on the imagery are the GOES-16 Fire Detection Fire Temperature pixels. Fire Products at present are not produced over Mesoscale Domains, so CONUS-scale Fire Products (produced every 5 minutes) are shown instead. The Fire Temperature product in this case has a signal before an obvious signal is present in the 3.9 µm signal — although that could be a function of the 3.9 µm enhancement used here.
An observant reader will notice that the pixels in the GOES-16 Fire Product do not align with the GOES-16 3.9 µm pixels. This is because of the double remapping in the GOES-16 ABI Bands that occurs at NESDIS before data are sent to AWIPS. The Baseline product is not doubly remapped at NESDIS. (This double remapping is being removed from the processing stream shortly).
GOES-16 ABI Shortwave Infrared imagery (3.9 µm), shown every minute, and the GOES-16 Fire Temperature Baseline Product, shown every 5 minutes, 1905-2014 UTC on 23 March 2018 (Click to animate)
This animation (from Pete Wolf, SOO in Jacksonville FL), shows a fast-moving fire in the Fire RGB a bit later. The animation is from the CIRA Slider, similar to this link that shows an animation from 2045 UTC on 23 March to 0045 on 24 March.
View only this post Read Less


