Dan Miller, the Science and Operations Officer (SOO) in Duluth sent the imagery above. Constant icebreaking has been ongoing on Whitefish Bay prior to the opening of the SOO Locks this weekend. A faint black line representing open water is apparent in the 22 March imagery, and it’s even more apparent in the 23 March imagery.A... Read More

GOES-16 ABI Band 2 “Red” (0.64 µm) Visible imagery, 2202 UTC on 22 and 23 March 2018 (Click to enlarge)
Dan Miller, the Science and Operations Officer (SOO) in Duluth sent the imagery above. Constant icebreaking has been ongoing on Whitefish Bay prior to the opening of the SOO Locks this weekend. A faint black line representing open water is apparent in the 22 March imagery, and it’s even more apparent in the 23 March imagery.
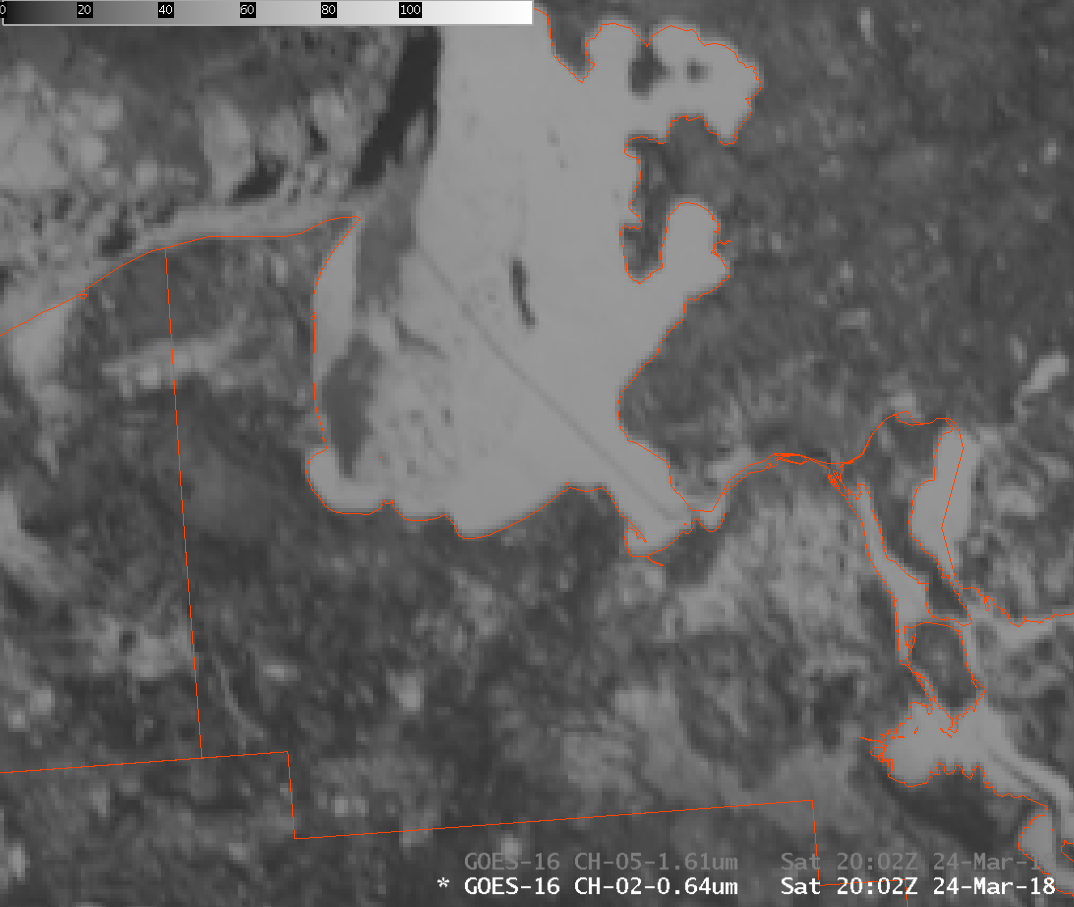
A toggle below, from 24 March 2018, shows the Band 2 “Red” (0.64 µm) Visible and the Band 5 “Snow/Ice” (1.61 µm) Near-Infrared images. The open water is apparent in both images — dark in contrast to the white snow and lake ice in the visible, darker than the adjacent ice in the 1.61 µm. Recall that horizontal resolution in Band 2 is 0.5 km at the sub-satellite point (nadir), and in Band 5 it is 1 km.

GOES-16 ABI Band 2 “Red” (0.64 µm) Visible and Band 5 “Snow/Ice” (1.61 µm) near-infrared imagery, 2202 UTC on 22 and 23 March 2018 (Click to enlarge)
Suomi NPP and NOAA-20 also viewed the icebroken path on 24 March, and favorable orbit geometry for NOAA-20 and Suomi NPP on 24 March (orbit paths from this site) meant 2 sequential passes from both satellites both viewed Whitefish Bay. The 4 images are shown in an animation below, with imagery from NOAA-20 first, then Suomi NPP (the labels all say Suomi NPP erroneously). Note that NOAA-20 data are provisional, non-operational, and undergoing testing still).
VIIRS Visible (0.64 µm, I1) Imagery from NOAA-20 (1708, 1846 UTC) and Suomi-NPP (1756, 1937 UTC) on 24 March 2018 (Click to enlarge)
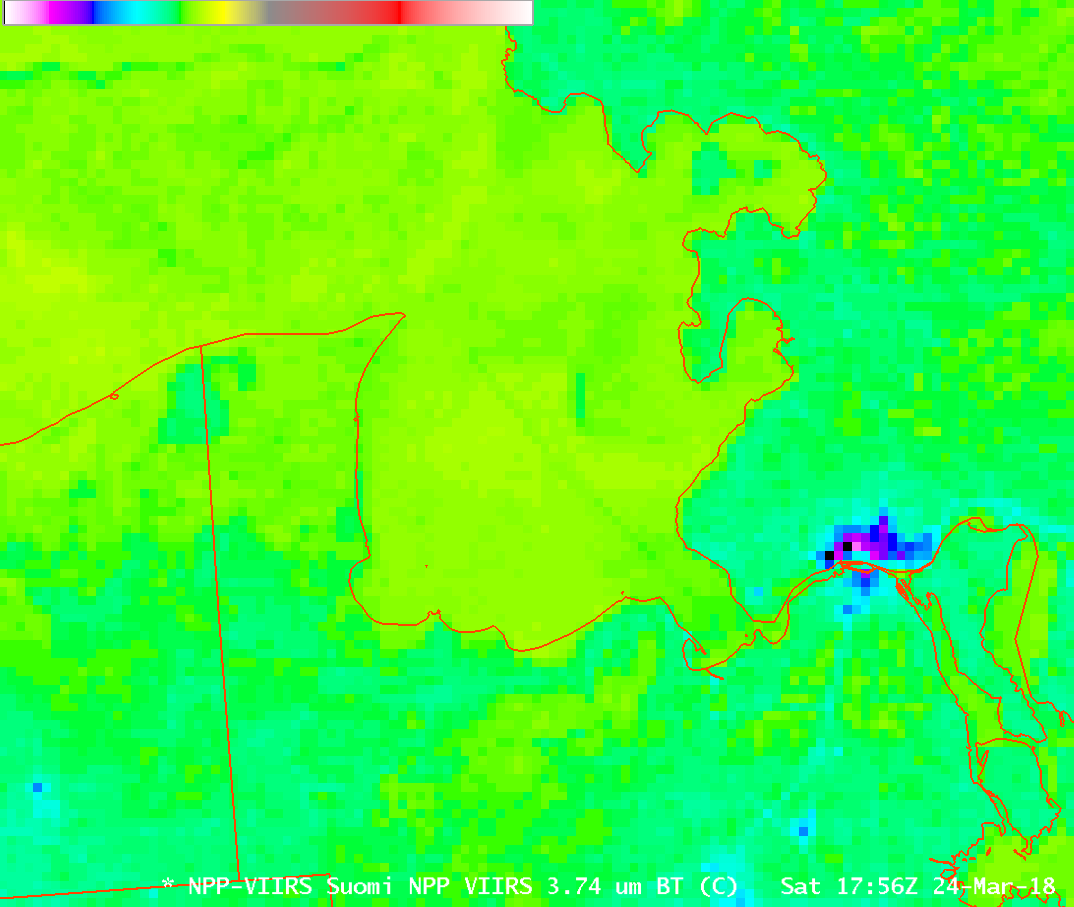
The break in the ice was also visible in Day Night Band Imagery from VIIRS at 0722 UTC (from NOAA-20) on 24 March 2018. It is also apparent in the shortwave Infrared imagery from both GOES-16 (very subtly) and from VIIRS (which offers better spatial resolution).
The icebreaking track was also apparent on 250-meter resolution Terra MODIS True-color and False-color Red-Green-Blue (RGB) images from the MODIS Today site (below). In the False-color image, ice and snow (in areas of sparse vegetation) show up as shades of cyan.
![Terra MODIS True-color and False-color RGB images [click to enlarge]](https://cimss.ssec.wisc.edu/satellite-blog/wp-content/uploads/sites/5/2018/03/180323_1710utc_terra_modis_truecolor_falsecolor_Whitefish_Bay_anim.gif)
Terra MODIS True-color and False-color RGB images [click to enlarge]
View only this post
Read Less
![GOES-16 "Red" Visible (0.64 µm) images, with hourly surface observations plotted in yellow [click to play MP4 animation | Animated GIF also available]](https://cimss.ssec.wisc.edu/satellite-blog/wp-content/uploads/sites/5/2018/03/960x1280_AGOES16_B2_G16_VIS_WAVES_MS_AL_TN_27MAR2018_2018086_210219_0001PANEL.GIF)
![Birmingham, Alabama rawinsonde reports [click to enlarge]](https://cimss.ssec.wisc.edu/satellite-blog/wp-content/uploads/sites/5/2018/03/180327_KBMX_RAOBS.GIF)
![Jackson, Mississippi rawinsonde reports [click to enlarge]](https://cimss.ssec.wisc.edu/satellite-blog/wp-content/uploads/sites/5/2018/03/180327_KJAN_RAOBS.GIF)


![Terra/Aqua MODIS and Suomi NPP VIIRS Shortwave Infrared images with surface observations plotted in cyan [click to enlarge]](https://cimss.ssec.wisc.edu/satellite-blog/wp-content/uploads/sites/5/2018/03/180324_modis_viirs_OK_fires_anim.gif)
